Report an issue
Tell us what's wrong and we'll take a look.
Thanks – we got it. We'll review and follow up if needed.
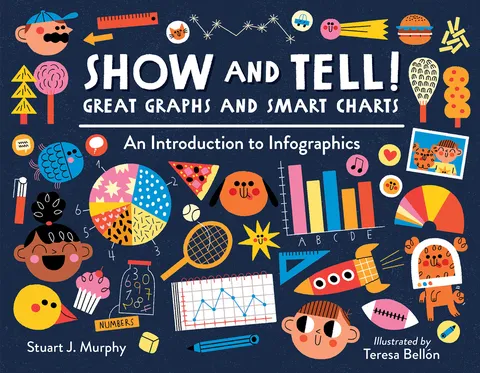
Want to find the most popular meal in the cafeteria? Compare town sports enrollments? Or maybe you just want to know who burps the most in your family! Learn what line graphs, bar graphs, pie charts, and pictographs are and how and when to use them to represent data.
Each project shows how to build a chart or graph and ties it all together with a creative infographic that really puts the A in STEAM (Science, Technology, Engineering, ARTS, and Mathematics). Whether used as an introductory aid or to underscore previous knowledge, the book prepares today's visually savvy children to succeed in school and life by analyzing the world around them.
Stuart J Murphy
Stuart J. Murphy is a visual learning specialist. A graduate of the Rhode Island School of Design, he has a strong background in design and art direction. He also has extensive experience in the world of educational publishing. Drawing on all these talents, Stuart J. Murphy brings a unique perspective to the MathStart series. In MathStart books, pictures do more than tell stories; they teach math.
Stuart J. Murphy and his wife, Nancy, live in Boston.
More by Stuart J Murphy







Why Readwise Books?
Readwise Books is an ebook & audiobook platform that automatically logs how much you and your friends read, making it fun and easy to read more. Learn more →