Python 3 and Data Visualization Using ChatGPT /GPT-4
Report an issue
Tell us what's wrong and we'll take a look.
Thanks – we got it. We'll review and follow up if needed.
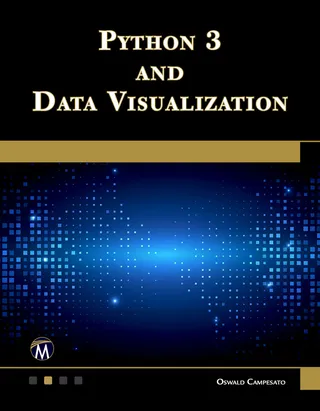
This book is designed to show readers the concepts of Python 3 programming and the art of data visualization. It also explores cutting-edge techniques using ChatGPT/GPT-4 in harmony with Python for generating visuals that tell more compelling data stories. Chapter 1 introduces the essentials of Python, covering a vast array of topics from basic data types, loops, and functions to more advanced constructs like dictionaries, sets, and matrices. In Chapter 2, the focus shifts to NumPy and its powerful array operations, leading into data visualization using prominent libraries such as Matplotlib. Chapter 6 includes Seaborn's rich visualization tools, offering insights into datasets like Iris and Titanic. Further, the book covers other visualization tools and techniques, including SVG graphics, D3 for dynamic visualizations, and more. Chapter 7 covers information about the main features of ChatGPT and GPT-4, as well as some of their competitors. Chapter 8 contains examples of using ChatGPT in order to perform data visualization, such as charts and graphs that are based on datasets (e.g., the Titanic dataset). Companion files with code, datasets, and figures are available for downloading. From foundational Python concepts to the intricacies of data visualization, this book is ideal for Python practitioners, data scientists, and anyone in the field of data analytics looking to enhance their storytelling with data through visuals. It's also perfect for educators seeking material for teaching advanced data visualization techniques.


Why Readwise Books?
Readwise Books is an ebook & audiobook platform that automatically logs how much you and your friends read, making it fun and easy to read more. Learn more →