2025 World Oil Outlook 2050
Length: • 7 hrs 51 mins
Annotated by Paul Cox

Organization of the Petroleum Exporting Countries
2025 World Oil Outlook 2050

World Oil Outlook 2050 2025

Organization of the Petroleum Exporting Countries
Digital access to the WOO: an interactive user experience 24/7
OPEC's World Oil Outlook (WOO) aims to highlight and deepen understanding of the oil industry's potential future challenges and opportunities. It is also a channel to encourage dialogue, cooperation and transparency between OPEC and other stakeholders within the industry.
As part of OPEC's ongoing efforts to improve user experience of the WOO and provide data transparency, two digital interfaces are made available: the OPEC WOO App and the interactive version of the WOO.
The OPEC WOO App provides increased access to the publication's vital analysis and energyrelated data. It is ideal for energy professionals, oil industry stakeholders, policymakers, market analysts, academics and the media. The App's search engine enables users to easily find information, and its bookmarking function allows them to store and review their favourite articles. Its versatility also allows users to compare graphs and tables interactively, thereby maximizing information extraction and empowering users to undertake their own analysis.
The interactive version of the WOO also provides the possibility to download specific data and information, thereby enhancing user experience.

Download
OPEC publications app
Access the interactive version

OPEC is a permanent, intergovernmental organization, headquartered in Vienna, Austria. The Organization comprises 12 Members: Algeria, Republic of the Congo, Equatorial Guinea, Gabon, the Islamic Republic of Iran, Iraq, Kuwait, Libya, Nigeria, Saudi Arabia, the United Arab Emirates and Venezuela.
© OPEC Secretariat, July 2025 Helferstorferstrasse 17 A-1010 Vienna, Austria www.opec.org
ISBN 978-3-9505790-0-0
The data, analysis and any other information (the "information") contained in the World Oil Outlook (the "WOO") is for informational purposes only and is neither intended as a substitute for advice from business, finance, investment consultant or other professional; nor is it meant to be a benchmark or input data to a benchmark of any kind. Whilst reasonable efforts have been made to ensure the accuracy of the information contained in the World Oil Outlook, the OPEC Secretariat makes no warranties or representations as to its accuracy, relevance or comprehensiveness, and assumes no liability or responsibility for any inaccuracy, error or omission, or for any loss or damage arising in connection with or attributable to any action or decision taken as a result of using or relying on the information in the World Oil Outlook. The views expressed in the World Oil Outlook are those of the OPEC Secretariat and do not necessarily reflect the views of its governing bodies or Member Countries. The designation of geographical entities in the World Oil Outlook, and the use and presentation of data and other materials, do not imply the expression of any opinion whatsoever on the part of OPEC and/or its Member Countries concerning the legal status of any country, territory or area, or of its authorities, or concerning the exploration, exploitation, refining, marketing and utilization of its petroleum or other energy resources.
Full reproduction, copying or transmission of the World Oil Outlook is not permitted in any form or by any means by third parties without the OPEC Secretariat's written permission, however, the information contained therein may be used and/or reproduced for educational and other non-commercial purposes without the OPEC Secretariat's prior written permission, provided that it is fully acknowledged as the copyright holder. The World Oil Outlook may contain references to material(s) from third parties, whose copyright must be acknowledged by obtaining necessary authorization from the copyright owner(s). The OPEC Secretariat or its governing bodies shall not be liable or responsible for any unauthorized use of any third party material(s). All rights of the World Oil Outlook shall be reserved to the OPEC Secretariat, as applicable, including every exclusive economic right, in full or per excerpts, with special reference but without limitation, to the right to publish it by press and/or by any communications medium whatsoever; translate, include in a data base, make changes, transform and process for any kind of use, including radio, television or cinema adaptations, as well as a sound-video recording, audio-visual screenplays and electronic processing of any kind and nature whatsoever.
Download: All the data presented in this Outlook is available at www.opec.org.
Acknowledgements
Secretary General HE Haitham Al Ghais
Director, Research Division Ayed S. Al-Qahtani
Head, Energy Studies Department Abderrezak Benyoucef
Main contributors
Chapter 1: Key assumptions
Mohammad Alkazimi, Mohannad Al-Suwaidan, Joerg Spitzy, Jan Ban, Eleni Kaditi, Irene Etiobhio, Maciej Filipek, Daniel McKirdy
Chapter 2: Energy demand Haris Aliefendic, Jan Ban, Raed Al-Aameri, Mohammed Attaba
Chapter 3: Oil demand
Jan Ban, Mohammed Attaba, Raed Al-Aameri, Maciej Filipek, Daniel McKirdy
Chapter 4: Liquids supply Julius Walker, Jan Ban
Chapter 5: Refining outlook Mohammed Attaba, Haris Aliefendic, Maciej Filipek
Chapter 6: Oil movements Haris Aliefendic, Mohammed Attaba
Chapter 7: Energy scenarios Jan Ban, Julius Walker
Chapter 8: Focus on Brazil Julius Walker, Haris Aliefendic, Jan Ban
The OPEC Secretariat is grateful for the kind contribution from The Brazilian Petroleum and Gas Institute (IBP) in Chapter 8.
Other contributors
Behrooz Baikalizadeh, Huda Almwasawy, Mhammed Mouraia, Yacine Sariahmed, Sulaiman Saad, Ali Dehghan, Aziz Yahyai, Pantelis Christodoulides, Klaus Stoeger, Mohammad Sattar, Mihni Mihnev, Justinas Pelenis
Editorial, Design & Production Team
Richard Murphy, James Griffin, Carola Bayer, Andrea Birnbach, Soojung Jung, Daniel McKirdy, Xenia Dixon, Sonja Soliman, Liva Novikova
OPEC's Economic Commission Board (as of June 2025)
Samir Madani, Antimo Asumu Obama Asangono, Fernand Epigat, Afshin Javan, Mohammed Adnan Ibrahim Al-Najjar, Abdullah Al Sabah, Asaad Khalifa, Maryamu Idris, Mohamed Kurdi, Salem Hareb Al Mehairi, Ronny Rafael Romero Rodriguez
Contents
| FOREWORD | 1 | |
|---|---|---|
| EXECUTIVE SUMMARY | 5 | |
| INTRODUCTION | 17 | |
| CHAPTER 1 KEY ASSUMPTIONS 1.1 1.2 Economic growth 1.3 Energy policies 1.4 | Population and demographics Technology and innovation | 21 22 28 40 50 |
| CHAPTER 2 ENERGY DEMAND 2.1 2.2 2.3 2.4 2.5 2.6 | Major trends in energy demand Energy demand by major regions Energy demand by fuel Energy demand by sector Electricity demand and generation Energy intensity and consumption per capita | 59 60 65 73 92 96 101 |
| CHAPTER 3 OIL DEMAND 3.1 3.2 3.3 | Oil demand outlook by region Oil demand outlook by sector Oil demand outlook by product | 107 109 131 156 |
| CHAPTER 4 LIQUIDS SUPPLY 4.1 4.2 4.3 4.4 4.5 DoC liquids 4.6 | Global liquids supply outlook Drivers of medium-term and long-term liquids supply Breakdown of liquids supply outlook by main regions Breakdown of liquids supply by type Upstream investment requirements | 161 162 164 164 174 179 180 |
| CHAPTER 5 REFINING OUTLOOK 5.1 5.2 5.3 5.4 Refinery closures 5.5 Secondary capacity 5.6 5.7 5.8 | Existing refinery capacity Distillation capacity outlook Refining sector market balance Refined products supply and demand balances Investment requirements Downstream industry implications | 183 184 191 198 210 213 222 224 225 |

| CHAPTER 6 OIL MOVEMENTS | 229 | |
|---|---|---|
| 6.1 | Logistics developments | 230 |
| 6.2 | Crude oil, condensate and refined product movements | 232 |
| CHAPTER 7 ENERGY SCENARIOS | 251 | |
| 7.1 | Energy demand and mix | 253 |
| 7.2 | Oil demand | 261 |
| 7.3 | Dialogue, open-minded analysis and transparency help to map out our common energy future | 265 |
| CHAPTER 8 FOCUS ON BRAZIL | 267 | |
| 8.1 | Specifics of Brazil | 268 |
| 8.2 | Primary energy demand | 270 |
| 8.3 | Oil demand | 272 |
| 8.4 | Liquids supply | 275 |
| 8.5 | Refining sector | 277 |
| 8.6 | Renewables and other energy sources: Brazil's energy policies, climate change and sustainable development | 280 |
| 8.7 | G20, BRICS and COP30 – Brazil's role in energy and climate policy diplomacy | 290 |
| Annex A | Abbreviations | 295 |
| Annex B | Regional definitions for energy and oil demand | 299 |
| Annex C | Regional definitions for oil refining and trade | 303 |
| Annex D | Major data sources | 307 |

List of boxes
| Box 8.1 | The Equatorial Margin: A New Frontier for Brazil's Offshore Exploration | 276 |
|---|---|---|
| Box 8.2 | Offshore Wind Energy in Brazil: Potential, Investments, and Regulatory Advances | 283 |
| Box 8.3 | The Future Fuel Law | 286 |
| Box 8.4 | Energy Transition Accelerate Programme (PATEN) | 289 |
List of tables
| Table 1.1 | World population by region | 23 |
|---|---|---|
| Table 1.2 | Working population by region | 25 |
| Table 1.3 | Urban population by region | 27 |
| Table 1.4 | Net migration by region | 28 |
| Table 1.5 | Medium-term annual GDP growth rate (in real terms, 2021 PPP) | 31 |
| Table 1.6 | Long-term annual GDP growth rate (in real terms) | 36 |
| Table 2.1 | World primary energy demand by fuel, 2024–2050 | 61 |
| Table 2.2 | Total primary energy demand by region, 2024–2050 | 63 |
| Table 2.3 | OECD primary energy demand by fuel type, 2024–2050 | 67 |
| Table 2.4 | Non-OECD primary energy demand by fuel type, 2024–2050 | 69 |
| Table 2.5 | China primary energy demand by fuel type, 2024–2050 | 70 |
| Table 2.6 | India primary energy demand by fuel type, 2024–2050 | 72 |
| Table 2.7 | Oil demand by region, 2024–2050 | 74 |
| Table 2.8 | Coal demand by region, 2024–2050 | 77 |
| Table 2.9 | Natural gas demand by region, 2024–2050 | 79 |
| Table 2.10 | Nuclear energy demand by region, 2024–2050 | 83 |
| Table 2.11 | Hydropower energy demand by region, 2024–2050 | 86 |
| Table 2.12 | Biomass energy demand by region, 2024–2050 | 88 |
| Table 2.13 | 'Other renewables' energy demand by region, 2024–2050 | 90 |
| Table 2.14 | Global electricity generation by fuel, 2024–2050 | 99 |
| Table 3.1 | Medium-term oil demand by region | 111 |
| Table 3.2 | Long-term oil demand by region | 113 |
| Table 3.3 | Global oil demand by sector, 2024–2050 | 132 |
| Table 3.4 | Number of passenger cars by region, 2024–2050 | 137 |
| Table 3.5 | Number of commercial vehicles by region, 2024–2050 | 138 |
| Table 3.6 | Number of electric vehicles by region, 2024–2050 | 139 |
| Table 3.7 | Oil demand in the road transportation sector by region, 2024–2050 | 142 |
| Table 3.8 | Oil demand in the aviation sector by region, 2024–2050 | 144 |
| Table 3.9 | Oil demand in the petrochemical sector by region, 2024–2050 | 147 |
| Table 3.10 | Oil demand in the residential/commercial/agricultural sector by region, 2024–2050 | 150 |
| Table 3.11 | Oil demand in the marine bunkers sector by region, 2024–2050 | 152 |
| Table 3.12 | Oil demand in the 'other industry' sector by region, 2024–2050 | 153 |
| Table 3.13 | Oil demand in the rail and domestic waterways sector by region, 2024–2050 | 154 |
| Table 3.14 | Oil demand in the electricity generation sector by region, 2024–2050 | 155 |
| Table 3.15 | Global oil demand by product, 2024–2050 | 156 |
| Table 4.1 | Long-term global liquids supply outlook | 163 |
| Table 4.2 | US total liquids production outlook | 166 |
| Table 4.3 | Non-DoC liquids supply outlook by type | 175 |
| Table 4.4 | Non-DoC tight oil outlook | 175 |

| Table 4.5 | Long-term non-DoC biofuels and other liquids production outlook | 179 |
|---|---|---|
| Table 5.1 | Global base refining capacity as of January 2025 | 187 |
| Table 5.2 | Distillation capacity additions from existing projects by region, 2025–2030 | 192 |
| Table 5.3 | Refinery distillation capacity additions by period | 195 |
| Table 5.4 | Crude unit throughputs and utilization rates, 2024–2050 | 208 |
| Table 5.5 | Secondary capacity additions from existing projects, 2025–2030 | 214 |
| Table 5.6 | Global capacity requirements by process, 2025–2050 | 217 |
| Table 5.7 | Global cumulative potential for incremental product output, 2025–2030 | 223 |
| Table 8.1 | Primary energy demand, Brazil | 271 |
| Table 8.2 | Fuels of the future | 286 |
List of figures
| Figure 1.1 | World population growth, 1997–2024 versus 2024–2050 | 23 |
| Figure 1.2 | World population by region, 1990–2050 | 24 |
| Figure 1.3 | Working age population growth, 1997–2024 versus 2024–2050 | 26 |
| Figure 1.4 | Urbanization rate by region, 2000–2050 | 26 |
| Figure 1.5 | GDP of major economies, 2020–2050 | 36 |
| Figure 1.6 | Distribution of the global GDP, 2024 and 2050 | 39 |
| Figure 1.7 | Real GDP per capita in 2024 and 2050 | 39 |
| Figure 2.1 | Growth in primary energy demand by fuel, 2024–2050 | 62 |
| Figure 2.2 | Growth in primary energy demand by region, 2024–2050 | 64 |
| Figure 2.3 | Energy mix and primary energy demand in selected regions, 2024–2050 | 65 |
| Figure 2.4 | Growth in primary energy demand by fuel type and region, 2024–2050 | 66 |
| Figure 2.5 | Coal-fired power generation capacity changes in China, 2024 | 75 |
| Figure 2.6 | Coal demand by major region, 2024–2050 | 77 |
| Figure 2.7 | Natural gas demand by major region, 2024–2050 | 79 |
| Figure 2.8 | Nuclear generation by major region | 82 |
| Figure 2.9 | Nuclear net power generation capacity by age | 82 |
| Figure 2.10 | Nuclear energy demand by region, 2024–2050 | 84 |
| Figure 2.11 | Hydropower energy demand by region, 2024–2050 | 86 |
| Figure 2.12 | Biomass energy demand by region, 2024–2050 | 87 |
| Figure 2.13 | 'Other renewables' energy demand by region, 2024–2050 | 90 |
| Figure 2.14 | Global coal demand by sectors, 2024 and 2050 | 92 |
| Figure 2.15 | Global natural gas demand by sectors, 2024 and 2050 | 93 |
| Figure 2.16 | Global total final consumption of electricity by sector, 2024 and 2050 | 95 |
| Figure 2.17 | Global GDP and electricity demand growth, 2000–2024 | 96 |
| Figure 2.18 | Average annual growth rate of electricity demand, 2000–2024 | 97 |
| Figure 2.19 | Electricity demand by region, 2024–2050 | 98 |
| Figure 2.20 | Global electricity generation by fuel, 2024–2050 | 99 |
| Figure 2.21 | Evolution and projections of energy intensity in major regions, 2000–2050 | 102 |
| Figure 2.22 | Average annual rate of improvement in energy intensity, 2024–2050 | 102 |
| Figure 2.23 | Per capita GDP and energy consumption, 2024–2050 | 104 |
| Figure 3.1 | Meditum-term oil demand by region | 112 |
| Figure 3.2 | Incremental oil demand by region, 2024–2030 | 113 |
| Figure 3.3 | Average annual oil demand growth by region, 2024–2050 | 114 |
| Figure 3.4 | OECD oil demand by region, 2024–2050 | 115 |

| Figure 3.5 | OECD oil demand by sector, 2024–2050 | 116 |
|---|---|---|
| Figure 3.6 | OECD oil demand by product, 2024–2050 | 118 |
| Figure 3.7 | Non-OECD oil demand by region, 2024–2030 | 119 |
| Figure 3.8 | Non-OECD oil demand growth by region, 2024–2030 | 120 |
| Figure 3.9 | Non-OECD oil demand growth by region, 2030–2050 | 121 |
| Figure 3.10 | Non-OECD oil demand by sector, 2024–2050 | 122 |
| Figure 3.11 | Non-OECD oil demand by product, 2024–2050 | 123 |
| Figure 3.12 | Oil demand in India by sector, 2024–2050 | 124 |
| Figure 3.13 | Oil demand in India by product, 2024–2050 | 126 |
| Figure 3.14 | Oil demand in China by sector, 2024–2050 | 127 |
| Figure 3.15 | Oil demand in 'Other Asia' by sector, 2024–2050 | 129 |
| Figure 3.16 | Oil demand in the Middle East by sector, 2024–2050 | 130 |
| Figure 3.17 | Global oil demand growth by sector, 2024–2050 | 132 |
| Figure 3.18 | OECD oil demand by sector, 2024 and 2050 | 134 |
| Figure 3.19 | Non-OECD oil demand by sector, 2024 and 2050 | 134 |
| Figure 3.20 | Passenger vehicle ownership by region | 137 |
| Figure 3.21 | Global fleet composition, 2024–2050 | 140 |
| Figure 3.22 | China fleet composition, 2024–2050 | 141 |
| Figure 3.23 | Regional demand in the petrochemical sector by product, 2024–2050 | 149 |
| Figure 3.24 | Demand growth by product category between 2024 and 2050 | 157 |
| Figure 3.25 | Growth in global oil demand by product | 158 |
| Figure 4.1 | Long-term non-DoC liquids supply outlook | 162 |
| Figure 4.2 | Composition of global liquids supply growth, 2024–2050 | 163 |
| Figure 4.3 | Major contributors to non-DoC total liquids growth, 2024–2030 | 164 |
| Figure 4.4 | Non-DoC liquids supply outlook by region | 165 |
| Figure 4.5 | US total liquids production outlook by source | 166 |
| Figure 4.6 | Canada total liquids production outlook by source | 167 |
| Figure 4.7 | Norway total liquids production outlook by source | 169 |
| Figure 4.8 | UK total liquids production outlook by source | 170 |
| Figure 4.9 | Argentina total liquids production outlook by source | 171 |
| Figure 4.10 | Qatar total liquids production outlook by source | 172 |
| Figure 4.11 | Non-DoC Africa total liquids production outlook by country | 172 |
| Figure 4.12 | India total liquids production outlook by source | 173 |
| Figure 4.13 | China total liquids production outlook by source | 174 |
| Figure 4.14 | Composition of US tight oil production by play | 176 |
| Figure 4.15 | US oil rig count and crude production | 177 |
| Figure 4.16 | Non-DoC NGLs production outlook by country | 178 |
| Figure 4.17 | DoC total liquids supply | 179 |
| Figure 4.18 | Cumulative oil-related investment requirements by segment, 2025–2050 | 180 |
| Figure 4.19 | Annual upstream investment requirements, 2025–2050 | 180 |
| Figure 5.1 | Secondary capacity relative to distillation capacity by major categories, | |
| 2015 and 2024 | 185 | |
| Figure 5.2 | Secondary capacity relative to distillation capacity, January 2025 | 188 |
| Figure 5.3 | Upgrading capacity by technology relative to total upgrading capacity, | |
| January 2025 | 189 | |
| Figure 5.4 | Annual distillation capacity additions and total project investment | 192 |
| Figure 5.5 | Distillation capacity additions from existing projects, 2025–2030 | 193 |
| Figure 5.6 | Distillation capacity additions per period and cumulative, 2025–2050 | 196 |
| Figure 5.7 | Crude distillation capacity additions by region, 2025–2050 | 197 |
| Figure 5.8 | Additional global cumulative refinery crude runs, potential and required | 199 |

| Figure 5.9 | Additional cumulative crude runs in US & Canada, potential and required | 200 |
|---|---|---|
| Figure 5.10 | Additional cumulative crude runs in Europe, potential and required | 201 |
| Figure 5.11 | Additional cumulative crude runs in China, potential and required | 201 |
| Figure 5.12 | Additional cumulative crude runs in Asia-Pacific (excl. China), potential and | |
| required | 202 | |
| Figure 5.13 | Additional cumulative crude runs in the Middle East, potential and required | 203 |
| Figure 5.14 | Additional cumulative crude runs in Russia & Caspian, potential and required | 203 |
| Figure 5.15 | Additional cumulative crude runs in Africa, potential and required | 204 |
| Figure 5.16 | Additional cumulative crude runs in Latin America, potential and required | 204 |
| Figure 5.17 | Net cumulative regional refining potential surplus/deficits versus requirements | 205 |
| Figure 5.18 | Historical and projected global refinery utilization, 2019–2030 | 206 |
| Figure 5.19 | Global oil demand, refining capacity and crude runs, 1980–2030 | 207 |
| Figure 5.20 | Projected net refinery closures by region | 211 |
| Figure 5.21 | Conversion projects by region, 2025–2030 | 215 |
| Figure 5.22 | Global capacity requirements by process type, 2025–2050 | 218 |
| Figure 5.23 | Conversion capacity requirements by region, 2025–2050 | 219 |
| Figure 5.24 | Desulphurization capacity requirements by region, 2025–2050 | 220 |
| Figure 5.25 | Desulphurization capacity requirements by product and region, 2025–2050 | 221 |
| Figure 5.26 | Octane capacity requirements by process and region, 2025–2050 | 222 |
| Figure 5.27 | Expected cumulative surplus/deficit of incremental product output from existing | |
| refining projects, 2025–2030 | 223 | |
| Figure 5.28 | Refinery investments by region, 2025–2050 | 224 |
| Figure 6.1 | Interregional crude oil, condensate and products exports, 2024–2050 | 235 |
| Figure 6.2 | Global average API gravity and sulphur content | 236 |
| Figure 6.3 | Global crude and condensate exports by origin, 2024–2050 | 237 |
| Figure 6.4 | Middle East and Asia-Pacific share of global crude and condensate trade, | |
| 2024–2050 | 238 | |
| Figure 6.5 | Crude and condensate exports from Middle East by major destination | |
| (and local use), 2024–2050 | 239 | |
| Figure 6.6 | Crude and condensate exports from Latin America by major destination | |
| (and local use), 2024–2050 | 240 | |
| Figure 6.7 | Crude and condensate exports from Russia & Caspian by major destination | |
| (and local use), 2024–2050 | 241 | |
| Figure 6.8 | Crude and condensate exports from Africa by major destination (and local use), | |
| 2024–2050 | 242 | |
| Figure 6.9 | Crude and condensate exports from US & Canada by major destination | |
| (and local use), 2024–2050 | 243 | |
| Figure 6.10 | Crude and condensate imports to US & Canada by origin, 2024–2050 | 244 |
| Figure 6.11 | Crude and condensate imports to Europe by origin, 2024–2050 | 245 |
| Figure 6.12 | Crude and condensate imports to Asia-Pacific by origin, 2024–2050 | 246 |
| Figure 6.13 | Regional net crude and condensate imports, 2024, 2030, 2040 and 2050 | 248 |
| Figure 6.14 | Regional net product imports, 2030, 2040 and 2050 | 249 |
| Figure 7.1 | Global primary energy demand in the Reference Case and in alternative scenarios, 2024–2050 | 253 |
| Figure 7.2 | Global primary energy demand in the Reference Case and in alternative scenarios, | |
| 2035 | 255 | |
| Figure 7.3 | Global primary energy demand in the Reference Case and in alternative scenarios, | |
| 2050 | 255 | |
| Figure 7.4 | Change in primary energy demand between the Technology-Driven Scenario | |
| and Reference Case in 2050 | 256 |
| Figure 7.5 | Change in primary energy demand between the Equitable Growth Scenario | |
|---|---|---|
| and Reference Case in 2050 | 258 | |
| Figure 7.6 | Global energy demand by sector in the Reference Case and alternative | |
| scenarios, 2050 | 259 | |
| Figure 7.7 | Global energy system in the Reference Case and alternative scenarios, 2025–2050 | 261 |
| Figure 7.8 | Global liquids demand in the Reference Case and alternative scenarios, | |
| 2024–2050 | 262 | |
| Figure 7.9 | Difference in liquids demand between the Technology-Driven Scenario and | |
| Reference Case by sector in 2050 | 262 | |
| Figure 7.10 | Difference in liquids demand between the Equitable Growth Scenario and | |
| Reference Case by sector in 2050 | 263 | |
| Figure 7.11 | Liquids demand in the Reference Case and alternative scenarios, 2024–2050 | 264 |
| Figure 8.1 | Brazil GDP average annual growth rates, 1990–2050 | 269 |
| Figure 8.2 | Composition of Brazil's GDP, 2024 | 269 |
| Figure 8.3 | Primary energy demand, Brazil | 271 |
| Figure 8.4 | Oil demand in Brazil by sector, 2024–2050 | 273 |
| Figure 8.5 | Oil demand in Brazil by product, 2024–2050 | 274 |
| Figure 8.6 | Brazil total liquids production outlook | 275 |
| Figure 8.7 | Brazil's refining capacity | 277 |
| Figure 8.8 | Brazil refinery throughput | 278 |
| Figure 8.9 | Production profile of refined products | 278 |
| Figure 8.10 | Imports of refined oil products | 279 |
| Figure 8.11 | Exports of refined oil products | 279 |
| Figure 8.12 | Share of primary energy demand in Brazil, 2024 | 281 |
| Figure 8.13 | Share of primary sources in Brazil's electricity generation, 2024 | 281 |
| Figure 8.14 | Offshore wind technical potential in Brazil | 283 |
| Figure 8.15 | Brazilian biofuels production | 285 |
| Figure 8.16 | Accumulated reinjection of CO2 in Brazil | 287 |
Foreword
The 9th OPEC International Seminar at the Hofburg Palace in Vienna sees the launch of the World Oil Outlook (WOO) 2025. With over 1,000 participants attending, including ministers, CEOs, policymakers, academics, analysts and media from around the world, the launch provides a global platform to highlight the Organization's views on future energy pathways that are credible and driven by sound data and robust analysis.
This year's WOO reinforces a theme that OPEC has emphasized in recent years: the need for an 'all-encompassing' approach to future energy pathways and energy security, closely linked with efforts to reduce emissions and ensure sustainable development.
The WOO 2025 does not view any energy in isolation or dismiss anything. Instead, it takes a holistic view, encompassing the realities we see before us, as well as an appraisal of a host of uncertainties, economic, policy-driven and geopolitical, to build a picture centered around a number of key energy issues.
Firstly, the world will require more energy in the decades to come. In this year's WOO, global energy demand is set to expand by 23% to 2050, driven by expanding economic growth, rising populations, increasing urbanization, new energy-intensive industries like artificial intelligence, and the need to bring energy to the billions without it.
Here, we must remember that the future of energy means different things to different people. For those without energy access, it means the need for basic services like lighting, clean cooking options, and the possibility of owning a motorized vehicle or taking a flight. In this regard, it is important to note that it is the developing world – the non-OECD – which sees almost all energy demand growth over the outlook period.
Secondly, the history of energy is one of additions, not subtractions. Indeed, the reality today is that the world consumes more wood, oil, coal, gas, in fact, all energies, than ever before. Moreover, energies tend to complement each other – the rise of coal saw the world use more wood; the rise of oil saw the world use more coal; and renewables and electric vehicles require a host of oil products for their development and use.
In this regard, it is important to note that the combined percentage of oil, gas and coal in the energy mix was around 80% in 2024, only a little less than when OPEC was founded in 1960, despite energy consumption increasing more than five-fold over that time.
Positively, it has become increasingly clear to many policymakers in recent years that the narrative of swiftly phasing out oil and gas has been seen for what it is: unworkable, and a fantasy. Many initial net-zero policies promoted unrealistic timelines or had little regard for energy security, affordability or feasibility – this mindset is shifting.
Thirdly, oil and the petroleum products derived from it continue to provide immense benefits to billions. Without them, cars, buses and trucks would be stranded, airplanes would be grounded, the construction sector would all but grind to a halt, food production would be devastated, and many health-related products would be difficult to produce.
Oil underpins the global economy and is central to our daily lives. Out to 2050, we see oil demand continuing to expand and reaching 123 million barrels a day (mb/d). There is no peak oil demand on the horizon.

And fourthly, the WOO emphasizes the need to ramp up efforts across the board to reduce emissions, advance efficiencies and implement lower carbon solutions. In this regard, OPEC Member Countries, and the oil industry, in general, are already playing a proactive and constructive role by undertaking investments in areas such as carbon capture utilization and storage, direct air capture and the circular carbon economy.
What all this underscores is the need for major investments in all energies and technologies, coupled with the need to maintain a realistic understanding of the needs of all peoples. This is a message that OPEC has consistently delivered in recent years.
To put the key issue of investment in context, for the oil industry alone, we see global oil industry investment requirements of $18.2 trillion out to 2050. It is vital that these investments are made for consumers and producers everywhere, as well as for the effective functioning of the global economy at large.
Why? Because it is clear that the world needs all energies to deliver the energy security and energy availability that it desires, and all technologies to achieve the emissions reductions it requires. As such, the need to embrace a prudent approach to future energy pathways for nations and peoples around the world is also central to this year's WOO.
In looking ahead, the platform for building a sustainable energy future not only comes from stability in energy markets, which remains the core focus of OPEC and its partners in the Declaration of Cooperation, but also through all industry stakeholders working together. Collaboration is imperative, data transparency is vital and energy realities must be recognized and prioritized.
The WOO 2025 provides a basis for this, and I would like to take this opportunity to thank all those who have been involved in putting it together. We are proud of this publication and the key insights it offers into the challenges and opportunities shaping our shared energy future, and trust that it will serve as a useful tool for policymakers and experts everywhere.
Haitham Al Ghais Secretary General


Executive Summary
Current uncertainties surrounding the global economy and energy landscape are quite significant
The World Oil Outlook (WOO) 2025 again sets out OPEC's long-term views and projections on the evolving global energy future. However, the current uncertainties surrounding the global economy and energy landscape make this task challenging. Despite this, and bearing in mind the high degree of uncertainty, this Outlook looks to thoroughly review the key assumptions and outline a plausible and viable energy future for all. As such, it intends to provide an impartial, consistent and realistic understanding to all stakeholders.
Energy policies in a state of re-evaluation
Energy policies across major economies are undergoing a significant recalibration as nations navigate an array of complex challenges. While energy policy ambitions appear robust, a noticeable trend of policy pushback and intensified scrutiny is evident, primarily in the US and in a number of other developed countries. Decision-makers are increasingly challenged to address a variety of priorities, including energy security, energy affordability, reducing emissions, sustainability and industrial competitiveness. Furthermore, while many national changes can be relatively small, the cumulative effects on regional and global energy demand can be much more significant.
Demographic trends and economic growth drive long-term energy demand
The global population is expected to rise by 1.5 billion from its current level of 8.2 billion in 2024 to almost 9.7 billion by 2050, with the working age population set to increase by 800 million over the same time period to reach around 6.1 billion. The global urbanization rate is expected to increase from 58% to 68%, resulting in about 1.9 billion people moving to cities by 2050. Concurrently, the global economy is set to more than double in size, increasing from $171 trillion in 2024 to $358 trillion in 2050, while global average income is expected to rise from approximately $21,000 in 2024 to $37,100 (all 2021 PPP) by 2050. Non-OECD countries are set to play the key role, driving population expansion and seeing economic growth rates well above the global average.
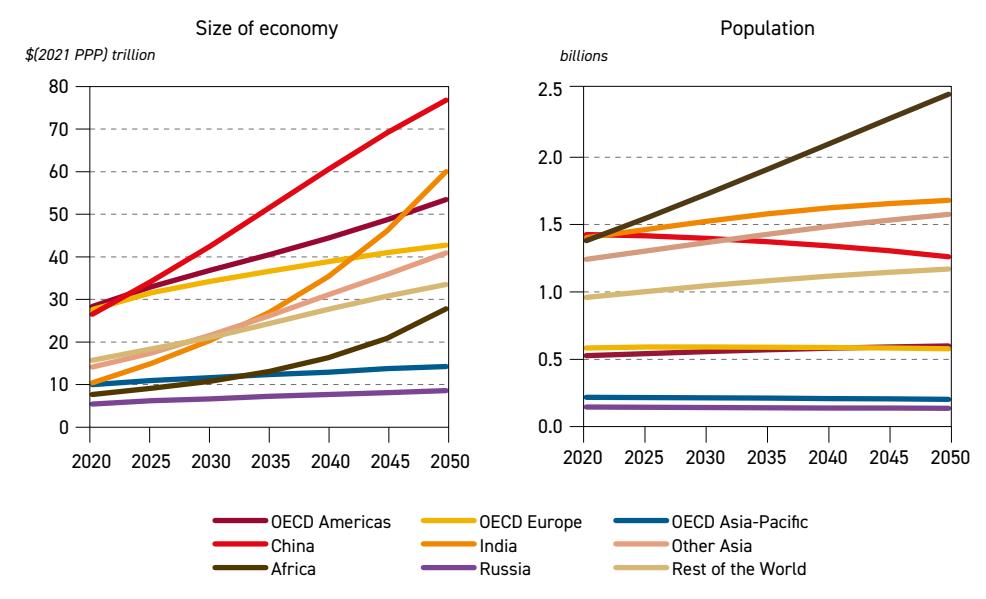
Size of major economies and population trends, 2020–2050
Source: OPEC.
Global primary energy demand to increase by 23% to 2050
Global primary energy demand is set to rise from 308 million barrels of oil equivalent (mboe/d) in 2024 to 378 mboe/d in 2050. This is an increase of 23% over the outlook period, or 0.8% per annum (p.a.) on average. The growth will come almost entirely from developing regions, led by India, Other Asia, Africa and the Middle East. At the same time, energy demand in developed countries is expected to generally stay flat and/or decline.
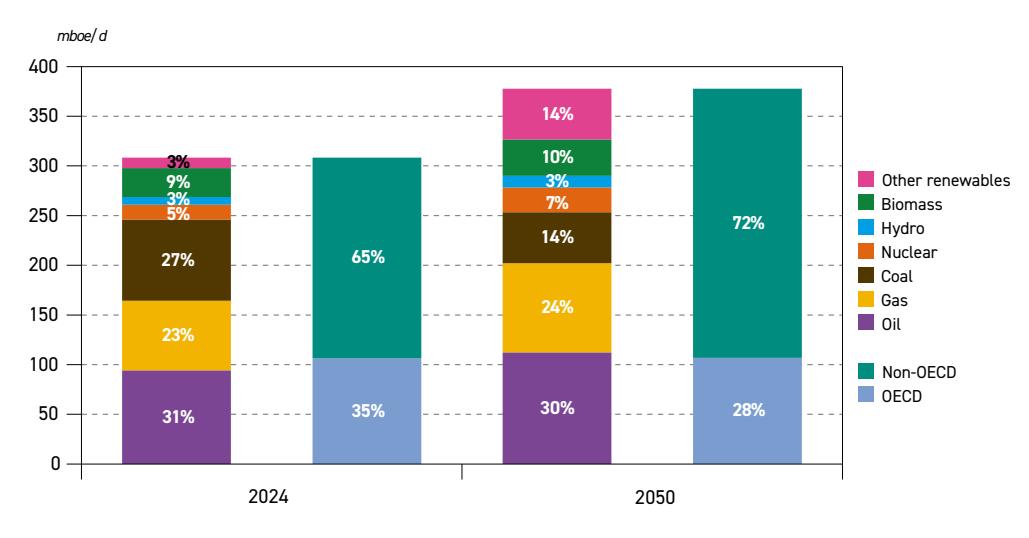
Total primary energy demand by fuel and region, 2024 and 2050
Source: OPEC.
Demand for all fuels increases, with the exception of coal
Demand for all primary fuels is set to increase to 2050, with the exception of coal. Driven by supportive polices and declining electricity generation costs, demand for other renewables (mostly wind and solar) is set to increase by 40.5 mboe/d over the outlook period. Demand for oil and gas is also expected to increase strongly, in line with the need for reliable and Figure 2.1
Growth in primary energy demand by fuel, 2024–2050
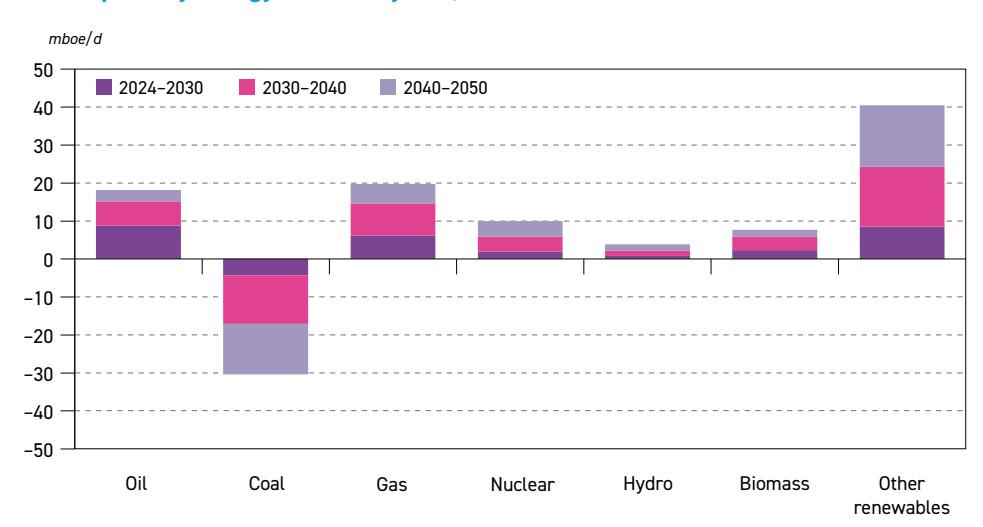
Source: OPEC.

affordable energy. Oil demand is expected to rise by 18.2 mboe/d, while natural gas rises by almost 20 mboe/d to 2050. After a long period of stagnation, nuclear energy is likely to see significant growth, rising by 10 mboe/d in the outlook period. Demand for coal is expected to drop by 30.4 mboe/d, due to unfavourable energy and climate policies and the penetration of other fuels.
Oil retains the largest share in the energy mix; oil and gas combined remain above 50%, with other renewables at 13.5% in 2050
Despite a marginal decline in its share, oil is set to maintain the largest share in the energy mix in 2050, at just below 30%. The combined share of oil and gas is expected to stay above 50% between 2024 and 2050. At the same time, the share of other renewables in the energy mix increases to 13.5% in 2050, up by 10 percentage points (pp) from 2024.
Electricity demand set to rise by over 80%, supported by growth in developing countries
Total electricity generation is expected to increase from around 31,500 terawatt hours (TWh) in 2024 to roughly 57,500 TWh in 2050, supported by demand growth in the residential/ commercial sector, industry and data centres. Around 75% of this growth is anticipated to come from developing countries, with almost 60% alone from developing countries in Asia. By far the largest increase in the generation mix is projected for other renewables (mostly wind and solar), which are expected to expand from around 4,900 TWh in 2024 to 26,000 TWh in 2050.
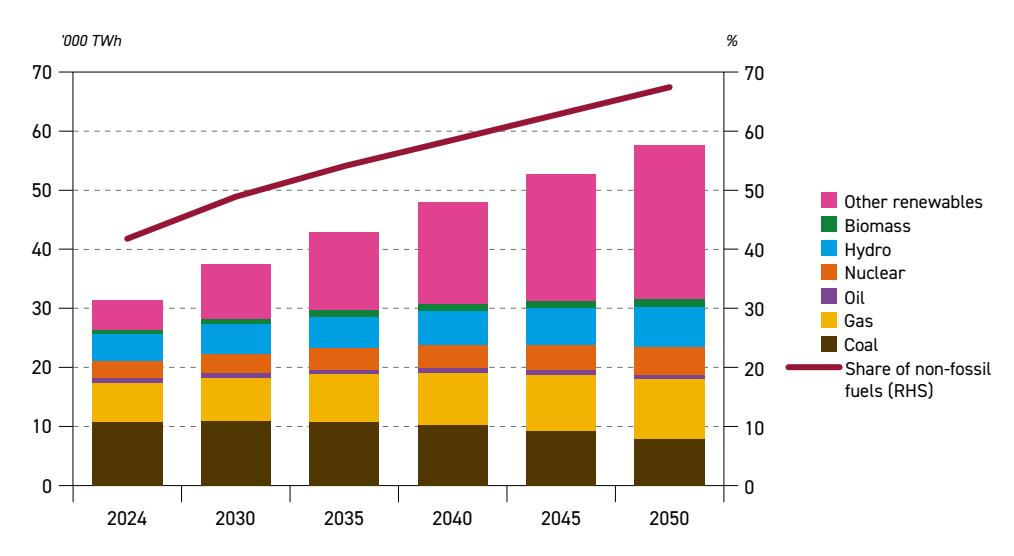
Global electricity generation by fuel, 2024–2050
Source: OPEC.
Global oil demand set for continued robust growth, reaching almost 123 mb/d by 2050 Supported by recent policy shifts and an improved economic outlook, global oil demand is set for continued robust growth of 9.6 millon barrel per day (mb/d) over the medium-term period, rising from 103.7 mb/d in 2024 to 113.3 mb/d by 2030. The primary reason for this is strong oil demand growth in non-OECD countries, which is projected to increase by 8.6 mb/d to 2030 and reach 66.7 mb/d. Moreover, OECD oil demand is also set to increase over the same period, albeit by a much smaller 1 mb/d to reach 46.6 mb/d.

In the long term, global oil demand is projected to rise by more than 19 mb/d between 2024 and 2050, reaching almost 123 mb/d. While non-OECD oil demand is projected to increase by almost 28 mb/d over the period, OECD oil demand is set to witness a decline of 8.5 mb/d.
Long-term oil demand in the Reference Case
| 2024 | 2030 | 2035 | 2040 | 2045 | 2050 | Growth 2024–2050 | |
|---|---|---|---|---|---|---|---|
| OECD Americas | 24.9 | 25.7 | 25.5 | 24.3 | 23.0 | 21.9 | –3.0 |
| OECD Europe | 13.5 | 13.6 | 12.7 | 11.6 | 10.6 | 9.8 | –3.7 |
| OECD Asia-Pacific | 7.2 | 7.3 | 6.8 | 6.3 | 5.8 | 5.4 | –1.8 |
| OECD | 45.7 | 46.6 | 45.0 | 42.2 | 39.5 | 37.2 | –8.5 |
| China | 16.7 | 18.3 | 18.9 | 18.9 | 18.8 | 18.4 | 1.8 |
| India | 5.6 | 7.3 | 8.9 | 10.5 | 12.1 | 13.7 | 8.2 |
| Other Asia | 9.7 | 11.4 | 12.6 | 13.5 | 14.3 | 15.0 | 5.3 |
| Latin America | 6.8 | 7.8 | 8.6 | 9.1 | 9.5 | 9.7 | 3.0 |
| Middle East | 8.8 | 10.0 | 11.1 | 12.1 | 12.9 | 13.5 | 4.7 |
| Africa | 4.6 | 5.2 | 6.0 | 6.9 | 7.8 | 8.8 | 4.2 |
| Russia | 4.0 | 4.2 | 4.3 | 4.2 | 4.2 | 4.1 | 0.1 |
| Other Eurasia | 1.3 | 1.4 | 1.5 | 1.6 | 1.6 | 1.6 | 0.4 |
| Other Europe | 0.8 | 0.9 | 0.9 | 0.9 | 0.9 | 0.8 | 0.0 |
| Non-OECD | 58.0 | 66.7 | 72.8 | 77.8 | 82.1 | 85.7 | 27.7 |
| World | 103.7 | 113.3 | 117.9 | 120.0 | 121.6 | 122.9 | 19.2 |
Source: OPEC.
India leads incremental long-term demand growth
India, Other Asia, the Middle East and Africa are set to be the primary sources of long-term oil demand growth. Combined demand in these four regions is set to increase by 22.4 mb/d between 2024 and 2050, with India alone adding 8.2 mb/d. China's oil demand is projected to increase by less than 2 mb/d over the same time horizon. Moreover, a large part of China's
Non-OECD regional oil demand growth, 2024–2050

Source: OPEC.

increase is expected to occur over the medium term, with fewer demand changes expected for the rest of the forecast period.
Road transport, petrochemicals and aviation are key for future oil demand growth
Oil consumption in various transportation modes constitutes the backbone of global oil demand throughout the forecast period. Indeed, the transportation sector accounted for more than 57% of global oil demand in 2024 and, with minor variations, is projected to retain this share over the entire forecast period. Within this sector, the largest incremental oil demand is expected in road transportation and aviation, adding 5.3 mb/d and 4.2 mb/d, respectively. A significant demand increase of 4.7 mb/d is also projected in the petrochemical sector.

Global oil demand growth by sector, 2024–2050
Oil demand growth in road transportation is expected to come on the back of a large expansion in the global vehicle fleet, particularly in developing countries. The global vehicle fleet is expected to increase from 1.7 billion in 2024 to 2.9 billion in 2050, with the fastest growth expected in the segment of electric vehicles (EVs). Nevertheless, internal combustion engine (ICE) vehicles are set to continue dominating the global fleet and still account for around 72% in 2050.
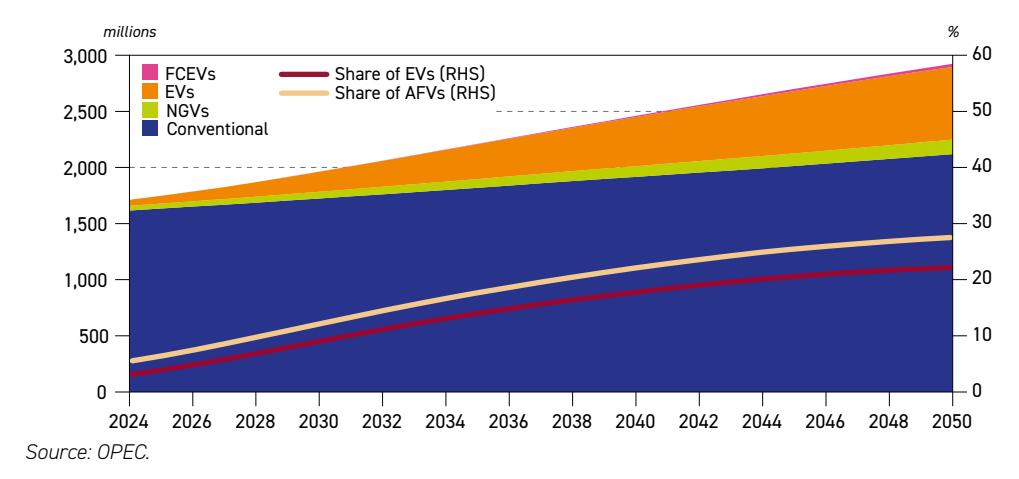
Global fleet composition, 2024–2050

Source: OPEC.
Bulk of future oil demand growth is for light products and middle distillates
Largely reflecting sectoral oil demand trends, light refined products and middle distillates are expected to drive most of the future increase, while heavy products are set to witness only modest changes due to regulatory constraints and ongoing oil substitution by alternative energy sources. As a result, major long-term demand growth is expected for gasoil/diesel (4.4 mb/d), jet/kerosene (4.1 mb/d), liquefied petroleum gas (LPG)/ethane (3.6 mb/d), gasoline (3.1 mb/d) and naphtha (2.7 mb/d).
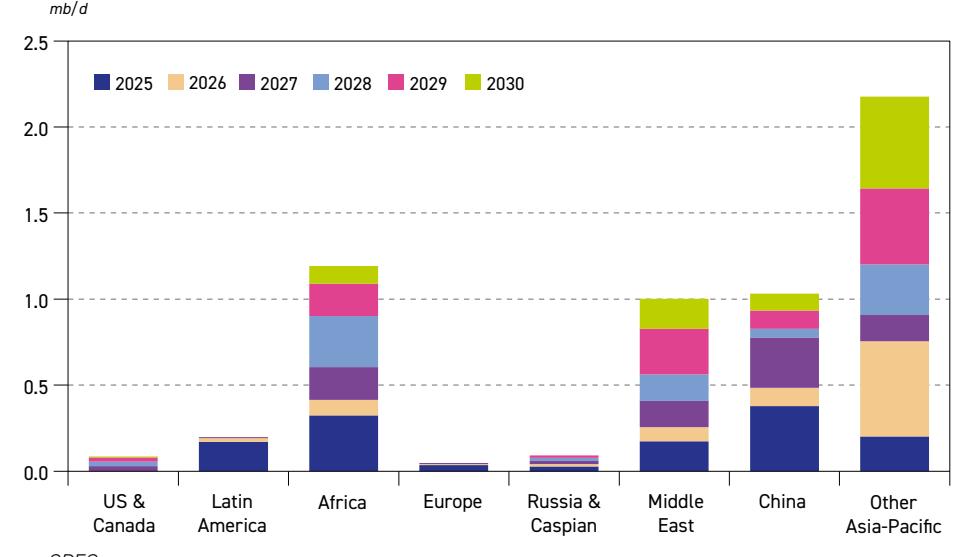
US liquids production drives medium-term supply growth, but peaks in 2030
Non-Declaration of Cooperation (non-DoC) liquids production is set to increase from 53.3 mb/d in 2024 to 59 mb/d in 2030, or by 5.7 mb/d. The US is expected to drive this growth, contributing 1.4 mb/d, or just over 25%, followed by Brazil, Qatar, Canada, Argentina and others. Tight oil remains the key element supporting rising US liquids production, with volumes increasing from 14.7 mb/d in 2024 to 16.5 mb/d in 2030. Thereafter, however, due to gradual resource depletion, output is projected to plateau around those levels for most of the 2030s, and subsequently decline to 14.8 mb/d by 2050.

Major contributors to non-DoC total liquids change, 2024–2030
Source: OPEC.
Beyond 2030, non-DoC liquids supply plateaus around 60 mb/d
US liquids supply is set to peak at just over 23 mb/d in 2030, while total non-DoC liquids are now expected to hit a peak of around 60 mb/d in the mid-2030s, and then remain at a plateau just
Composition of global oil liquids supply growth, 2024–2050

Source: OPEC.
ES
below that level until 2050. Beyond 2030, long-term non-DoC liquids supply growth only takes place in Canada, Brazil and Argentina, as well as a handful of other smaller increases, and this is offset by declines in other mature producing regions. Viewing the entire 2024–2050 period, non-DoC liquids nonetheless increase by 5.6 mb/d, from 53.3 mb/d in 2024 to 58.9 mb/d in 2050.
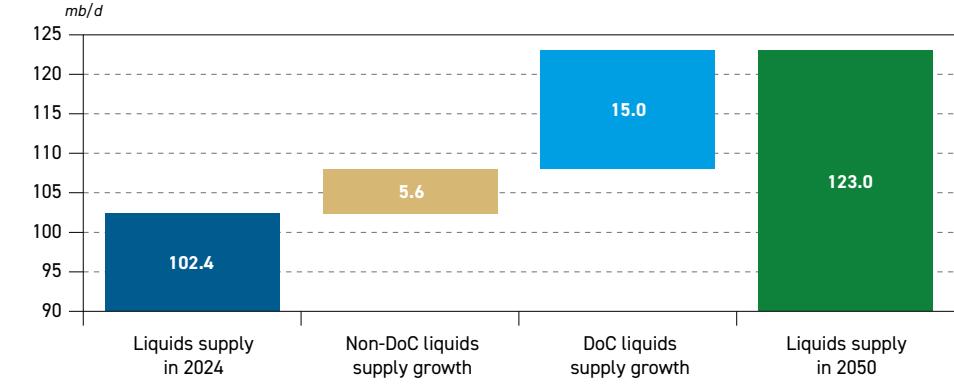
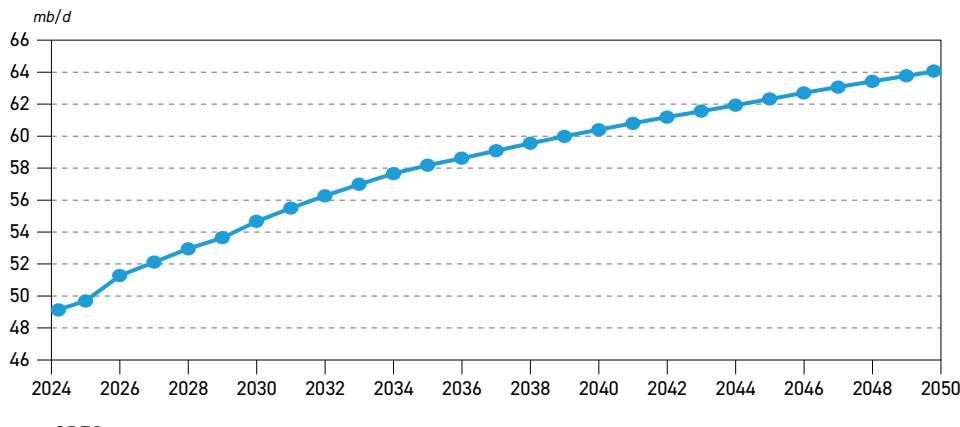
DoC liquids supply set to keep growing
As a result of non-DoC liquids supply plateauing from the 2030s, continued demand growth means that DoC liquids are projected to keep expanding. From 49.1 mb/d in 2024, it increases to 64.1 mb/d in 2050, or by 15 mb/d. As a result, the DoC producers' share of the global liquids supply market increases from 48% in 2024 to 52% in 2050.
Declaration of Cooperation total liquids supply
Source: OPEC.
Required cumulative oil investments estimated at $18.2 trillion by 2050
To reliably supply markets, against the backdrop of rising demand, as well as to offset natural decline in mature fields, global cumulative investments of $18.2 trillion are required over the 2025–2050 period (in 2025 US$). The bulk of the required investment, $14.9 trillion, or $574 billion p.a., is for the upstream sector. The downstream and midstream sectors require another $2 trillion and $1.3 trillion, respectively. The challenge of meeting these investment requirements is huge, and any shortfall in meeting these needs could impact market stability and energy security.
![]()
Cumulative oil-related investment requirements by segment, 2025–2050
Source: OPEC.
Asia-Pacific, Africa and the Middle East lead medium-term refinery capacity additions
The medium-term outlook sees around 5.8 mb/d of new refining capacity coming online. The bulk of this is set to be commissioned in the Asia-Pacific (3.2 mb/d), Africa (1.2 mb/d) and the Middle East (1 mb/d), representing over 90% of the global additions out to 2030. The global annual average rate of capacity additions for the period from 2024–2030 is estimated at just below 1 mb/d.
Distillation capacity additions from existing projects, 2025–2030
Source: OPEC.
Downstream market projected to gradually tighten in the medium term
The medium-term outlook indicates a balanced downstream market in 2025 and 2026 relative to the base year. However, the downstream market is expected to increasingly tighten in the period from 2027 to 2030. The deficit between required and potential refining capacity is set
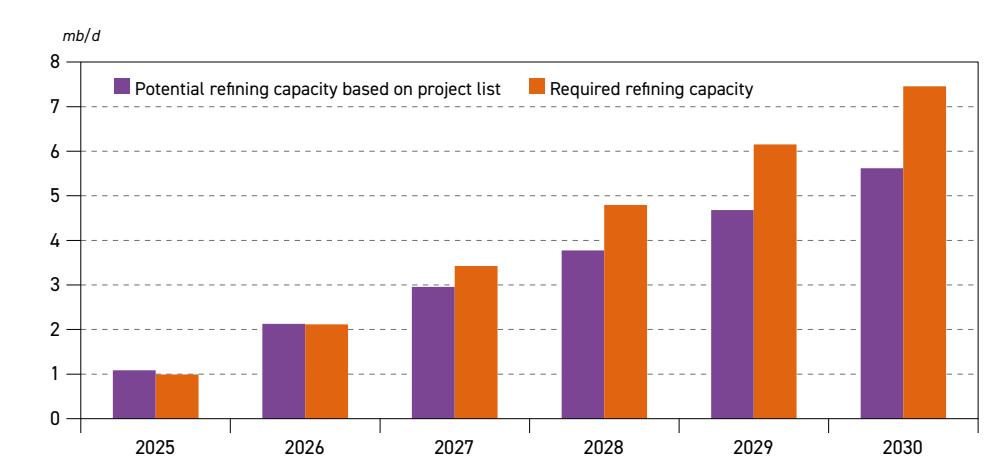
Additional global cumulative refinery crude runs, potential* and required**
* Potential: based on expected distillation capacity additions; assuming no closures.
** Required: based on projected demand increases, assuming no change in refined products trade pattern. Source: OPEC.

to rise steadily from almost 0.5 mb/d in 2027 to around 1.6 mb/d by 2030, leading to higher global refinery utilization rates. This is due to strong oil demand growth, which is significantly higher than projected refining capacity additions over the period.
Around 70% of long-term refining capacity additions are set to materialize before 2035 Global required refining additions between 2025 and 2050 are projected at 19.5 mb/d. After the medium-term additions, refining capacity is set to increase by a further 7.3 mb/d between 2030 and 2035, which is supported by rising demand in most developing regions. The sum of additions drops significantly thereafter and is estimated at around 3 mb/d in the 2035-2040 period, before falling to only 1.2 mb/d in the 2045-2050 period. This mirrors the slowdown in demand growth towards the end of the modelling horizon. Around 86% of new refining capacity is set to be located in the Asia-Pacific, Africa and the Middle East.
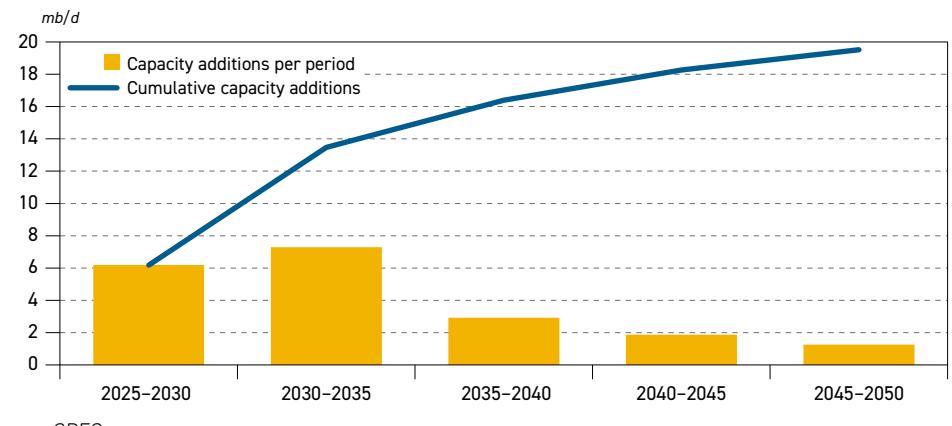
Long-term distillation capacity additions by period and cumulative, 2024–2050
Source: OPEC.
Global oil trade set to rise by nearly 25% by 2050
Global interregional oil trade, including oil, condensate and refined products, is estimated at almost 55 mb/d in 2024. By 2030, trade is projected to increase significantly to above 61 mb/d, with a gradual increase thereafter to 67.5 mb/d in 2050.
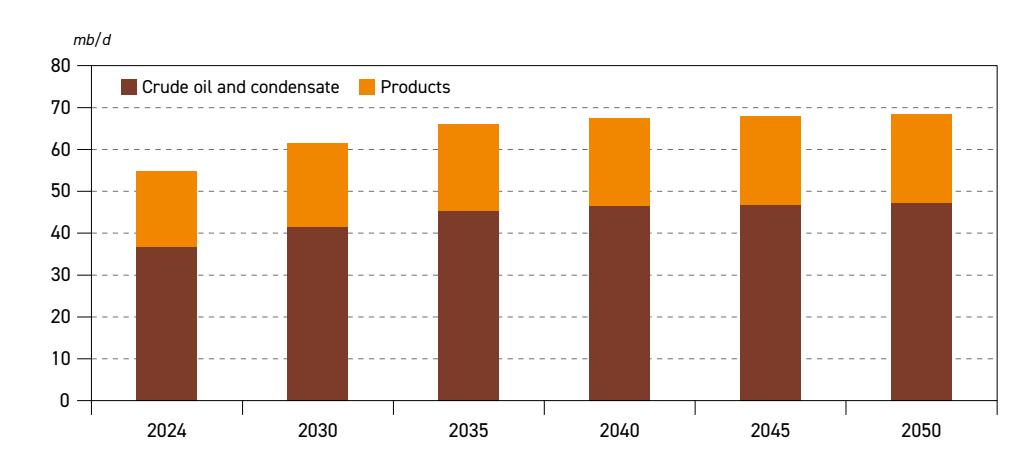
Interregional oil (crude oil, condensate and product) exports, 2024–2050
Source: OPEC.
World Oil Outlook 2025 Organization of the Petroleum Exporting Countries
Interregional crude and condensate trade stood at around 36.8 mb/d in 2024 and by 2030 it is expected to increase to 41.7 mb/d, supported by rising oil demand in major consuming regions. After 2030, the trade growth is expected to slow, although it rises to levels of around 47.3 mb/d by 2050. Total oil product trade is assessed at 18 mb/d in 2024 and it is expected to rise above 21 mb/d by 2050. This is in line with higher demand in the Asia-Pacific and growing exports from the US & Canada and the Middle East.
Middle East to Asia-Pacific trade to grow in importance
Crude and condensate exports from the Middle East are expected to increase from 17.4 mb/d in 2024 to 20.2 mb/d in 2030. In the long term, exports are projected to increase further to 28.2 mb/d by 2050. Middle East crude and condensate exports are likely to increase to all major importing regions. However, more than 80% of Middle Eastern exports are set to be shipped to the Asia-Pacific, increasing from 15.2 mb/d in 2024 to 23.5 mb/d in 2050. The trade route between the Middle East and Asia-Pacific is expected to represent 50% of the global interregional crude and condensate trade in 2050.
Scenarios highlight uncertain road ahead for oil and energy demand
Besides the Reference Case, the Outlook also features two alternative scenarios that shine a light on a range of different, albeit viable outcomes, and their impact on energy demand, the future energy mix and oil demand, specifically. The 'Technology-Driven Scenario' assumes accelerated investments in advanced technologies that affect energy consumption at a more rapid pace than assumed in the Reference Case. These investments result in both significant fuel substitutions and energy efficiency improvements that lead to lower primary energy demand and a significantly different energy mix. Global oil demand in this scenario gradually departs from the Reference Case trajectory. This pathway opens up a demand gap vis-à-vis the Reference Case of close to 5 mb/d in 2035, which then expands to 16.7 mb/d in 2050. In this scenario, total oil demand is under 107 mb/d by 2050.
By contrast, the 'Equitable Growth Scenario' envisages a more equitable and prosperous economic future for developing countries, coupled with a differentiated approach to how and when to achieve emission reduction targets. This scenario results in higher long-term energy
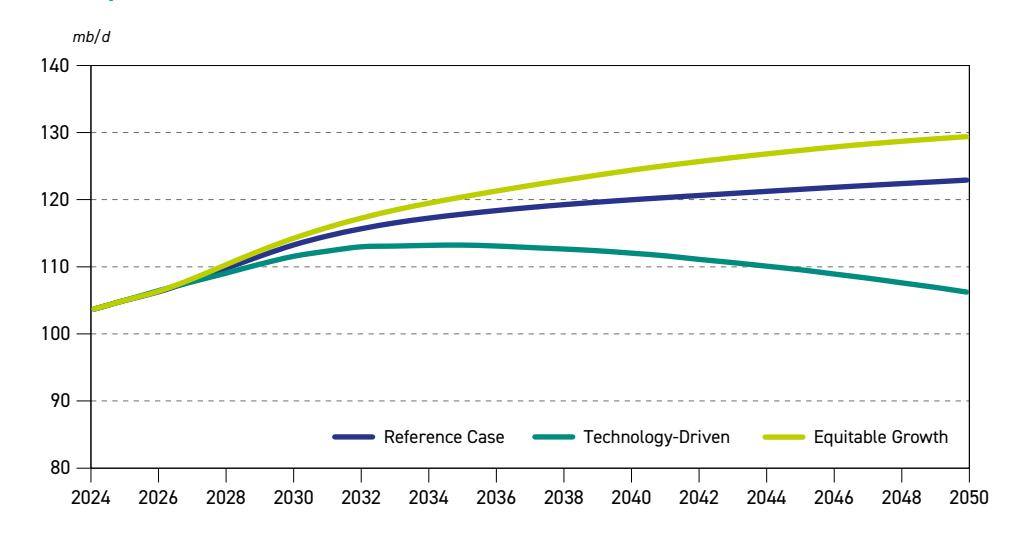
Global liquids demand in the Reference Case and alternative scenarios, 2024–2050
Source: OPEC.

demand, in general, and oil, in particular. Oil demand in this scenario reaches 120 mb/d by 2035 and continues growing to 130 mb/d in 2050. Compared to the Reference Case, this is almost 3 mb/d higher by 2035, which then expands to 6.5 mb/d in 2050.

Introduction
There have been many important developments since the release of the previous Outlook in September last year. A review of 2024 clearly shows that demand for all primary energy sources reached new historical highs. Demand for oil rose to a record 103.7 mb/d. Renewable electricity generation capacity increased by almost 600 GW, driven by the largest-ever solar PV and wind capacity additions in China. Demand for gas, coal and nuclear energy increased too, driven by significant growth in global electricity needs.
China surprised many with its impressive surge in renewables, strong growth in EV sales, and, alongside this, a significant increase in coal demand too. The latter is partly linked to its rapid wind and solar deployment, given their intermittency and the inherent need for continuous balancing. As the recent huge blackout in Spain and Portugal indicates, a rising renewable electricity share brings with it increased needs for grid investments and maintaining backup capacity, including the wider deployment of batteries. All this, however, leads to additional costs for final consumers, even while the risk of blackouts remains.
Moreover, growing energy demand takes place amid substantial shifts in energy policies. Undoubtably the most consequential recent event was the formation of a new US administration, which has focused on domestic economic growth, lowering the US trade deficit in goods and bringing back the 'energy dominance' agenda. At the same time, it withdrew from the Paris Agreement and the Just Energy Transition Partnership, reduced clean energy tax incentives, cut renewable energy funding and provided incentives to reinvigorate domestic oil supply.
Some shifts, though less dramatic, are also visible in Europe. A new EU Commission, reflecting the results of the 2024 European Parliament election is set to give a much higher priority to enforcing defence capabilities and improving Europe's economic competitiveness. While the Commission continues to stress that the 'Green Deal' remains a priority, in practice the heightened focus on defence and economic competitiveness will likely see less emphasis placed on decarbonization efforts. Indeed, in the recent discussion on setting targets for 2040, the EU Commission has called for flexibility and pragmatism in climate change issues rather than strictly adhering to specific targets.
To some extent, the uncertainty about future trends in major consuming countries is also spilling over into other regions. This is especially the case in developing countries where energy security and affordability have always been important and where eradicating energy poverty often tops the priority list. As a result, a tendency to temper climate change ambitions is also visible in a number of developing countries, most obviously reflected in their hesitancy to update policy goals. To date, for instance, under the circumstances highlighted, only a few countries have submitted their updated NDCs to the UNFCCC by early 2025, as required by the Paris Agreement.
Despite these uncertainties, and building upon the analytical foundation of previous WOO editions, this year's Outlook offers fresh insights through 2050 into the evolving dynamics shaping energy demand, oil demand and supply, refining, trade and investment, as well as in-depth scenario analysis and sectoral breakdowns.
As a result, the WOO 2025 offers stakeholders – governments, industry leaders, investors, and researchers – a robust and balanced reference for understanding the future of oil within the broader energy framework. As always, the WOO reflects OPEC's values and emphasis on the need for continued dialogue, cooperation and realistic approaches to future energy

pathways. Ones that not only look to lower emissions, but also ensure energy security and the world's growing need for ample, reliable and affordable supplies of energy.
As the energy world becomes more complex and interdependent, OPEC remains committed to fostering transparency, stability, and sustainability in global oil markets. The WOO 2025 is a central part of this.
INT

Key assumptions
Key takeaways
- • The global population is expected to rise by about 1.5 billion, from a level of around 8.2 billion in 2024 to almost 9.7 billion by 2050. Global demographic changes and population growth will be driven almost entirely by the non-OECD region.
- • The global working-age population is expected to increase by 805 million to surpass 6.1 billion by 2050. Almost 1.9 billion people are expected to move to cities by 2050. By then, an estimated 68% of the world's population, or over 6.6 billion people, are expected to live in urban areas.
- • Global GDP growth between 2024 and 2050 is expected to remain robust, increasing at an average rate of 2.9% p.a. Non-OECD expansion is set to be the primary contributor to global expansion, averaging 3.7% p.a., while the OECD is expected to grow at 1.5% p.a.
- • In absolute terms, the global economy is set to more than double in size, increasing from $171 trillion in 2024 to $358 trillion in 2050.
- • Global average income is expected to rise from approximately $21,000 (2021 PPP) in 2024 to $37,100 (2021 PPP) by 2050.
- • Energy policies across major economies are undergoing a significant recalibration as nations navigate an array of complex challenges. A noticeable trend of policy pushback with intensified scrutiny is evident as decision-makers address a plethora of priorities, including energy security, energy affordability, sustainability and industrial competitiveness.
- • With the Paris Agreement reaching its tenth anniversary in 2025, its full implementation remains increasingly challenging given the uncertain and fragmented global landscape. UN climate negotiations continue to evolve with a backdrop of rising geopolitical tensions, urgent adaptation needs, calls for ambitious mitigation and competing priorities for sustainable development. Concurrently, the announced withdrawal of the US from the Paris Agreement for a second time creates further uncertainty.
- • The WOO assumes a gradual evolution of technology, with no sudden technological breakthroughs, the timing and impact of which are challenging to forecast.
- • The trend towards electrification is expected to continue across several sectors. In the power sector, advancing technology and supportive policies are likely to increase the role of renewables in the energy mix. Electrification in the transport sector will advance, but it is set to continue to face challenges related to battery supply chains and the available charging network, as well as consumer concerns about driving range. The residential sector is also anticipated to experience further electrification through policies incentivizing heat pump adoption and distributed solar photovoltaic (PV) generation.
The Reference Case in this year's WOO is underpinned by a number of key assumptions that play an important role in developing an outlook for the future of all major energy sources. This chapter provides insights into four broad areas of assumptions: population and demographics, economic growth, energy policies and technology and innovation.
1.1 Population and demographics
Global living standards and human longevity have seen remarkable improvements in recent decades, fundamentally reshaping the well-being of populations. This positive trend has been supported by advancements in healthcare and access to water and sanitation services. These improvements are also closely linked to parallel progress in agricultural productivity, which has enabled better dietary health and a reduction in malnutrition-related illnesses. Additionally, transformative technology has connected individuals to vital information and healthcare resources, fostering innovation, improving overall quality of life and collectively enhancing human welfare globally.
However, despite these factors contributing significantly to growth, the rate of global population expansion is noticeably slowing, given the decline in the global total fertility rate, a trend particularly evident within OECD countries. While some developing regions are anticipated to mirror the patterns observed in OECD countries, others may not, presenting a mixed global demographic landscape.
This section provides a detailed examination of these demographic factors, forming the foundation for the population projections within the WOO's Reference Case to 2050. For this purpose, it draws upon the 2024 revision of the United Nations Department of Economic and Social Affairs' (UNDESA) World Population Prospects, which encompasses critical demographic indicators.
Projections indicate that the global population is set to expand from almost 8.2 billion in 2024 to just under 9.7 billion by 2050, an increase of around 1.5 billion (Table 1.1). However, an important demographic trend underscored in recent data is the persistent decline in global fertility rates, a factor that will significantly shape long-term population trajectories across different regions and countries.
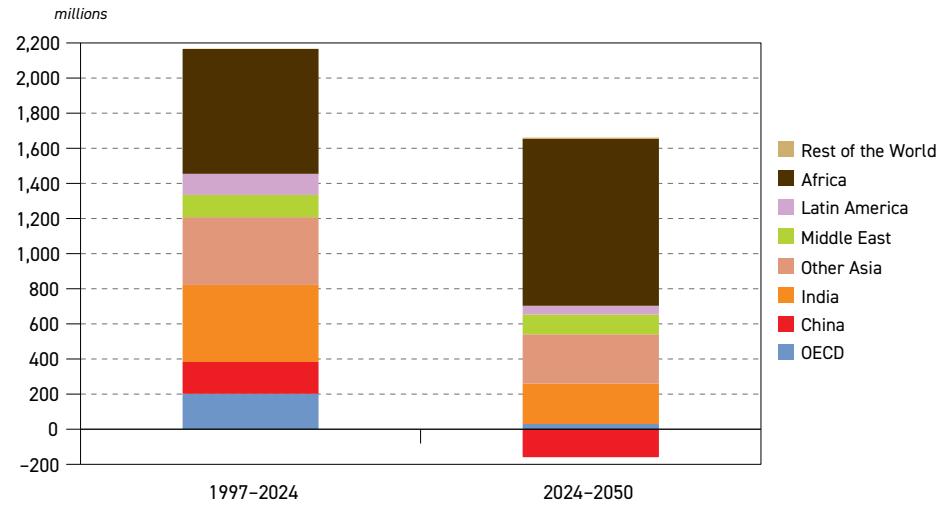
On a regional basis, as per the WOO's regional classifications (see Annex B), the OECD's projected population growth between 2024 and 2050 remains modest, estimated at around 31 million. This limited growth contrasts sharply with a 203 million increase observed in a similar timeframe up to the year 2024 (Figure 1.1). Within the OECD, population growth in OECD Americas is projected to offset the combined declines witnessed in OECD Europe and OECD Asia-Pacific, resulting in a slight gain for the OECD region.
Population growth is set to be overwhelmingly concentrated in non-OECD nations, with growth expected to surpass 1.4 billion through to 2050. Africa is expected to contribute the most to this expansion, with Other Asia and India also set to experience significant increases.
Among non-OECD countries, China is projected to experience a significant population contraction. The substantial decline of around 159 million is primarily attributed to past population policies and continually low fertility rates, which have fallen well below
millions
1
Table 1.1 World population by region
| Growth | |||||||
|---|---|---|---|---|---|---|---|
| 2024 | 2030 | 2035 | 2040 | 2045 | 2050 | 2024–2050 | |
| OECD Americas | 539 | 558 | 571 | 582 | 592 | 599 | 59 |
| OECD Europe | 591 | 590 | 589 | 587 | 583 | 577 | –14 |
| OECD Asia-Pacific | 217 | 215 | 212 | 209 | 205 | 202 | –15 |
| OECD | 1,347 | 1,363 | 1,372 | 1,378 | 1,380 | 1,377 | 31 |
| China | 1,419 | 1,398 | 1,373 | 1,343 | 1,306 | 1,260 | –159 |
| India | 1,451 | 1,525 | 1,579 | 1,623 | 1,656 | 1,680 | 229 |
| Other Asia | 1,292 | 1,367 | 1,428 | 1,484 | 1,533 | 1,575 | 283 |
| Latin America | 510 | 527 | 540 | 549 | 555 | 558 | 49 |
| Middle East | 286 | 315 | 337 | 359 | 379 | 398 | 112 |
| Africa | 1,515 | 1,727 | 1,910 | 2,096 | 2,282 | 2,467 | 952 |
| Russia | 145 | 142 | 140 | 138 | 137 | 136 | –9 |
| Other Eurasia | 149 | 157 | 161 | 165 | 169 | 173 | 23 |
| Other Europe | 48 | 47 | 45 | 44 | 42 | 41 | –8 |
| Non-OECD | 6,815 | 7,206 | 7,513 | 7,799 | 8,060 | 8,287 | 1,472 |
| World | 8,162 | 8,569 | 8,885 | 9,177 | 9,440 | 9,664 | 1,502 |
Source: UN.
Figure 1.1 World population growth, 1997–2024 versus 2024–2050
Source: UN.
replacement levels in recent decades. Compounding this trend are the rising costs of living and societal shifts, which have further depressed birth rates. This contraction represents the largest population drop among major economies and contrasts sharply with China's population growth in the recent past.

In contrast to China's decline, India, already the world's most populous country, is projected to see a population increase of approximately 230 million by 2050. Population growth, while moderating over the outlook period, is sustained by a younger demographic structure and stillabove-replacement fertility rates, particularly in certain regions.
Regionally, as illustrated in Figure 1.2, while China lost its position as the world's most populous nation to India in 2022, Africa's population as a whole has already surpassed that of India and is on a substantial growth trajectory. By 2050, the continent's population is projected to increase by 952 million. Given this significant expansion, it is expected by 2050 that Africa will be home to slightly more than a quarter of the world's population.
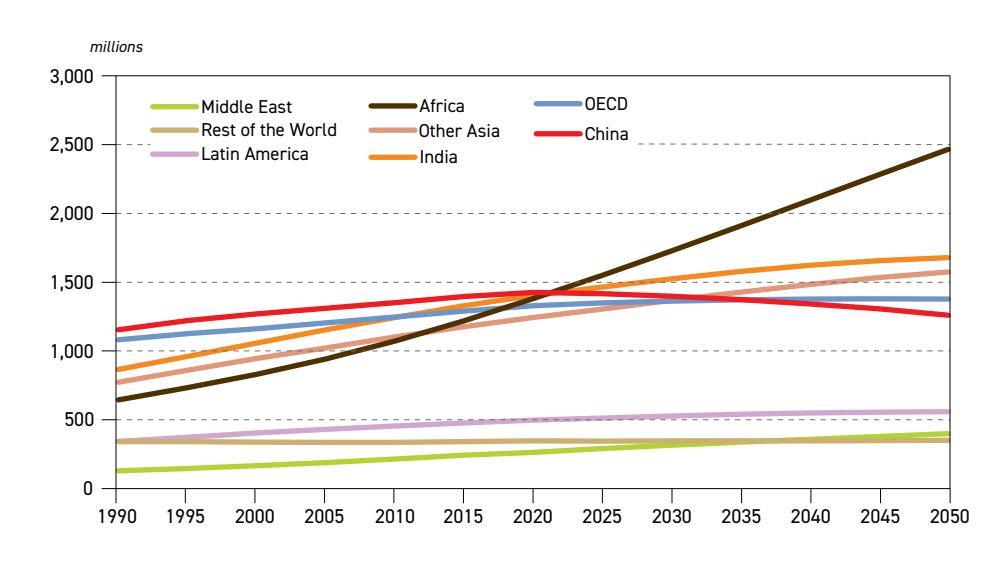
Figure 1.2 World population by region, 1990–2050
1.1.1 Working-age population
The global working-age population (defined as individuals between 15 and 64 years old) is projected to increase by 805 million workers between 2024 and 2050 (Table 1.2). This growth is set to bring the total global working-age population to over 6.1 billion by 2050. However, this workforce expansion occurs amidst an ageing global population. Consequently, as the world's total population continues to expand, the share of the population that is of working age is set to drop slightly from more than 65% in 2024 to 63% in 2050. It should also be noted that regional disparities in working-age population trends are projected to be significant.
OECD countries are projected to experience a drop in their working-age population, with an expected loss of around 55 million workers. This decline is set to lead to a noticeable smaller working-age share in OECD country populations, dropping from 64% overall to around 59%.
Within the OECD, regional disparities are evident. OECD Americas is the only region projected to experience growth in its working-age population, primarily attributed to immigration. In contrast, OECD Europe is projected to see a substantial contraction it its working-age

Source: UN.
| 2024 | 2030 | 2035 | 2040 | 2045 | 2050 | Growth 2024–2050 | |
|---|---|---|---|---|---|---|---|
| OECD Americas | 353 | 361 | 366 | 369 | 372 | 372 | 18 |
| OECD Europe | 380 | 373 | 365 | 355 | 344 | 333 | –47 |
| OECD Asia-Pacific | 135 | 131 | 126 | 119 | 113 | 109 | –27 |
| OECD | 868 | 865 | 857 | 843 | 828 | 813 | –55 |
| China | 984 | 972 | 930 | 859 | 807 | 745 | –239 |
| India | 990 | 1,053 | 1,092 | 1,118 | 1,133 | 1,134 | 144 |
| Other Asia | 845 | 903 | 945 | 979 | 1,007 | 1,027 | 183 |
| Latin America | 345 | 357 | 364 | 366 | 364 | 359 | 14 |
| Middle East | 190 | 213 | 229 | 242 | 255 | 264 | 74 |
| Africa | 867 | 1,018 | 1,150 | 1,286 | 1,423 | 1,559 | 692 |
| Russia | 95 | 93 | 92 | 90 | 86 | 82 | –13 |
| Other Eurasia | 96 | 101 | 104 | 107 | 108 | 108 | 12 |
| Other Europe | 31 | 30 | 28 | 27 | 25 | 24 | –8 |
| Non-OECD | 4,444 | 4,740 | 4,934 | 5,073 | 5,208 | 5,304 | 860 |
| World | 5,312 | 5,605 | 5,791 | 5,916 | 6,036 | 6,117 | 805 |
Table 1.2 Working population by region
Source: UN.
population, likely exceeding a 12% reduction that leads to a noteworthy decline of 47 million. OECD Asia-Pacific faces a similar downward trend with a drop of 27 million, suggesting a working-age population fall that could approach or even exceed 20%. In absolute and proportional terms, this is a considerable loss to the workforce.
Non-OECD countries are projected to be the primary driver of global working-age population growth, experiencing a significant increase of almost 860 million individuals. These nations are expected to maintain a higher proportion of working-age individuals, representing 64% of the overall non-OECD population by 2050.
Among non-OECD regions, Africa is poised to experience the most substantial increase in its working-age population of around 692 million (Figure 1.3). This aligns with the continent's overall population growth and will significantly elevate Africa's share of the global workingage population. Other Asia is also expected to see considerable growth in its working-age population, corresponding to an increase of around 183 million.
India is set to add 144 million to its working-age population, a reflection of its overall population growth. This contributes to a slightly increased proportion of India within the global working-age pool. The Middle East is also anticipated to experience a notable increase in its working-age population of around 74 million. This growth is likely to see the region maintain a relatively stable proportion of the global workforce.
Other Eurasia is estimated to experience a modest increase in its working-age population, corresponding to around 12 million. This is expected to result in a slightly increased proportion in the global workforce. Latin America also sees a modest increase of around 14 million, with a smaller, albeit positive, increase in its working-age population. Consequently, its share of the global working-age population is expected to remain largely unchanged.

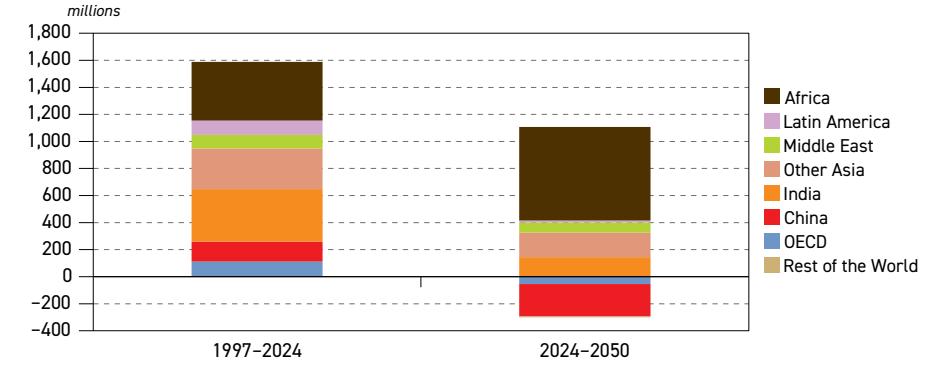
Figure 1.3 Working age population growth, 1997–2024 versus 2024–2050
Source: UN.
Other Europe is expected to witness a drop in its working-age population, with a decline of 8 million. This will lead to a minor reduction in its share of the global workforce. Russia is set to see a decline of around 13 million, which suggests a shrinking working-age population and a slightly reduced percentage of the global total.
Finally, China presents a starkly different trajectory given its anticipated working-age population decline of 239 million. This substantial drop represents a significant reduction, accounting for a notable proportion of the global working-age population.
1.1.2 Urbanization
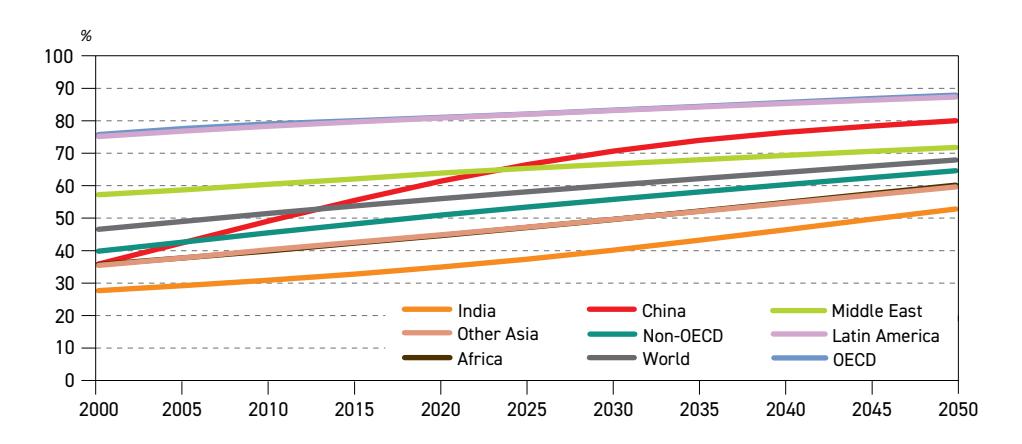
Urbanization, a key driver of improved energy access, plays a vital role in helping to mitigate energy poverty, and is intertwined with economic development and rising energy consumption. In 2024, over 57% of the global population resided in urban areas, a notable increase from 47% in 2000. The global urbanization rate is projected to reach approximately 68% by 2050 (Figure 1.4), indicating a continued trend of global urban expansion across all regions.
Figure 1.4 Urbanization rate by region, 2000–2050
Source: UN.

In 2024, OECD countries and Latin America exhibited the highest levels of urbanization globally, both exceeding 80%, signifying mature urban landscapes. Within the OECD, both the Americas and Asia-Pacific regions demonstrated particularly advanced stages of urbanization. Despite these already advanced levels, projections indicate continued urbanization in OECD countries and Latin America. By 2050, further increases are anticipated for OECD and Latin America, with the OECD Asia-Pacific remaining the most urbanized.
Urbanization levels in the Middle East are higher than the global average but remain well below those seen in the OECD and Latin America. Starting at 65% in 2024, these levels are projected to gradually increase to 72% by 2050.
China's urbanization transformation has been particularly remarkable. At the start of the 21st century, the country had a relatively low urbanization rate of approximately 36%, but in the period thereafter it experienced rapid urbanization on the back of strong economic growth. This surge resulted in an urbanization rate of over 65% by 2024. As China's economy matures, the pace of urbanization is projected to moderate, yet still reach an estimated 80% by 2050.
India presents a contrasting urbanization experience. While China urbanized rapidly, India's urban population shift has been more measured, resulting in an urbanization rate of less than 37% in 2024. For the past three decades, India has consistently recorded the lowest urbanization rate among the regions examined, a trend projected to persist in the longer term. Nonetheless, India's urbanization rate is projected to accelerate to nearly 53% by 2050.
The urbanization trajectory of Other Asia and Africa are almost completely aligned throughout the projection period, starting at around 47% in 2024 and ending at 60% in 2050.
The results of the above urbanization trends are shown in absolute terms in Table 1.3. Between 2024 and 2030, the urban population is projected to increase significantly by 444 million people,
Table 1.3 Urban population by region
| Levels | Growth | ||||||
|---|---|---|---|---|---|---|---|
| 2024 | 2030 | 2035 | 2040 | 2045 | 2050 | 2024–2050 | |
| OECD Americas | 449 | 472 | 490 | 506 | 520 | 532 | 83 |
| OECD Europe | 461 | 471 | 478 | 485 | 490 | 493 | 32 |
| OECD Asia-Pacific | 193 | 192 | 191 | 189 | 188 | 186 | –7 |
| OECD | 1,102 | 1,134 | 1,158 | 1,180 | 1,198 | 1,211 | 108 |
| China | 930 | 987 | 1,015 | 1,026 | 1,023 | 1,009 | 78 |
| India | 535 | 612 | 682 | 752 | 821 | 888 | 353 |
| Other Asia | 604 | 679 | 743 | 809 | 875 | 939 | 335 |
| Latin America | 417 | 439 | 455 | 468 | 479 | 487 | 71 |
| Middle East | 186 | 210 | 229 | 248 | 267 | 286 | 100 |
| Africa | 706 | 857 | 997 | 1,149 | 1,312 | 1,485 | 779 |
| Russia | 109 | 109 | 110 | 111 | 112 | 113 | 4 |
| Other Eurasia | 86 | 92 | 97 | 102 | 108 | 115 | 29 |
| Other Europe | 28 | 28 | 28 | 28 | 28 | 28 | 0 |
| Non-OECD | 3,607 | 4,020 | 4,362 | 4,701 | 5,033 | 5,354 | 1,746 |
| World | 4,710 | 5,154 | 5,521 | 5,881 | 6,231 | 6,565 | 1,855 |
Source: UN.
millions
with the OECD contributing only 32 million to this growth. Over the entire outlook period extending to 2050, the urban population is expected to increase by around 1.9 billion.
1.1.3 Migration
Migration is a key driver of regional demographic change, potentially offsetting population declines in low-fertility OECD countries and strengthening their economies through workingage population growth. As highlighted in Table 1.4, net migration, which quantifies population change due to migration, is defined by the UN as the difference between its medium variant projection and a zero-migration scenario.
While short-term migration patterns are sensitive to contemporary geopolitical events and can cause significant inter-regional population movements, long-term projections suggest a return to established historical trends. These trends are marked by a consistent net migration flow from non-OECD to OECD countries. Despite this long-term pattern, future migration dynamics are expected to remain responsive to evolving geopolitical landscapes and major global developments.
Table 1.4 Net migration by region millions
| 2024–2030 | 2030–2035 | 2035–2040 | 2040–2045 | 2045–2050 | |
|---|---|---|---|---|---|
| OECD Americas | 8.7 | 7.0 | 7.0 | 7.1 | 7.1 |
| OECD Europe | 3.9 | 4.1 | 3.9 | 3.8 | 3.7 |
| OECD Asia-Pacific | 2.1 | 1.6 | 1.6 | 1.6 | 1.6 |
| OECD | 14.8 | 12.8 | 12.5 | 12.5 | 12.5 |
| China | –1.5 | –1.1 | –1.1 | –1.0 | –1.0 |
| India | –2.7 | –1.9 | –1.9 | –1.9 | –1.9 |
| Other Asia | –11.4 | –5.8 | –5.8 | –5.5 | –5.2 |
| Latin America | –2.0 | –1.3 | –1.0 | –0.9 | –0.9 |
| Middle East | 3.6 | 0.0 | –0.3 | –0.3 | –0.3 |
| Africa | –3.5 | –3.5 | –3.3 | –3.8 | –4.3 |
| Russia | 0.8 | 1.5 | 1.5 | 1.6 | 1.7 |
| Other Eurasia | 2.5 | –0.4 | –0.4 | –0.3 | –0.3 |
| Other Europe | –0.5 | –0.3 | –0.3 | –0.3 | –0.3 |
| Non-OECD | –14.8 | –12.8 | –12.5 | –12.5 | –12.5 |
Source: UN.
1.2 Economic growth
Understanding future energy market developments requires a thorough analysis of the global economic outlook, including key trends, challenges, and opportunities. This overview offers valuable insights into the global economy's trajectory in the medium to long term.
Economic growth in the years preceding the pandemic was relatively robust and stable, laying a solid foundation for resilience. This provided a strong base for the challenges the global economy has had to deal with in recent years, specifically the pandemic, as well as rising protectionism, increasing fragmentation and a gradually slowing growth dynamic
in key regions. Recent shifts in US policy appear to have further reinforced some of these trends, with the overall dynamics contributing to structural transformations in the global economic landscape.
Nevertheless, economic growth is expected to remain resilient, with major economies providing sustained support in the medium to long term. In particular, OECD North America – led by the US – along with robust growth in China and India, are projected to be the primary economies in future global economic expansion, benefiting from both significant economic weight and continued strong growth trajectories.
Developing and emerging economies are expected to experience significantly higher growth rates over the outlook period, narrowing the gap not only in per capita income, but also in overall wealth accumulation. This trend will further enhance the impact of these economies within the global economy, with their growing economic presence playing an increasingly important role in shaping future energy demand dynamics.
1.2.1 Current situation and short-term growth
Economic growth in 2024 was well supported, building a sound basis for global economic growth in 2025 and 2026 and beyond. Ongoing steady growth dynamics in the US, China and India support this expectation despite trade-related uncertainties accelerating the trend towards fragmentation. However, the easing of high tariffs between the US and its major trading partners, including China, suggests a move toward normalization that is expected to continue to support growth. Additionally, with Brazil and Russia also expected to see generally healthy growth trends, the momentum in global economic growth observed in 2024 is projected to continue in 2025, 2026 and thereafter. Moreover, while the Eurozone and Japan lagged in 2024, they are projected to experience a rebound in 2025 and in subsequent years.
Economic growth trends will depend on a variety of key elements and these dynamics provide a sound footing for the years to come, although numerous challenges for the global economy remain. For example, it is unclear how the new political and economic framework of the US administration will play out. However, inflation at the global level is expected to continue declining gradually in 2025 and to normalize towards 2026 and beyond. Consequently, monetary policy accommodation is expected to continue in major advanced economies in the near term, albeit at a more cautious pace. The Bank of Japan is likely to continue to gradually tighten its policy, while China is expected to maintain its monetary easing policy, alongside fiscal measures aimed at achieving sufficient growth. The industrial sector is projected to gradually pick up, although the services sector is set to remain the primary driving force for near-term global economic growth, with services sector growth dynamics normalizing in 2025 and continuing into 2026.
1.2.2 Medium-term economic growth
While it is projected that global economic growth remains well supported over the medium term, and with upside potential, several key trends could influence the outlook. One major factor is the ongoing fragmentation of the global economy, which continues to challenge international trade, multilateral cooperation and potentially future economic growth. This fragmentation is possibly further exacerbated by a persistent inflationary dynamic, particularly in advanced economies, such as the US and the Eurozone. As a result, tight financial conditions, coupled

with elevated global debt from pandemic-related fiscal measures, could weigh on economic growth in the years ahead.
Moreover, mounting fiscal pressures, increasing government revenue requirements due to debt obligations and expanding defence budgets, among various factors, could lead to higher taxes and other duties globally. The expected continued shortage of skilled labour, further impacted by stagnant or shrinking working-age populations in major economies, could counterbalance productivity gains. Nevertheless, advancements in artificial intelligence (AI) and robotics have demonstrated the ability to boost productivity growth despite the noted challenges. Emerging and developing economies are projected to outgrow advanced economies in the medium term. However, some of these economies will likely see growth rates level off, or even gradually decelerate, amid maturing domestic economies, particularly in China.
Looking ahead, the following major factors are considered for medium-term growth dynamics, with a subsequent impact extending into the early years of the long-term growth trend.
Inflation is expected to witness a continued gradual decline in the coming years and then normalize towards the end of the medium-term period. While global inflation stood at more than 4% in 2024, the level is expected to retract to stand at around 3.5% in 2025 and then around 3% in 2026. From 2025 onwards, the medium-term inflation path is anticipated to see a further gradual slowdown, reaching around 2.5% by 2030.
Consequently, monetary policies are set to continue with a relatively more accommodative policy stance in key economies, the exception being Japan, which is expected to continue on a monetary tightening policy path. In China, there is some flexibility, given the ongoing low inflationary trend and India's gradual inflation retraction points to continued policy accommodation. Brazil, and especially Russia, are facing more persistent inflationary dynamics, but they are also anticipated to ease their monetary policy stance over the medium term.
In the OECD, interest rates are expected to be lowered further in the coming years to around the expected inflation rates. While Japan has maintained a considerably more accommodative monetary policy stance in recent years, expectations are for an ongoing shift towards a tightening of its key policy rate in the coming years. However, it is projected to remain modest, likely at around 1% until the end of the medium-term period. Interest rates in major emerging markets are expected to stay at relatively higher levels throughout the period, but in these economies, there remains flexibility to lower interest rates given an anticipated drop in inflation.
In connection with inflation and interest rate trends, debt-related challenges in various economies will need to be closely monitored too. While global debt levels seem to be relatively well-digested to date, expanding debt levels across the world may cause challenges in the years ahead. Global debt surged by around $7 trillion in 2024, reaching around $318 trillion, according to the Institute of International Finance. However, similar to last year's WOO, no major dislocation from this debt related situation is assumed in the outlook going forward. It should be noted, nonetheless, that highly indebted economies have already started to witness some fiscal constraints, as viewed in selective Eurozone economies and in some smaller developing and emerging economies.

In times of high debt, governments are often faced with the need to increase revenues, mostly via an increase in taxes on goods and income, but also on assets, capital gains, property, high incomes and corporate profits to manage debt costs. This in turn usually dampens economic activity. In the current medium-term outlook, however, it is assumed that tax hikes are unlikely to significantly slow global economic momentum if well-managed.
Given current geopolitical developments, the outlook remains dynamic. However, growth momentum is expected to remain resilient, with geopolitics playing a limited role beyond the current underlying assumptions. That said, resolving conflicts and strengthening multilateral cooperation could support higher regional and global growth.
It is assumed that the current trend of global fragmentation continues, which may result in a moderate adjustment in the medium term and a possible continued impact in the long term. Global trade, in particular, is projected to continue fragmenting and to become more regionally segmented between the three main trading hubs: the US-centred trade region of the Americas, dominated by North America, the European region, with its dominant forces of Germany, France and the UK, and the Asian region, centred on China, India and Japan.
Productivity is a key economic growth factor, and in advanced economies, it had been declining in the years before the pandemic. While projections still envisage only modest productivity gains, data suggests that productivity has improved more recently, particularly in the US. This trend may have been driven by advancements in AI and may also be the consequence of severe labour shortages that makes utilizing these new technologies an even more pressing issue. The effective adoption of AI, robotics and other new technologies has the potential
| 2024 | 2025 | 2026 | 2027 | 2028 | 2029 | 2030 | Average 2024–2030 | |
|---|---|---|---|---|---|---|---|---|
| OECD Americas | 2.5 | 1.6 | 2.0 | 2.1 | 2.2 | 2.2 | 2.2 | 2.0 |
| OECD Europe | 1.2 | 1.3 | 1.5 | 1.6 | 1.6 | 1.6 | 1.5 | 1.5 |
| OECD Asia-Pacific | 0.8 | 1.3 | 1.5 | 1.4 | 1.3 | 1.3 | 1.2 | 1.3 |
| OECD | 1.7 | 1.4 | 1.7 | 1.8 | 1.8 | 1.8 | 1.8 | 1.7 |
| China | 5.0 | 4.6 | 4.5 | 4.5 | 4.4 | 4.4 | 4.3 | 4.4 |
| India | 6.7 | 6.3 | 6.5 | 6.5 | 6.4 | 6.4 | 6.3 | 6.4 |
| Other Asia | 4.5 | 4.0 | 4.2 | 4.3 | 4.3 | 4.3 | 4.4 | 4.2 |
| Latin America | 2.4 | 2.7 | 2.7 | 2.7 | 2.5 | 2.5 | 2.5 | 2.6 |
| Middle East | 2.5 | 2.9 | 2.9 | 3.0 | 3.1 | 3.1 | 3.1 | 3.0 |
| Africa | 2.4 | 3.2 | 3.4 | 3.4 | 3.4 | 3.4 | 3.4 | 3.4 |
| Russia | 4.3 | 1.9 | 1.5 | 1.5 | 1.5 | 1.4 | 1.4 | 1.5 |
| Other Eurasia | 3.2 | 3.2 | 3.2 | 3.2 | 3.1 | 2.9 | 2.8 | 3.1 |
| Other Europe | 1.9 | 2.2 | 2.2 | 2.1 | 2.1 | 2.1 | 1.9 | 2.1 |
| Non-OECD | 4.4 | 4.1 | 4.1 | 4.2 | 4.1 | 4.1 | 4.1 | 4.1 |
| World | 3.2 | 2.9 | 3.1 | 3.2 | 3.2 | 3.2 | 3.2 | 3.1 |
Table 1.5 Medium-term annual GDP growth rate (in real terms, 2021 PPP)
Source: OPEC.
% p.a.
1
to significantly boost productivity, in both industrial production and services. This trend is expected to continue at a gradual pace, although major uncertainties remain.
By taking these growth assumptions and developments into consideration, the global economic growth forecast stands at 3.2% for most of the medium-term period. This compares to a global growth potential of around 3.4%. Therefore, while the forecast can be considered a robust growth trend, there is further upside to these annual growth assumptions. This upside is dependent on some key factors unleashing an enhanced growth dynamic. Among those are solutions to geopolitical issues, which, in turn, could lead to some relief for global inflationary levels and hence, a further continuation of somewhat more accommodative monetary policies. Moreover, continued productivity gains – most likely supported by advancements in digitalization, including AI – could lead to additional progress in the global growth dynamic.
Economic growth by region
Within OECD economies, OECD Americas is anticipated to be the driving force, with the US the region's major growth engine. OECD Europe is set to rebound to some extent and to accelerate at the beginning of the medium-term forecast period. OECD Asia-Pacific is expected to improve as well in the outlook's initial years, but to remain at a lower growth level when compared to the other two OECD regions, particularly given the low growth dynamic in its largest economy Japan. The OECD overall is expected to see growth of 1.4% in 2025, rising to 1.7% in 2026 and to remain at 1.8% towards the end of the medium-term period.
For OECD Americas , the development in trade between the US, Canada and Mexico will play an important role in the region's economic growth dynamic going forward. Growth in 2025 and 2026 is expected to stand at 1.6% and 2%, respectively. Beyond 2026, growth is expected to rise to 2.2% in the last three years of the medium term. While economic growth is anticipated to remain well supported, upward inflationary pressure from possible tariffs, along with high US debt levels, could strain growth momentum, particularly if interest rates do not ease as currently anticipated in the current economic environment.
OECD Europe 's growth is expected to be impacted by continued industrial sector challenges, in combination with uncertainties surrounding US-trade relations and fiscal constraints in most major economies. Although inflation has retracted and is forecast to gradually slow further over the medium-term period, uncertainties remain. The conflict in Eastern Europe and its outcome, as well as its ripple effect on Europe's energy sector, may continue to be felt, at least at the beginning of the medium term. Positively, monetary policies are expected to remain accommodative over the period, given that inflation is foreseen receding further from 2025 onwards. This dynamic is set to result in growth rebounding from 1.3% in 2025 to average 1.5% over the medium-term period.
In OECD Asia-Pacific , Japan is anticipated to witness a relatively stagnant medium-term growth dynamic. Positively, the region's major trading partner, China, is forecast to maintain a healthy medium-term economic growth level. However, Japan's continued monetary tightening is expected to restrain economic expansion. For OECD Asia-Pacific, growth is set to stand at 1.3% in 2025 and 1.5% in 2026. An average growth level of 1.3% is then foreseen for the total medium-term forecast period.
Medium-term growth in non-OECD countries remains strong, with diverse growth trends. China, India and Other Asia, in particular, are set to constitute the main growth engines. Latin America,
the Middle East, Africa and the eastern European economies all exhibit robust growth trends too, although lower than the three main drivers. The non-OECD is expected to see growth of 4.1% in both 2025 and 2026, a sound economic growth dynamic that is set to be sustained towards the end of the medium-term period.
China' s strong economic growth is set to remain relatively stable over the medium term. While challenges in external trade are expected to remain, domestic demand is set to gradually pick up. Furthermore, the central government is anticipated to counterbalance any deviation from the government's growth targets. The growth rate is expected to decelerate slightly to 4.6% in 2025 and 4.5% in 2026 and retract slightly again to stand at 4.3% in 2030.
India will continue to be the fastest growing major economy, with growth projected to see a stable trajectory from 2025 onwards. The economy is set to benefit from the country's population growth, a rising middle class and continued government support, including major infrastructure project investment over the medium term. An ongoing deceleration in inflation, and the expectation of an accommodative monetary policy, are set to provide further support. India's growth is expected to stand at 6.3% in 2025 and at 6.5% in 2026, before reaching 6.3% in 2030, with an average growth rate of 6.4% over the medium term.
Other Asia is expected to see relatively robust medium-term growth, fuelled by a number of dynamic economies. In 2025 and 2026, growth is expected at 4% and 4.2%, respectively, before a slight further acceleration to reach growth of 4.4% towards the end of the medium term.
In Latin America, the two major economies, Brazil and Argentina, will likely shape growth patterns. Brazil is expected to continue to benefit from fiscal reform and selective governmental support measures, but at the same time it will need to manage its sovereign debt situation. While seeing signs of improvement, Argentina still has to deal with a number of fiscal challenges, at least at the beginning of the medium term, but the introduction of a number of policies by the new administration may further accelerate its recovery. Considering the country's high debt levels, however, Argentina has limited fiscal space in which to manoeuvre. Growth in Latin America is expected at 2.7% in both 2025 and 2026, before slowing to 2.5% at the end of the medium term. The average growth rate over the period is 2.6%.
In the Middle East medium-term growth is expected to rise slightly from 2.9% in both 2025 and 2026 to 3.1% at the end of the medium term. Similarly, Africa is forecast to accelerate from a growth level of 3.2% in 2025 to an average of 3.4% over the medium term. The growth dynamic in both these regions is supported by the expectation of ongoing steady commodity demand, expanding regional trade, population growth, a consequent rise in domestic demand and an expansion of the middle class.
Russia has overcome its recent external challenges much better than expected, and a steady growth trend, alongside potential further structural changes, may continue to positively impact the economy. This comes despite the impact of geopolitical issues on growth, including the associated impact of sanctions. Russia's growth is expected to decelerate from 1.9% in 2025 to 1.4% in 2030. Similarly, Other Eurasia is set to slow from a healthy 3.2% in 2025 to stand at 2.8% in 2030. Economic growth in Other Europe is expected to decelerate too, moving from 2.2% in 2025 to 1.9% in 2030.

33
1.2.3 Long-term economic growth
The global economy is expected to expand at healthy levels over the long term, although the underlying dimensions driving the growth pattern are expected to continually evolve.
The global economic institutional landscape remains dominated by multilateral institutions that provide forums for cooperation and enforce a rules-based system. The latter, however, has increasingly lost its power as economic competition between major economies becomes more established. Rather, trading partners have moved to more direct political and economic engagement. This type of shift is anticipated to be increasingly prevalent in the global economic landscape, where multilateral institutions continue to function as forums for cooperation and dialogue but lack powerful enforcement mechanisms.
Outside of the existing structure, new institutions are emerging in parallel to the existing Western-led landscape. For example, the expansion of BRICS to include growing economies such as the UAE, IR Iran, Indonesia, Ethiopia and Egypt provides a framework for cooperation and coordination beyond the existing structures. The establishment of the New Development Bank institutionalizes the largely informal grouping to further enhance formalized cooperation. Regional trade blocs are also expanding, encompassing larger parts of regional economies. The Regional Cooperation Economic Partnership in Asia and the African Continental Free Trade Area are pushing this cooperation further. Furthermore, direct relationships between blocs are also increasing. This includes the long-negotiated EU-Mercosur partnership that is in its final stages, with further trade deals directly between blocs likely to continue to rise.
The shift will not dismantle global institutions or tip the global economy into a complete fracturing and disarray. Rather, the shift is set to restructure the role of existing institutions for cooperation and dialogue, and in parallel, see new institutional arrangements and direct relationships dominate the global economy. This allows major advanced and emerging economies alike to adopt industrial policies that are more strategically oriented to meet their policy goals, rather than be subject to pure global market forces.
This change, however, is not without cost. In previous eras of global economic development, economies pursued deeper industrial policy, relying on trade barriers to achieve economic goals. While many economies will see some strategic industries in their economy benefit from this new global economic landscape, redundancy in global industrial capacity will likely create inefficiencies in the system, leading to potential overcapacity. As economies seek to diversify from major trading partners and create supply chain redundancies in case of disruption, industrial sectors will be built out that may not be as efficient as they would in an integrated global economy.
Subsequently, with lower returns on investment and lower efficiency, growth rates will likely be slightly dampened, compounding the effects of demographic declines in many major economies. The strategic advantages of such a system, however, will provide safety nets amid increasing supply chain uncertainty. This trend can be seen already emerging in highly strategic sectors, such as semiconductors and AI-driven technology. The US, China and Europe are all moving to develop domestic capabilities to deepen or expand their strategic hold in the industry. As fragmentation continues, further economic segments will see this trend develop and more industries will be labelled strategic and thus be protected.

Another consequence will likely be felt on prices. With lower efficiencies and higher trade barriers, a higher baseline for inflation is expected. Deep-seated globalization had a profound effect on keeping prices lower across the world, benefiting consumption and growth in major economies. While prices are not expected to spike due to this trend, a higher baseline of price levels can be expected to lead to higher interest rates. Keeping inflation within target levels will require tighter monetary policies, although part of that will be offset by slightly lower growth rates. This compounds the problems of high debt levels seen across the global economy in the post-pandemic period, with debt sustainability and debt servicing costs increasingly a concern for a number of economies.
Dollar-based transactions will remain the predominant mode of international trade; however, the rise of alternative currencies and the increased use of digital currencies will likely present some alternatives. However, it is assumed that given the depth and liquidity of the US financial system it will be difficult to significantly replace through 2050. Given that global supply chain issues are expected to continue, with the consequences of redundancies and additional capacities, a global currency will still be necessary. The US will likely still be dominant, yet it is likely to coexist with other means of transaction, especially bilateral ones.
The rapid increase in AI capabilities is expected to positively impact total factor productivity in industries that were previously considered immune from automation or technological penetration. Knowledge-intensive sectors will likely see higher output with fewer labour inputs in a process similar to the automation process of industrial manufacturing. This labour productivity increase will be essential to soften the impact of declining demographics and lower efficiencies in strategic industries. Furthermore, the integration of AI into manufacturing processes will also further advance the trend of developing strategic advantages in specific industrial sectors.
These broad structural trends will naturally unfold differently across the various global regions, based on factors such as existing industrial capacity, education levels, geography, trade partners and financial stability.
While global GDP is expected to sustain a robust pace, expanding at an average of 2.9% p.a. between 2024 and 2050, the distribution is uneven (Table 1.6 and Figure 1.5). Large economies with high leverage in the system are set to maintain a strong standing in the global economy, extracting higher gains from trade realignments and extracting more from productivity improvements. Smaller economies with less leverage will likely see less robust terms of trade and find it more difficult to tap into productivity gains.
However, given the maturing nature of advanced economies, the main gains are envisaged in non-OECD economies that expand at 3.7% p.a. from 2024 to 2050. OECD economies maintain a steady, albeit slower, growth rate of 1.5% p.a.
In absolute terms, the global economy is expected to more than double in size, increasing from $171 trillion in 2024 to $358 trillion in 2050 (in 2021 PPP).
OECD Americas is expected to be the fastest-growing region within the OECD, with an average growth rate of 1.9% p.a. from 2024 to 2050. This expansion is set to be driven by an expanding working-age population, and supported by immigration, technological advancements and innovation. While geoeconomic fragmentation may lead to higher inflation and interest rates

Table 1.6 Long-term annual GDP growth rate (in real terms) % p.a.
| 2024–2030 | 2030–2040 | 2040–2050 | 2024–2050 | |
|---|---|---|---|---|
| OECD Americas | 2.0 | 1.9 | 1.9 | 1.9 |
| OECD Europe | 1.5 | 1.2 | 1.0 | 1.2 |
| OECD Asia-Pacific | 1.3 | 0.9 | 1.0 | 1.1 |
| OECD | 1.7 | 1.5 | 1.4 | 1.5 |
| China | 4.4 | 3.6 | 2.4 | 3.3 |
| India | 6.4 | 5.7 | 5.4 | 5.8 |
| Other Asia | 4.2 | 3.8 | 2.8 | 3.5 |
| Latin America | 2.6 | 2.5 | 1.8 | 2.2 |
| Middle East | 3.0 | 3.3 | 2.1 | 2.8 |
| Africa | 3.4 | 4.2 | 5.5 | 4.5 |
| Russia | 1.5 | 1.4 | 1.1 | 1.3 |
| Other Eurasia | 3.1 | 2.9 | 2.3 | 2.7 |
| Other Europe | 2.1 | 1.3 | 1.1 | 1.4 |
| Non-OECD | 4.1 | 3.8 | 3.3 | 3.7 |
| World | 3.1 | 2.9 | 2.7 | 2.9 |
Source: OPEC.
Figure 1.5 GDP of major economies, 2020–2050

Source: OPEC.
in the short to medium term, this impact will likely be tempered by improving industrial trends and rising labour productivity, particularly aided by AI-driven workforce enhancements.
OECD Europe is expected to expand at an average rate of 1.2% p.a. from 2024 to 2050, following a decelerating trend. Growth is projected to slow further to 1.0% p.a. between 2040 and 2050. With ongoing demographic challenges and a weakening industrial landscape, the services sector will be the primary driver for economic expansion. While inflation and interest rates are expected to remain elevated in the short to medium term, they should gradually decline

to levels seen before the pandemic. The region also faces ever-increasing competition from other parts of the world, particularly in the industrial sector.
OECD Asia-Pacific is expected to follow a similar growth trajectory, with its industrial sector facing continued pressure from China and other manufacturing hubs. While technological advancements and rising productivity will help mitigate the impact of demographic decline, they will not fully reverse the trend. The region is projected to grow at an average rate of 1.1% p.a. from 2024 to 2050 and follow a decelerating trend. Growth is expected to slow further to 1.0% p.a. between 2040 and 2050.
Among non-OECD regions , Latin America is expected to grow at an average rate of 2.2% p.a. from 2024 to 2050, with the agricultural and mining sectors contributing to this growth and the domestic services sector providing additional support. As population growth slows, however, expansion is expected to decelerate to 1.8% p.a. between 2040 and 2050. Brazil will remain the region's economic centre, supported by agricultural exports, a strong energy sector, and structural reforms that enhance economic potential. Although Brazil's growth is expected to moderate after 2040, it will remain on a solid trajectory.
In the Middle East , growth is projected to average 2.8% p.a. from 2024 to 2050. Supported by an expanding population, the region is set to benefit from industrial sector expansion and ongoing diversification efforts. Average growth is expected to peak at 3.3% p.a. between 2030 and 2040, before moderating to 2.1% p.a. from 2040 to 2050 due to the base effect and increasing competition from other regions.
Africa is expected to expand on average by 4.5% p.a. between 2024 and 2050, driven by strong demographic expansion. It is projected to be the only major region to witness continued acceleration, with growth rising from 4.2% p.a. between 2030 and 2040 to 5.5% p.a. between 2040 and 2050. Economic growth outside of the continent is set to play a key role in sustaining the commodity sector expansion and potentially boosting manufacturing and industrial output, which will be supported by a large working-age population. This robust base is set to provide support for broader economic development and job creation, expanding opportunities for the region to emerge as a global production hub. The main challenges for the region will be attracting foreign investment to strengthen the non-commodity sector and stabilizing volatile inflation in major economies.
China is projected to grow at an average rate of 3.3% p.a. between 2024 and 2050, with a growth rate of 3.6% p.a. between 2030 and 2040 and a lesser growth rate of 2.4% p.a. between 2040 and 2050. Economic growth is expected to gradually decelerate as its economic base expands and demographic and structural factors take hold. Despite this slowdown, China is set to remain a major industrial and manufacturing hub and progressively move up the global value chain toward higher-tech products. Its dominance in renewable energy production and EV manufacturing is expected to continue, alongside an expanding role in chip manufacturing and AI-related industries. This relatively rapid move up towards higher-value economic segments offset the drag of an ageing population by boosting productivity and aligning with a more educated, technically skilled workforce. At the same time, lower-tech manufacturing is likely to shift to other economies in Other Asia as China's working-age population declines and trading partners seek diversification.
A key challenge for the Chinese economy will be expanding its domestic consumption base to sustain stable growth. It should be noted that this is constrained by a high household savings

rate, which stands at approximately 35%. Expanding the social safety net and improving social benefits could help reduce savings and strengthen domestic consumption, though structural reforms will be necessary. Despite efforts to boost consumption or raise the retirement age, demographic forces are set to remain a major factor in the economy's deceleration. Nonetheless, China will continue to be a major exporter, with a more diversified set of trade partners, particularly in growing regions such as Africa and the Middle East.
India is expected to be the world's fastest-growing major economy through the outlook period, with an average annual growth rate of 5.8% p.a. from 2024 to 2050. Strong medium-term expansion will further establish India as a key manufacturing hub, supported by government measures in critical sectors such as telecommunications and pharmaceuticals. With a growing population, its domestic economy and a robust services sector are set to continue to drive growth. The rapidly expanding middle class reinforces this outlook, given the benefits from an improving education system and government initiatives aimed at strengthening the labour market. Additionally, large multinational corporations are investing in research and development, attracting foreign capital and expanding India's role in the global supply chain.
As global firms seek to diversify production and manufacturing beyond existing hubs, India will be a natural destination for relocation and expansion, further supporting its growth trajectory. However, addressing unemployment remains a key policy focus in the medium term. As the economy grows, some deceleration is expected due to the base effect of a larger economic size, with growth slowing from 5.7% p.a. between 2030 and 2040 to 5.4% p.a. between 2040 and 2050.
In Other Asia , growth is expected to remain relatively strong at 3.5% p.a. between 2024 and 2050, outpacing the global average. The region's economic base is closely linked to China, and its slowdown will likely have spillover effects on regional economies. At the same time, larger dynamic economies such as Vietnam, the Philippines and Indonesia are anticipated to absorb more manufacturing and industrial production that shifts from China. Growth in the region is expected to decelerate from 3.8% p.a. between 2030 and 2040 to 2.8% p.a. between 2040 and 2050.
Russia is expected to witness relatively steady economic growth in the long term, though demographic declines are likely to weigh on prospects. While the medium term is set to be marked by persistent inflationary pressures and high interest rates, which may delay investment cycles, the broader challenge will be improving labour productivity amid a shrinking population and implementing structural reforms to further reindustrialize the economy. Russia's economy is projected to grow at an average of 1.3% p.a. from 2024 to 2050.
Other Eurasia is expected to expand at an average rate of 2.7% p.a. from 2024 to 2050, following a slightly decelerating trend. Growth is set to be supported by a gradual expanding population and sustained global demand for commodities. Increased labour productivity is expected to provide additional support for long-term economic stability.
Other Europe is anticipated to follow a growth trajectory similar to OECD Europe due to continued economic ties and a slightly declining population. The region is projected to expand at an average rate of 1.4% p.a. from 2024 to 2050.
With higher growth rates in non-OECD economies, the region's share of the global economy is expected to rise from 56% in 2024 to 69% in 2050 (Figure 1.6). India is projected to more than

double its share, increasing from 8% in 2024 to 17% in 2050, corresponding to an absolute increase of $46 trillion. China's share is expected to grow from 19% to 21%, adding $44 trillion to the global economy.

Figure 1.6 Distribution of the global GDP, 2024 and 2050 %
Source: OPEC.
In terms of GDP per capita (Figure 1.7), continued growth in advanced economies and declining populations are widening the gap with emerging economies, with the exception of India and China. India's strong economic expansion will bring its GDP per capita to just below the global average in 2050 after more than tripling from 2024 levels. China is also expected to see a
Figure 1.7 Real GDP per capita in 2024 and 2050
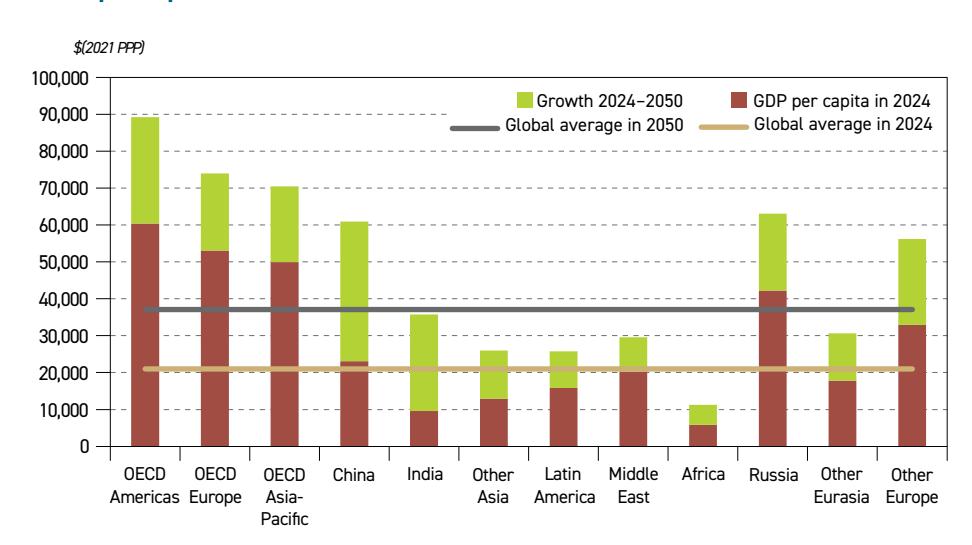
Source: OPEC.
World Oil Outlook 2025 Organization of the Petroleum Exporting Countries
substantial increase, bringing it almost in line with OECD Asia-Pacific. The global average GDP per capita is projected to rise from $21,000 in 2024 to $37,100 in 2050 (2021 PPP).
Outside of India and China, GDP per capita in Africa is expected to double between 2024 and 2050, reaching $11,300 by the end of the outlook period. In the Middle East, GDP per capita is projected to grow by $9,400, reaching $29,600, with demographic expansion contributing to incremental growth. Russia's GDP per capita is expected to rise from $42,200 in 2024 to $63,000 by 2050.
In OECD economies, continued economic expansion combined with a declining population in OECD Europe and OECD Asia-Pacific will likely amplify GDP per capita growth. In OECD Americas, economic growth is expected to outpace the region's slightly expanding population, driving continued expansion in GDP per capita, which is projected to remain the highest globally, reaching $89,200 by 2050.
1.3 Energy policies
Energy policies are crucial drivers shaping both the medium- and long-term energy landscape. An assessment of both enacted and proposed policies is essential to enable informed and realistic assumptions regarding future global energy pathways. The WOO Reference Case conducts a comprehensive examination of enacted policies, incorporating a viability assessment that considers policy progress, cost-effectiveness and implementation timelines. This approach enhances the projections, moving beyond aspirational goals to include practical implementation constraints and likely policy evolution.
Progress and challenges in climate action and negotiations
With the Paris Agreement reaching its tenth anniversary in 2025, its full implementation remains increasingly challenging within an uncertain and fragmented global landscape. UN climate negotiations continue to evolve with a backdrop of rising geopolitical tensions, urgent adaptation needs, calls for ambitious mitigation and competing priorities for sustainable development. This year's Outlook draws on key outcomes from COP29, considering that recent UN Climate Change Conferences may have marked breakthroughs in climate diplomacy. However, the run-up to COP30 – scheduled for November 2025, in Belém, Brazil – has grown more complex, posing significant challenges for multilateralism.
Following the adoption of the 'UAE Consensus' at COP28 in late 2023 in Dubai, which comprises a set of decisions, including on the first global stocktake (GST) outcomes under the Paris Agreement, Parties convened at COP29 in November 2024 in Baku, with the aim of reaching a consensus on key negotiation issues related to enhanced climate action and support. The summit opened just days after the US presidential election and with mounting speculation about a possible second withdrawal from the Paris Agreement by the world's largest historical and current per-capita emitting country, raising concerns about future global emissions reduction efforts and climate finance.
Considering the needs and priorities of developing countries, Parties engaged in extensive negotiations on a new collective quantified goal (NCQG) on climate finance, which would supersede the current $100 billion annual goal for the post-2025 period. Critical negotiations
also focused on the GST refinement and the scope of the UAE dialogue under the first GST outcomes, the global goal on adaptation, the work programme on just transition pathways, the mitigation work programme, further guidance on features of Nationally Determined Contributions (NDCs), Article 6 on cooperative approaches, and matters relating to response measures.
The 'Baku Climate Unity Pact' was eventually adopted, with Parties agreeing on the 'Baku Finance Goal', and key decisions on the global goal on adaptation and the mitigation work programme. Decisions taken on Article 6 will also allow for the operationalization of the 'Paris Agreement Crediting Mechanism', featuring an accounting system to avoid double counting and upholding environmental integrity standards, among others. A four-year workplan on response measures (2026–2030) was agreed too, addressing the cross-border impacts of measures taken to tackle climate change. Moreover, a procedural decision was made on the work programme on just transition pathways, with discussions set to continue at the negotiation sessions in Bonn in June 2025 (SB62), together with those on the GST process and NDC features.
On climate finance, developed countries pledged to provide at least $300 billion annually to developing countries by 2035, through various sources, including public and private finance. A mobilization goal of $1.3 trillion annually was also set for the same period. The decision emphasizes that the estimated cost of meeting developing countries' NDCs ranges between $455–584 billion annually, and adaptation finance needs are $215–387 billion annually until 2030.
In terms of implementing this decision, Parties will take stock as part of the GST process and will initiate deliberations on a way forward prior to 2035 – including through a decision review in 2030. Moreover, the 'Baku to Belém Roadmap to 1.3T' was launched to scale up climate finance for developing countries and to help support low-emissions and climateresilient development by providing, inter alia , grants and concessional financing. The COP29 and COP30 presidencies will produce a report summarizing the outcomes of this work for consideration in Belém.
Consequently, matters relating to climate finance and the new goal are expected to be further debated in upcoming negotiation sessions. With growing concerns over outstanding finance gaps, developing countries are already calling for developed countries to fulfil their obligation of taking the lead in climate action and providing support to developing countries, in line with the principles of the Convention and the Paris Agreement. The importance of meaningful finance as a key enabler for implementing developing countries' climate action plans is stressed, responding to their needs and addressing challenges for overcoming financial constraints.
In addition, the urgency to accelerate science-driven climate action is highlighted in COP decisions and technical reports developed by the United Nations Framework Convention on Climate Change (UNFCCC) Secretariat. For instance, key findings of the latest Intergovernmental Panel on Climate Change (IPCC) assessment report (AR6) are reflected in the first GST outcomes. It is indicated that limiting global warming to 1.5°C requires global greenhouse gas emission (GHG) reductions of 43% by 2030 and 60% by 2035 compared to 2019 levels, and reaching net zero CO2 emissions by 2050. The implementation of current NDCs would require significantly greater emission reductions to achieve the Paris Agreement's goals and eliminate this emissions gap, which is exacerbated by an implementation gap.

On the pre-2020 period, UNFCCC reports show that developed countries were expected to reduce their emissions by 25–40% below 1990 levels by 2020. Yet this target was not achieved, leading to both mitigation ambition and implementation gaps, with historical cumulative net CO2 emissions accounting for about 80% of the total remaining carbon budget. Additionally, none of the Annex I Parties are expected to achieve the 2030 targets included in their NDCs. Their emissions are expected to increase over the period 2020–2030. Moreover, developed countries fell short of achieving their commitment to collectively mobilize $100 billion per year by 2020 to help developing countries implement their NDCs.
In light of the above, COP30 is expected to be an 'Ambition COP', providing an opportunity for Parties to take stock of their collective climate ambition and assess progress toward the Paris Agreement goals. The deadline for submitting the third round of NDCs was 10 February 2025, with each NDC called to include emissions reduction targets by 2035, representing a progression compared to previous contributions and reflecting the highest possible ambition.
At present, only 23 Parties have communicated their latest NDC. These countries account for about 20% of global GHG emissions. It should be noted that the US represents more than 11% of global emissions, but its submission was made before the announcement of its second withdrawal from the Paris Agreement.
On inauguration day, the newly elected US President signed an executive order to withdraw from the Paris Agreement and seize immediately any financial commitments under the UNFCCC. Based on the date of the formal notification, the withdrawal will take effect on 27 January 2026. This second exit of the US from the agreement raises concerns about setbacks in global climate progress.
Overall, the US administration's decision to withdraw again from the agreement signals a significant shift in US climate policy, with potential consequences for global climate action and diplomacy. It could undermine the Paris Agreement's implementation, weaken the US's emissions reduction target, delay global action by easing other Parties' efforts, jeopardize climate funding, including in providing financial support for developing countries, and disrupt international cooperation. Depending on how the political landscape evolves, another layer of complexity may arise in UN climate negotiations and processes.
Evolving paradigms in the global energy landscape: navigating pushback and shifting priorities
Energy policies across major economies are undergoing significant recalibration as nations navigate an array of complex challenges. While energy policy ambitions appear robust, they are encountering thorough revisions. A noticeable trend of policy pushback and intensified scrutiny is evident as decision-makers address a plethora of issues, including energy security, energy affordability, sustainability and industrial competitiveness.
This convergence of factors is prompting a realignment of policy objectives, potentially leading to modifications that, while relatively small at the individual level, exert substantial cumulative effects on energy demand trajectories at the national, regional and global levels. This is also true for energy transitions. Instead of a singular transition, a more accurate depiction is the emergence of divergent energy pathways. Individual nations, regions, and continents are pursuing distinct energy trajectories, each shaped by unique structural energy systems.
The US: strategic reorientation, resource development and energy security
The US looks to be undergoing a fundamental shift in energy policy orientation, establishing domestic resource development as a national priority. The 'National Energy Emergency' declaration of January 2025 establishes energy security as a national priority, granting federal agencies expanded authorities to expedite energy infrastructure projects across the country.
Complementing this approach, the 'Unleashing American Energy' executive order sets an ambitious target of increasing US production by 3 million barrels of oil equivalent per day (mboe/d) during the administration's four-year term. This goal is supported by authorizing development on federal lands, both onshore and offshore. This includes the US West and East Coasts, the eastern Gulf of Mexico and the Arctic National Wildlife Refuge, such as the Willow development in Alaska that has received approval. The refocus reflects the prioritization of domestic resource development as a cornerstone of US energy strategy. The administration has also rescinded the previous pause on liquified natural gas (LNG) export capacity expansion, addressing industry concerns about endangered investments and reinforcing the commitment to energy exports.
The executive order has also introduced substantial uncertainty for renewable development, particularly for projects supported by the Inflation Reduction Act (IRA) and the Infrastructure Investment and Jobs Act (IIJA). The order mandates an immediate pause on the disbursement of federal funds for programmes and projects under the IRA and IIJA associated with clean energy and climate-related initiatives.
This funding freeze affects a wide range of federal grants, loans, and awards, including Department of Energy (DoE) loan guarantees for wind and solar projects. It has resulted in the suspension of permitting and construction activities for major offshore wind developments, such as Atlantic Shores Offshore. It also proposes a 45% cut to the DoE Office of Energy Efficiency and Renewable Energy (EERE) budget. The Office of Management and Budget has reinforced the freeze, temporarily halting disbursements for implicated programmes and requiring agencies to review and report on their funding practices.
In contrast, the administration is likely to be supportive to nuclear energy. An executive order in May aims to boost deployment of nuclear power, as well as advanced nuclear technologies, while also reforming the Nuclear Regulatory Commission in an effort to speed up the approval of licenses.
In the road transportation sector, the administration has significantly modified previous vehicle emission standards that would have accelerated EV adoption for new light-duty vehicles by 2032. This policy recalibration acknowledges persistent EV adoption challenges, including infrastructure gaps and consumer affordability concerns. The refocus is prioritizing consumer choice and market-driven technology adoption and recognizing the continued dominance of ICEs in the US fleet.
On the industrial policy front, the administration has paused disbursement of funds from the IRA, signalling a shift away from subsidizing industrial decarbonization toward policies supporting conventional energy infrastructure.
The EU: balancing energy security with climate objectives
The EU continues to pursue ambitious climate targets while pragmatically adjusting its energy policies to address pressing concerns about energy security and industrial competitiveness.

The EU's 'Clean Industrial Deal' and the associated 'Affordable Energy Action Plan' reflect this dual focus, acknowledging the need to secure reliable energy supplies for European industries. This policy includes provisions for investments in overseas hydrocarbons infrastructure and a shift toward long-term contracts to mitigate high energy prices that have been eroding industrial competitiveness.
The implementation of this policy, however, faces significant constraints. Balancing climate objectives with industrial competitiveness remains a challenge, particularly amid persistently high energy costs. Furthermore, geopolitical energy issues complicate efforts to secure affordable supplies while adhering to decarbonization timelines, necessitating a careful calibration of domestic and international energy strategies.
The EU's Revised Renewable Energy Directive (RED III/III.5), which entered into force in November 2023, represents a critical step in accelerating the region's transition to a decarbonized energy system. The directive raises the binding EU-wide target from 32% (under RED II) to at least 42.5% renewable energy in gross final consumption by 2030, with an aspirational goal of 45%. It also includes sector-specific mandates for transport, industry, and heating/cooling.
Key measures include streamlined permitting processes for projects in designated Renewables Acceleration Areas, with approval timelines capped at 12–18 months, and binding targets for renewable fuels of non-biological origin in hard-to-decarbonize industries. The revised framework also introduces an indicative 5% target for innovative renewable technologies, such as floating offshore wind and advanced geothermal, in new installations by 2030 and reinforces sustainability criteria for biofuels to mitigate indirect land-use change risks.
Since entering into force in April 2023, the EU's de facto ban on ICE cars from 2035 remains in place despite pushback from member states and vehicle manufacturers continuing into 2024. Any rollback or delay in implementation could have a noticeable impact on the make-up of the EU's passenger vehicle fleet.
For maritime transport, the 'FuelEU Maritime Regulation' mandates a gradual reduction in the GHG intensity of energy used on ships, beginning with a modest 2% reduction in 2025 and increasing to 80% by 2050. Notably, the regulation maintains flexibility for conventional fuels during the implementation period to help avoid disruptive mandates that could undermine maritime operations and ensure a manageable transition for shipping companies. Despite this pragmatic approach, implementation is hindered by rising operational costs for shipping companies and regulatory asymmetry, which risks carbon leakage to less regulated regions. Additionally, the lack of scalable, affordable alternative fuels and infrastructure is further slowing progress toward decarbonization targets.
The aviation sector faces similar challenges under the 'ReFuelEU Aviation' rules, which establish ambitious SAF targets that aim for 70% SAF blending at EU airports by 2050. While these targets underscore the EU's commitment to decarbonizing aviation, they have encountered growing scepticism regarding their practical feasibility. Industry reports highlight significant scalability challenges and persistent cost differentials that necessitate government subsidies for SAF viability. Moreover, uncertainty surrounding the scheduled 2027 review has created investment hesitancy among stakeholders, potentially delaying SAF adoption timelines and undermining the policy's effectiveness.
In the buildings and residential sector, the 'Energy Performance of Buildings Directive' aims to reduce energy consumption through green home initiatives and retrofitting programmes. However, its implementation has been challenging due to inflationary pressures and high living costs across EU member states. Many countries are slowing their efforts to roll out these initiatives, reflecting a more measured approach that acknowledges economic realities and consumer concerns. High upfront costs associated with retrofitting projects – particularly in rent-controlled housing – further complicate implementation. Consumer hesitancy to adopt energy-efficient technologies without sufficient incentives also moderates the pace of progress in this sector.
UK: pragmatic North Sea development with fiscal certainty
The UK has adopted a balanced approach to energy policy that prioritizes domestic production while providing long-term investment clarity for the oil and gas sector. The 'Building the North Sea's Energy Future' consultation explicitly recognizes that existing oil and gas fields have been critical to the UK's energy system and will continue to play an important role for decades to come. The government has confirmed that the Energy Profits Levy will end in 2030; however, until that time, the levy makes the development of fields less economical.
Renewable energy is at the forefront of the current government's agenda in its first year in office with the launch of Great British Energy, a publicly owned company dedicated to scaling up renewables. Key initiatives have included lifting the ban on onshore wind, approving large-scale solar projects such as Sunnica and Mallard Pass, committing to double onshore wind capacity by 2030 and a tripling of solar capacity by 2035.
The Clean Power 2030 Action Plan outlines a roadmap for a cost-effective, renewablesdominated electricity system, supported by planning and grid connection reforms. The Contract for Difference (CfD) scheme continues to drive new renewable investments, with significant capacity awarded in Allocation Round 6, while the Review of Electricity Market Arrangements is expected to further modernize market design.
In the transportation sector, the UK has postponed its ban on new gasoline and diesel vehicle sales by five years to 2035, acknowledging the practical challenges of rapid electrification. For residential heating, the government has decided to scrap the plan to ban the sale of gas boilers by 2035. Under the Future Homes Standard, there will be no mandate requiring homeowners to replace their existing gas boilers with heat pumps, ensuring that people will not have to remove gas boilers from their homes.
The UK government has also taken further steps to diversify its energy mix, including the reversal of the onshore wind ban to expand renewable capacity. However, this is balanced with continued support for North Sea development, reflecting a pragmatic approach that maintains energy security while gradually developing alternative sources.
Japan's energy dilemma: achieving stability amidst change
Japan has adopted a pragmatic approach to energy planning that maintains conventional energy as an essential component of its future energy mix, reflecting lessons learned from past energy insecurity. Japan's 7th Strategic Energy Plan, approved in February 2025, aims to balance energy security, economic efficiency, environmental sustainability and safety ('S+3E'). The plan aligns with Japan's 'Green Transformation 2040' (GX2040) vision that

targets a 73% reduction in GHG emissions by 2040 compared to 2013 levels. However, the emission reduction target risks being undermined by Japan's ageing infrastructure and geographical limitations for renewable deployments.
The plan sets ambitious targets for renewable energy, aiming for a 40–50% share by 2040. This includes increasing solar capacity to 100 gigawatts (GW), wind power to 30 GW and hydro and geothermal energy to around 20 GW combined. Significant land constraints on Japan's mountainous islands create substantial hurdles for utility-scale solar and wind projects required to reach the 2040 renewable target. Additionally, grid integration challenges and transmission bottlenecks between regions could significantly impede the rapid deployment of variable renewable sources, particularly given the fragmented nature of Japan's electricity system.
In nuclear energy, the plan aims to maximize its use, targeting a 20% share of the electricity mix by 2040. This is up from the current 8.5%. This involves restarting existing reactors and extending their lifespans beyond 60 years, while maintaining safety as a fundamental premise. Public opposition to nuclear power remains strong following the Fukushima disaster, creating significant political and social barriers to reactor restarts and lifetime extensions. Securing regulatory approval for extending reactor lifespans beyond 60 years faces significant technical and safety scrutiny, potentially delaying or preventing the planned 20% nuclear contribution to the energy mix.
In the road transportation sector, regulations set fuel efficiency targets using the most efficient vehicles currently on the market as a benchmark through the Top Runner Programme. At present, the current target is to achieve fuel efficiency of 25.4 kilometres per litre (km/l) by 2030. Furthermore, subsidies continue to be used in Japan to promote the purchase of EVs.
Energy security remains a cornerstone of the plan, with the aim to reduce hydrocarbon fuel dependency to around 30% by 2040 and with LNG as a transition fuel. The high cost of replacing existing hydrocarbon fuel infrastructure with low-carbon alternatives risks creating stranded assets and economic dislocation in regions dependent on conventional energy industries. Additionally, the steel sector, responsible for 14% of emissions, is targeted for decarbonization through electrification and efficiency improvements with the aim of reducing energy consumption by 20% by 2040. The significant capital requirements for retrofitting existing industrial facilities with low-carbon technologies may exceed investment capacity, particularly for smaller manufacturers in the supply chain.
China: strategic energy expansion for economic prosperity
China's energy policy prioritizes economic growth and energy security through a comprehensive approach that includes both conventional and renewable energy sources, with a particular focus on ensuring reliable supplies for its expanding economy. The '2025 Domestic Consumption Focus Policy' establishes a GDP growth target of approximately 5%, supported by substantial stimulus measures, including a decade-high fiscal deficit of 4% against GDP.
To secure reliable oil supplies, China has issued crude oil import quotas for independent refiners that reach 3.17 mb/d for 2025, with a broad cap of 5.16 mb/d for non-state importers. This represents an increase from the almost 4.88 mb/d allowed in 2024, reflecting China's commitment to securing reliable oil supplies to meet growing demand.

China's 14th Five-Year Plan (FYP) for Renewable Energy Development, unveiled in October 2024, sets ambitious goals to significantly boost renewable energy consumption. The plan targets an increase in annual renewable energy consumption to 1 billion tonnes of standard coal equivalent by 2025 and 5 billion tonnes by 2030, aligning with China's broader strategy to achieve carbon neutrality by 2060 and peak carbon emissions by 2030. It emphasizes the expansion of wind, solar, and biomass energy while promoting grid modernization, industrial electrification, and green hydrogen production.
While China leads globally in renewable energy capacity additions, it continues to approve new coal power plants to ensure reliable electricity supply. For residential consumers, China has implemented new incentives, including subsidies for solar panels and electric heaters for urban residents. However, many rural communities still rely predominantly on coal-generated electricity due to infrastructure limitations, which underscores the practical challenges of energy system evolution in developing economies.
China's government also continues to support EV sales in what is now the world's largest EV market, specifically with credits to manufacturers. In addition, Phase V fuel consumption standards will push average fleet fuel efficiency targets to 3.2 l/100km by 2030 for all passenger vehicles.
India: accelerated hydrocarbon development for energy security
India continues to prioritize energy security through policies that promote domestic production, while gradually reforming subsidy frameworks to reflect economic realities.
The 'Oilfield Regulatory and Development Amendment' of March 2025 aims to reform the legal framework to meet current market conditions and make the oil sector more attractive to investors. In terms of expanding exploration opportunities, the tenth round of the 'Open Acreage Licensing Policy' offered 25 blocks covering nearly 192,000 km2 across 13 sedimentary basins. This ambitious licensing round, which includes 19 offshore blocks with 13 in deep water and ultra-deep water, highlights India's commitment to accelerating domestic hydrocarbon resource development and reducing its import dependency.
As for renewable energy, India's commitment to achieving 500 GW of non-fossil fuel capacity by 2030 is being aided by policy support and targeted incentives. For instance, the Production-Linked Incentive Scheme for High-Efficiency Solar PV Modules. With a total outlay of nearly $3 billion, the scheme is designed to accelerate domestic manufacturing of advanced solar modules, awarding close to 50 GW of manufacturing capacity across two tranches and linking incentives to local content and technological innovation. The scheme is anticipated to play a pivotal role in scaling up solar deployment, supporting grid integration and attracting further investment.
In the road transport sector, India introduced the 'National Electric Mobility Mission Plan 2025' in January 2025. The policy aims to promote EVs and reduce carbon emissions from road transport. The target is to achieve 30% EV penetration by 2030, supported by subsidies for EV purchases, investments in charging infrastructure and incentives for manufacturers to produce EVs domestically.
In the maritime sector, the 'Maritime India Vision 2030' announced in February 2021, outlines a comprehensive strategy to enhance the sustainability and efficiency of India's maritime

industry. The vision includes over 150 initiatives to improve operational efficiencies, promote port-driven industrialization and create safe and sustainable world-class ports. One of the key targets is to reduce carbon emissions from maritime activities by 40% by 2030 through the adoption of green technologies and alternative fuels.
EV adoption stalls as ICE vehicles remain dominant
The road transportation sector continues to be dominated by ICE vehicles despite policy efforts to accelerate electrification. Policies designed to accelerate EV uptake, such as the mandated phase-out timelines for ICEs and increasingly stringent vehicle emissions standards, are encountering growing opposition, with the broader economic and societal implications considered, and instances of policy revision as established target dates approach.
As already noted, the UK has postponed its ban on new gasoline and diesel vehicle sales by five years to 2035 and the EU's de facto ban on ICE cars from 2035 faces continued pushback, while the EU's Euro 7 emissions regulations have been revised with reduced stringency for passenger vehicles. Other such policies in Canada, China, Chile and California, as well as elsewhere, could also face challenges if EV sales are below expectations.
Vehicle manufacturers are responding to these market signals by recalibrating their strategies, with several major automotive manufacturers deferring previously stated ambitions for exclusive EV product portfolios and reallocating investment capital. This strategic readjustment suggests that ICE vehicles will remain essential for most manufacturers' product lineups for decades to come.
Aviation's decarbonization goals remain elusive
The aviation sector faces significant challenges in meeting ambitious decarbonization targets, with practical and economic hurdles tempering expectations for rapid progress. The 'Carbon Offsetting and Reduction Scheme for International Aviation' (CORSIA), administered by the International Civil Aviation Organization (ICAO), provides a framework for emissions reduction, but its limitations are widely recognized within the industry.
The EU's 'ReFuelEU Aviation' regulation aims for a 70% blend of sustainable aviation fuel (SAF) at EU airports by 2050. However, the feasibility of these targets is increasingly being questioned due to high costs and scalability challenges. As a result, there are growing calls for more realistic deployment timelines and increased government subsidies to support the transition. This shift in perspective highlights the need for practical solutions to achieve the ambitious goals set by the regulation.
The economic implications of SAF mandates are becoming more apparent, as evidenced by the implementation of SAF surcharges to address increased costs for airlines and shippers. In the US, uncertainty surrounding federal tax credits is creating headwinds for SAF market development, while federal aircraft CO2 standards have been criticized as weak and ineffective, with pushback from states seeking more ambitious action.
Globally, the upcoming 2025 periodic review of ICAO's CORSIA scheme presents another opportunity to re-examine and potentially adjust international aviation decarbonization policies, particularly given evolving economic and geopolitical realities. Despite ongoing
policy support and some industry investment in SAF production, widespread and costeffective SAF deployment faces significant hurdles.
Maritime decarbonization hampered by economic and regulatory challenges
The maritime sector faces a complex landscape of decarbonization policies with significant implementation challenges. The International Maritime Organization's (IMO) 'Energy Efficiency Existing Ship Index' and 'Carbon Intensity Indicator' regulations, along with the aspirational target of achieving net-zero emissions by or around 2050, provide a long-term framework for the industry.
Regional policies such as the EU's Emissions Trading System (EU ETS) and the already referenced 'FuelEU Maritime Regulation' aim to accelerate decarbonization, but at the same time they are projected to significantly increase operational costs for shipping companies. This creates competitiveness concerns, particularly given the absence of globally harmonized regulations, with risks of carbon leakage as shipping activities potentially shift to less regulated jurisdictions.
At the international level and under the auspices of IMO, the Marine Environment Protection Committee (MEPC) has recently approved a new fuel standard for ships and a global pricing mechanism for shipping emissions. These initiatives are planned for formal adoption in October 2025, with implementation set for 2027. Central to these measures is a two-tiered pricing mechanism, scheduled to take effect in 2028. Emissions will be assessed against a baseline representing the average GHG emission intensity of individual fuels. From that baseline, emission intensity is required to drop annually through 2035. The pricing mechanism will be activated if emission reduction targets are not achieved.
If emissions do not meet the lower tier 'base ambition' target, a tax of $380 will be levied for every excess tonne of CO2 equivalent (CO2e). If this base target is exceeded but the more stringent 'direct compliance' target is still not reached, a reduced levy of $100 per tonne of CO2e is set to apply. Surplus units will be credited if targets are met or exceeded, which may be banked and used to offset future shipping emissions for up to two years. Revenues generated from this scheme will support a planned IMO Net-Zero Fund.
Consequently, the global maritime energy transition is realistically projected to be a complex and multifaceted undertaking, likely proceeding at a slower pace than initial aspirational targets suggest. This necessitates pragmatic and data-driven policy assessments, acknowledging the inherent practical limitations and diverse regional contexts that will shape the sector's evolution. A key overarching challenge that persists is the fundamental lack of a unified and universally binding global regulatory framework for maritime decarbonization.
Furthermore, the critical enabling and complex factors of scalability, affordability and the deployment of necessary infrastructure for alternative fuels and genuine zero-emission technologies are not yet sufficiently advanced to support a rapid and wholesale decarbonization of the global fleet within the currently projected timelines.
Challenges loom over renewable energy expansion
While renewable energy continues to expand in many markets, significant challenges are emerging that temper expectations for the rapid transformation of power systems. Supply

chain vulnerabilities and inflationary pressures have increased the cost of renewable components, while rising interest rates have elevated project financing expenses. Grid connection challenges have also become increasingly acute, leading to lengthy delays and substantial costs in connecting new capacity to transmission networks.
Policy challenges are also emerging across multiple regions. Renewables remain supported by subsidies in most markets, but policy concerns related to retroactive renewable energy subsidy cuts have created investor hesitancy. Moreover, continued subsidies for conventional generation in certain regions can also undermine the competitive position of renewables.
Growing concerns about grid stability and system reliability with higher shares of variable renewable energy are prompting some policymakers to maintain or even incentivize dispatchable generation sources, including natural gas and coal. These challenges suggest that while renewable capacity will continue to grow, conventional generation will remain essential for system reliability and affordability for the foreseeable future.
1.4 Technology and innovation
Technology development in the energy sector is an important consideration and a key assumption for any outlook addressing energy futures. New technologies can disrupt sectors and bring about major change, and even well-established technologies can evolve over time to become ever more efficient and effective.
One important factor to take into consideration is time. The year 2050 can appear a long way off, but for many applications the development, commercialization and diffusion of new technologies can take significant time, leading to a limited impact on energy demand and supply by midcentury. Another factor is understanding the full impact of new technologies. Breakthroughs that may upend a market or industry are notoriously difficult to predict, as is determining which single technology in a group of competing technologies is destined to succeed.
The result of the above is that this Outlook assumes a continuous and gradual evolution of technology, with no sudden technology breakthroughs in the outlook period. Nonetheless, this section discusses existing and emerging technology in the energy sector that will likely influence energy demand and supply.
1.4.1 Technologies by fuel
Oil
From the perspective of drilling, advanced extraction technologies include smart drilling, autonomous rigs and enhanced oil recovery (EOR) techniques.
Smart drilling technology enables access to increasingly challenging reservoirs. Combined with AI algorithms and real time data sensors, the drilling process can be optimized through adjusting drilling fluid composition, torque and bit rotation speed. The process also helps reduce down times and minimizes formation damage. Autonomous rigs follow a similar principle in utilizing AI to increase upstream production and efficiency, both offshore and onshore. The rigs are equipped with advanced imaging systems and remote-controlled actuators, which reduces hazardous conditions and boosts drilling efficiency.

The push to maximize recovery rates has resulted in dramatic EOR advancements. New methods of injecting CO2 have enhanced the rate of oil recovery with precise control of injection flow rates and pressures. Smart EOR systems have been created that utilize realtime data analytics, to dynamically optimize the process of injecting, and hence, achieve a more even displacement of the oil. New methods of EOR with chemicals and microbes are also being explored, with encouraging outcomes achieved from changing the reservoir rock's wettability and lowering the interfacial tension between water and oil. These innovations not only boost output from mature reservoirs, but also lower the carbon footprint of the extraction process with the use of captured and reused CO2.
Additionally, some of the biggest oil-producing nations are researching hybrid systems that integrate carbon sequestration and alternative sources of energy. For example, complex carbon sequestration processes are being infused into refinery processes, and offshore platforms are beginning to be equipped with alternative sources of energy (e.g., wind or solar) to help reduce emissions. These hybrid systems also help boost the overall sustainability of the industry.
Natural gas
Current technological developments with respect to natural gas include advanced combustion and novel turbine materials, such as ceramic matrix composites and advanced metal alloys. The characteristics of these materials include a higher operational temperature resistance, resulting in their utilization in more aggressive combustion environments. Given these turbines run hotter than usual, their thermal efficiency improves significantly. Another benefit lies in the application of novel premixed combustion systems, where nitrogen dioxide (NOx) is reduced, and fuel efficiency maximized. This results in a process with a near-complete fuel burn, with both emissions and fuel consumption reduced significantly.
Innovative modular approaches including plug and play control systems and microturbine configurations also support a pivot away from large monolithic turbines, with subsequent easier construction and operational processes. Operators can also benefit from quick grid integration given the modular structure and easier operational setup. The benefit of this technology is a higher capacity factor through a reduction in per-unit generation costs. However, adoption is limited by high initial capital investments and retrofitting complexities, providing a challenge when integrating gas turbines into the existing grid.
One of the most significant developments in the natural gas sector is the introduction of smart methane detection. By leveraging AI, these systems are capable of detecting methane leaks by using optical gas imaging and laser-based spectroscopy. These sensors collect the data using drones and other unmanned vehicles. The results of the collected data are then introduced to machine learning models that allow real time monitoring. These AI algorithms have the capability of quickly identifying anomalies and alerting operators before any leak escalates.
Coal
Carbon capture utilization and storage (CCUS) technology in the coal sector has witnessed significant improvements when it comes to CO2 sequestration. New CCUS technologies allow higher capture rates by utilizing advanced chemical solvents and solid sorbents, with the process enabling a more selective and energy efficient partition of CO2 embedded in flue gasses. CCUS is applied for the optimization of pre-combustion and post-combustion operations, allowing

hybrid systems to combine processes like cryogenic separation with chemical absorption. Overall, CCUS systems are critical for the mitigation of CO2 from coal-fired power plants.
High-Efficiency, Low-Emissions (HELE) technology allows coal-fired power plants to operate under ultra-supercritical steam conditions, exceeding the pressure of 25 megapascals (MPa) and a temperature of 600°C. This results in higher thermal efficiencies compared to conventional coal plants. Additionally, the usage of HELE reduces fuel consumption with respect to one unit of electricity generated. New materials and designs also support this technology too, particularly with the integration into hybrid systems, leading to a more efficient and clean coal burning process. It should be noted that substantial investment is required to retrofit current facilities with HELE.
Nuclear
Regulatory reforms, digital integration, especially AI in data centres, and the introduction of new reactor designs and advanced fuel technologies are transforming the field of nuclear energy.
Small modular reactor (SMR) developments and advancements are currently a major driver for nuclear energy. SMRs provide flexible options for nuclear, given their smaller size, deployment as a single or multi-module plant, better upfront capital cost affordability, easier grid integration, as well as safety and reliability standards. Today, there are believed to be around 80 SMR designs and concepts, with some projects now in the advanced stages of construction. SMRs are suitable for fast project development as they are not bound by location. This makes them ideal for remote areas and/or smaller grids, providing and supporting a stable baseload in the power generation sector.
Besides SMRs, so called Generation IV (Gen IV) reactors are in development and supported by the Generation IV International Forum. These reactors combine high safety features with improved economics and environmental performance, with demonstratable high thermal efficiencies. China was the first country to see a Gen IV reactor (HTR-PM in Shidaowan, Shandong) enter commercial operation, but others are in the pipeline. Another sodiumcooled reactor is being constructed in Xiapu, China. It is expected to commence operations in 2025, adding 600 MW. In addition, China is planning a scaled-up version of the HTR-PM in Lianyungang that should provide 650 MW, with commercial operations set to start in 2030. The purpose is to process heat for petrochemical plants. Further projects include the construction of a new Gen IV reactor in Russia, which should be completed in 2028. It is expected to boost power grid capacity by 300 MW.
Wind
Technological developments in the wind sector have tended in recent times to focus on a push for larger turbines that typically improve capacity factors. Tall towers and large rotor diameters that dwarf early designs are driving up average onshore turbine capacities to over 3 MW, with several commercial designs achieving over 6 MW. This means that individual turbines can produce enough electricity to power small towns.
Offshore wind turbines can provide much higher capacities of up to 20 MW, capitalizing on more consistent and higher wind speeds. The offshore wind sector has been growing more rapidly than onshore, and here other new technologies, such as structures for floating offshore wind and the turbines themselves, are playing a great role, particularly in terms of efficiencies.
The sector, however, is also suffering from its own success. Matching turbine supply and demand is proving a challenge for the industry and the drive for larger turbines has contributed to deployment challenges related to logistics, transportation and installation. As projects ramp up in the coming years, these issues could become further potential bottlenecks, limiting additional long-term deployment. Moreover, grid curtailment, where the electricity grid is not able to absorb the increasing amount of wind power generated, has become an important issue and resulted in lower utilization rates.
One interesting alternative to the common horizontal wind turbine design is the vertical axis wind turbine. These are often simpler in construction and with the blades rotating on a vertical axis. This allows wind to be captured from every direction and opens up further possibilities for wind deployment. Moreover, they can be easier maintained and serviced due to the critical location of their components near the base. However, they do come with their own limitations, related to efficiency, drag forces and higher maintenance cost given that the blades are located near ground level, which creates greater vibration and turbulence.
Digital transformation and the rollout of AI have the capability to impact wind energy, for instance, through methodologies related to predictive maintenance and shutdowns combined with AI. It is an approach that can extend the lifetime of wind turbines while minimizing downtime.
Overall, this Outlook assumes a continued drop in the levelized cost of electricity (LCOE) for wind energy over the long term. However, it should be noted that supporting infrastructure and grid upgrades, as well as the deployment of energy storage systems to mitigate issues with intermittency, can mean the overall net cost is higher.
Solar
Similar to wind, it is assumed that the LCOE for solar will continue to drop over the outlook period, building on past cost reductions. New solar technologies continue to improve efficiencies. For example, perovskite-silicon tandem cells are viewed as one of the most promising solar technologies. These cells consist of stacked units with a perovskite top cell and a bottom silicon cell. This layout enables the cell to harness different parts of the solar spectrum, with the perovskite top cell absorbing high energy photons and the silicon layer absorbing low energy red and infrared light.
The technological development of thin-film solar cells refines the perovskite-based films, resulting in both lower costs for production and improved efficiencies. The cells are utilized ideally in building-integrated PV and portable applications.
Another option is multifunction solar cells that extend the traditional efficiency limits through combining multiple layers of semiconductors. Recent research has shown that multifunction solar cells can operate with efficiencies well above 40% under standard illumination configurations.
Hydrogen
Hydrogen presents significant opportunities, including through collaboration with the oil and gas industry. For example, the oil industry's infrastructure, expertise and capacity for investment, uniquely positions it to lead in hydrogen production, distribution and storage.

Within the hydrogen sector there have been several electrolyzer efficiency enhancements. So called proton exchange membrane electrolyzers are said to achieve 75% efficiency and can be used to support oil operations. Additionally, alkaline electrolyzers improve hydrogen production at a lower cost basis and at higher output.
Ammonia-based hydrogen transportation represents a promising area for oil and gas stakeholders. It helps address logistical challenges inherent in hydrogen storage and distribution. The utilization of ammonia as a hydrogen carrier effectively extends global supply chain capabilities and leverages existing ammonia infrastructure. Moreover, there are multiple innovations in ammonia cracking, for example, through waste heat recovery techniques. These offer improved efficiency and reduce operational costs while complementing current oil and gas operations.
The scaling of both blue and green hydrogen can align closely with the strategic objectives of oil companies. Autothermal reforming, combined with CCUS technology, provides costeffective production of blue hydrogen, positioning the oil sector as a critical player in lowcarbon hydrogen supply chains. At the same time, it offers increased integration of renewable energy sources for green hydrogen production for oil companies. This allows them to capitalize on existing project management experience and infrastructure assets.
1.4.2 Focus on transportation technologies
Road transportation
The most widely covered topic in the transportation sector is the development and future role of EVs. What is clear is that cost challenges remain, although mass production is providing benefits, with China, in particular, producing relatively low cost EVs for the global market.
From the point of view of the technology, advancements in batteries are expected to continue to help push the range of EVs higher and over 500km over time. Other innovations are also set to gradually improve EV performance, charging time and safety, such as the application of solid-state batteries. Without breakthroughs in battery chemistries, however, the battery supply chain will continue to face massive challenges to supply the necessary critical minerals to meet demand for the two dominant battery chemistries today – nickel manganese cobalt and lithium iron phosphate.
For electric commercial vehicles, without sizeable energy density improvements they are assumed to play only a very minor role by 2050. However, natural gas vehicles (NGVs) are anticipated to be used more as an alternative, but the expectation is that will still have only a small share in the global fleet.
It should also be noted that developments in ICE technology will not remain static, with expectations for gradual improvements in efficiency over time. Moreover, combining ICEs and battery electric engine systems in so called mild hybrid systems, where the ICE is supported by a small electric motor, can help improve average fuel efficiencies by noticeable amounts. Additionally, other technology applications could help improve fuel efficiencies; for instance, the leveraging of AI to reduce road congestion and emissions by deploying traffic management systems, especially in OECD regions, or the use of platooning to reduce aerodynamic drag for commercial vehicles.

Air transportation
This outlook takes a pragmatic approach to technological advancements in the global air transportation sector. The industry relies heavily on hydrocarbons due to their high energy density and reliability in aviation operations.
A major technological focus in aviation is the development of SAFs and blending rates are expected to continue to increase, reducing lifecycle emissions. As already noted, the EU's aviation policy is driving the pivot towards an increased use of SAF. However, this is expected at a low scale over the outlook period.
It is worth noting that air transportation already leverages AI, in particular for flight path optimization. Predominantly, the introduction of real-time weather analysis and AI-driven navigation adjustments reduce fuel consumption and emissions, while also cutting flight time. This provides airlines with the capability to expand their jet fleets due to significant efficiency gains driven by factors beyond traditional fuel improvements. A deeper look into regional and sectoral developments reveals targeted strategies toward efficiency, AI and decarbonization. For example, within the OECD Americas, AI is increasingly integrated into air traffic control systems to optimize fuel efficiency and reduce overall emissions.
In terms of the utilization of hydrogen and electric propulsion systems, it is noteworthy that these technologies are still in their infancy. To name some examples, Rolls-Royce has retrofitted turbines for 15% hydrogen co-firing. Additionally, there are pilot projects involving electric regional aircraft, often featuring hybrid designs that combine traditional jet kerosene engines with electric propulsion to reduce hydrocarbon dependency.
Aviation manufacturers are also employing lightweight composite materials into their designs to increase fuel efficiency. Ground infrastructure is adapting too, rendering airport operations more efficient by employing a mix of technologies, such as renewable energy integration and advanced heating, ventilation and air conditioning (HVAC) systems. Moreover, advanced energy management systems allow airports to optimize their energy and water usage.
Maritime transportation
Technological change in the maritime transportation sector has similar characteristics to the aviation sector, often adopting technological advancements at a measured and cautious pace, with limited penetration of alternative fuels.
On a regional basis, nearly all developments emerge from the OECD region. For example, OECD Europe continues the expansion of hydrogen ready ports for lower emissions shipping, which extends the continued role of traditional fuels, and OECD Asia-Pacific regions are investing heavily in AI-driven solutions for logistics.
Sectoral insights show that like the aviation transportation sector, shipbuilders use lightweight materials and aerodynamic hull design to ensure more efficiency. Additionally, modular carbon capture technology provides a possible future solution and has the capability of sequestering nearly 65% of maritime transport emissions. Vessels utilize waste heat from traditional engines in a partial energy recovery approach to reduce emissions while optimizing energy usage.
AI advancements have become increasingly potent in enhancing routing and the operational excellence of vessels at sea, as well as the associated infrastructure on land. Machine

learning algorithms predict routes optimized for fuel efficiency, by analyzing real-time waves, currents and weather data.
The technological improvement of maritime vessel engines has resulted in the introduction of so-called LNG-Ammonia Dual-Fuel Engines. At this stage, about 5% of the global fleet uses this technology that has resulted in an ammonia substitution rate of nearly 45% They provide operational flexibility by using both LNG and ammonia. Major projects include the collaboration of South Korea's Hanwha Ocean Corporation and German manufacturer MAN Energy Solutions to construct the world's first ammonia dual-fuel engine.


Energy demand
2
Key takeaways
- • Global primary energy demand is projected to increase from 308 mboe/d in 2024 to almost 378 mboe/d in 2050, an increase of 23% over the outlook period, or 0.8% p.a. on average.
- • Primary energy demand growth to 2050 will come almost entirely from developing regions (non-OECD), while energy demand in developed countries (OECD) is expected to stay flat and/or decline.
- • Except for coal, demand for all primary fuels will increase over the outlook period.
- • Demand for renewable energy will increase from 47.4 mboe/d in 2024 to almost 100 mboe/d in 2050. This growth is largely driven by the expansion of other renewables (mostly wind and solar), which increases by 40.5 mboe/d over the outlook period, driven by supportive polices and declining generation costs.
- • After a long period of stagnation, nuclear energy is likely to see significant growth, rising from 14.9 mboe/d in 2024 to almost 25 mboe/d in 2050.
- • Energy demand for oil and gas is expected to increase strongly over the outlook period, in line with strong demand for reliable and affordable energy. Oil demand will rise by 18.2 mboe/d, while natural gas will rise by almost 20 mboe/d between 2024 and 2050.
- • Despite a marginal decline, oil will remain the fuel with the largest share in the energy mix, at just below 30% in 2050. The combined energy mix share of oil and gas is expected to stay above 50% between 2024 and 2050.
- • From almost 82 mboe/d in 2024, demand for coal is expected to sink to 51.4 mboe/d in 2050 due to unfavourable energy and climate policies, and the penetration of other fuels.
- • Total electricity demand is expected to increase from around 31,500 TWh in 2024 to roughly 57,500 TWh in 2050. Around 75% of this growth is projected to come from developing countries, with almost 60% alone expected to come from developing countries in Asia.
- • By far the largest increase in the generation mix is projected for other renewables (mostly wind and solar), growing from around 4,900 TWh in 2024 to 26,000 TWh in 2050.
- • The share of non-fossil fuels in the global power generation mix is set to increase from 42% in 2024 to 67.5% in 2050, mostly due to a decline in coal-fired generation and an increase in other renewables.
- • Despite significant growth in energy consumption in developing countries, this will not be sufficient to address the global challenge of energy poverty, which is anticipated to remain acute even in the long term. The persistent gap between OECD and non-OECD per capita energy consumption underlines the need for a robust multilateral and collaborative approach to tackle energy poverty and enhance energy access.

This chapter provides an overview of medium- and long-term primary energy demand trends by different fuels, major regions, and countries and sectors in the Reference Case, with a special focus on electricity. Key assumptions provided in Chapter 1, such as demographic and economic developments, as well as long-term energy technology trends and the evolution of energy policies, are taken into consideration in these projections. This chapter also focuses on the implications of energy demand trends on energy poverty and energy access in the Reference Case.
2.1 Major trends in energy demand
Multiple crises have shaken the global energy sector since 2020, including the COVID-19 pandemic, the energy crisis in 2022, supply chain issues and geopolitical uncertainty surrounding conflicts. This has led to surging energy costs and a lack of energy security in developed and developing countries alike. Consequently, many countries have adjusted their policies addressing energy affordability. In some cases, this has resulted in delays to ambitious targets related to the deployment of renewables, energy efficiency and infrastructure. Moreover, new uncertainties also emerged over the past year, mainly linked to significant changes in economic and energy policies in several countries.
Despite strong progress in recent years, the pace of deployment of renewables is clearly insufficient to meet the rising energy demand in many regions. Although growth has been supported by declining LCOEs, these do not represent the full costs associated with intermittent renewables. Project developers are increasingly facing difficulties related to permitting procedures, insufficient grid capacities, financing and supply chain issues, which all lead to higher overall costs. Intermittent renewables also require additional balancing services. The challenge of intermittency can be mitigated by deploying backup capacity (mostly thermal plants fired by gas) and/or storage (hydro storage or batteries). Although intermittency is not a novel problem, it has reached new heights recently.
Indeed, the ever-rising share of renewables in the power generation mix in some countries is increasingly creating large seasonal imbalances due to occasional periods of low wind and solar generation. The periods in winter when the wind does not blow and the sun does not shine, pose significant challenges to a country's power system, as they require substantial reserve capacity and/or power imports. Energy markets across numerous European countries witnessed several of these periods in late 2024, resulting in soaring electricity prices and power systems teetering dangerously close to blackouts. This has led to a wider discussion about the optimal pathway to low-carbon energy systems and sparked criticism of any overreliance on intermittent renewable sources.
This helps explain why many market participants have grown skeptical about the feasibility of ambitious narratives that call for one-sided solutions. Instead, calls for more balanced, realistic and inclusive approaches have grown louder, urging greater consideration of energy security and affordability, alongside sustainability. Against this backdrop, it has become increasingly clear that all energy sources and all technologies will be needed to fuel demographic and economic growth in the long term. At the same time, the overarching priority to reduce emissions is still widely recognized and accepted by consuming and producing countries alike. Many policymakers and companies are recognizing these changing realities and are adjusting their policies and strategies to include more balanced views in their future energy mixes.

Amid policymakers' increasing recognition of the need for balanced future energy pathways, it is clear that the energy mix is becoming more diversified. Power supply from renewables is rising rapidly, especially in advanced economies. The year 2024 saw a new record in renewable capacity additions. Almost 600 GW of renewable capacity was installed in 2024, up from 475 GW added in 2023. The largest share of these new additions came from solar, with the remainder mainly consisting of wind and hydro. However, renewable capacity additions are still largely concentrated in a handful of countries/regions, especially China, followed by other advanced regions like the EU, UK, US and developed Asian countries. Renewable capacity additions in developing and emerging economies, excluding China, are limited. In many cases, they are also negligible relative to energy demand growth. This is due to a variety of factors, such as financing constraints, political and regulatory risks and inadequate infrastructure.
Against this backdrop, and despite the above-mentioned impressive growth in renewables, the increase in renewable capacity additions was not sufficient to meet global incremental energy demand in 2024. Instead, demand for most fuels actually increased, including oil, gas, coal and nuclear, which all reached record high levels in 2024.
The most significant driver of energy demand growth was soaring electricity consumption, which increased by more than 4% in 2024. The expansion of data centers and artificial intelligence models contributed significantly to this rise, driving electricity demand growth in many developed regions – especially in the US, but also in Europe and China. Strong electricity demand growth was observed in the residential and commercial sector, as well as in the industrial sector, partly driven by rising electrification.
As a result, this year's outlook also reflects more optimistic energy demand growth. Global energy demand is expected to increase from 308 mboe/d in 2024 to nearly 378 mboe/d in 2050 (Table 2.1). This energy demand growth of 69.4 mboe/d represents an increase of almost
| Levels mboe/d | Growth mboe/d | Growth % p.a. | Fuel share % | |||||||
|---|---|---|---|---|---|---|---|---|---|---|
| 2024 | 2030 | 2035 | 2040 | 2045 | 2050 | 2024–2050 | 2024–2050 | 2024 | 2050 | |
| Oil | 94.3 | 103.0 | 107.4 | 109.5 | 111.0 | 112.4 | 18.2 | 0.7 | 30.6 | 29.8 |
| Coal | 81.8 | 77.5 | 71.5 | 64.8 | 58.0 | 51.4 | –30.4 | –1.8 | 26.5 | 13.6 |
| Gas | 70.0 | 76.1 | 80.7 | 84.6 | 87.6 | 89.7 | 19.7 | 1.0 | 22.7 | 23.7 |
| Nuclear | 14.9 | 16.9 | 18.8 | 20.8 | 22.9 | 24.9 | 10.0 | 2.0 | 4.8 | 6.6 |
| Renewables | 47.4 | 59.0 | 69.5 | 79.6 | 89.3 | 99.4 | 52.0 | 2.9 | 15.4 | 26.3 |
| of which: Hydro | 7.8 | 8.6 | 9.3 | 9.9 | 10.7 | 11.6 | 3.8 | 1.6 | 2.5 | 3.1 |
| of which: Biomass | 29.0 | 31.3 | 33.2 | 34.8 | 35.8 | 36.6 | 7.7 | 0.9 | 9.4 | 9.7 |
| of which: Other renewables (mainly solar & wind) | 10.6 | 19.1 | 27.1 | 34.9 | 42.8 | 51.1 | 40.5 | 6.2 | 3.5 | 13.5 |
| Total | 308.4 | 332.6 | 347.9 | 359.3 | 369.0 | 377.8 | 69.4 | 0.8 | 100.0 | 100.0 |
Table 2.1 World primary energy demand by fuel, 2024–2050
Source: OPEC.

23% over the outlook period, or 0.8% p.a. on average. In line with the general slowdown in population and economic growth towards the end of the outlook period, as well as improving energy efficiency, primary energy demand growth is also expected to see a deceleration. This slowdown can be partly attributed to the growing share of other renewables, which have higher efficiency compared to traditional fuels. This means that the slowdown is much less pronounced in final energy demand, measured after energy transformation.
Except for coal, demand for all energy sources will increase over the outlook period, as shown in Figure 2.1 and Table 2.1. Demand for renewable energy (including biomass and hydro) will increase from 47.4 mboe/d in 2024 to almost 100 mboe/d in 2050. The growth is largely driven by the expansion of other renewables, i.e. solar and wind, due to strong policy support and favourable economics in some regions. Other renewables will increase by 40.5 mboe/d in the outlook period, while biomass and hydro will gain 7.7 mboe/d and 3.8 mboe/d, respectively.
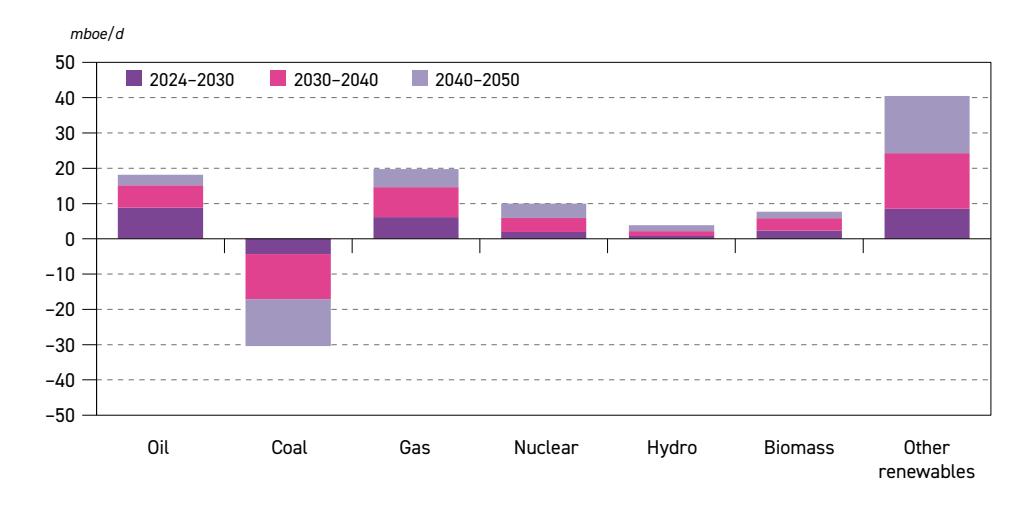
Figure 2.1 Growth in primary energy demand by fuel, 2024–2050
Source: OPEC.
Partly due to their low starting base, other renewables also experience the fastest growth over the outlook period, seeing an average annual growth rate of 6.2% p.a. Demand for other renewables is expected to increase from 10.6 mboe/d in 2024 to just over 51 mboe/d in 2050. Consequently, the share of other renewables in the primary energy mix is expected to increase from 3.5% in 2024 to 13.5% in 2050.
Demand for biomass is expected to increase by 7.7 mboe/d to reach 36.6 mboe/d in 2050, largely driven by greater adoption of biofuels. The share of biomass in the energy mix will increase marginally in the outlook period, reaching 9.7% in 2050. Demand for hydropower is also expected to increase, with rising utilization of unused resources expected, especially in developing regions. Demand for hydropower is expected to increase from 7.8 mboe/d in 2024 to 11.6 mboe/d in 2050.
Energy demand for oil and gas is also anticipated to increase strongly over the outlook period, in line with strong demand for reliable and affordable energy. Oil demand is set to increase from 94.3 mboe/d in 2024 to 112.4 mboe/d in 2050, rising by 18.2 mboe/d over the outlook period. Despite a marginal decline, oil will remain the fuel with the largest share in the energy

mix, reaching just under 30% in 2050. Strong demand growth is expected for natural gas too, driven by the availability of vast resources, competitive economics and its lower-carbon footprint. Natural gas will also play an increasingly important role in the power generation sector. Demand for natural gas is set to rise from 70 mboe/d in 2024 to 89.7 mboe/d in 2050, with its share in the energy mix increasing by one percentage point (pp) to 23.7% by 2050.
After a long period of stagnation, nuclear energy is likely to see significant growth, rising from 14.9 mboe/d in 2024 to almost 25 mboe/d in 2050. This is due to strong policy support for the expansion of nuclear capacity in many countries, driven by security of supply concerns and the increasing need for stable baseload power supply. The expected commercialization of SMRs in the 2030s is also projected to support the above-mentioned growth in demand for nuclear energy.
Coal is the only fuel that is expected to decline in the period to 2050. From levels close to 82 mboe/d in 2024, demand is expected to sink gradually to 51.4 mboe/d in 2050 due to unfavourable energy and climate policies, as well as increasing prevalence of other fuels, especially in the power generation sector. Consequently, the share of coal is expected to decline from 26.5% in 2024 to 13.6% in 2050.
The energy mix in the Reference Case is expected to experience significant changes in the long term. The share of renewables will increase significantly, rising from 15.4% in 2024 to 26.3% in 2050. However, it remains clear that all fuels will be needed to satisfy global energy demand growth. This is especially the case for oil and gas, with their combined share in the energy mix expected to stay above 50% between 2024 and 2050.
When examining primary energy demand growth by region, significant differences emerge, as shown in Table 2.2 and Figure 2.2. Primary energy demand growth to 2050 will be driven almost entirely by developing and emerging economies, while energy demand in advanced countries is expected to stay flat and/or decline.
Table 2.2
Total primary energy demand by region, 2024–2050
| Levels mboe/d | Growth Growth mboe/d % p.a. | Share % | ||||||||
|---|---|---|---|---|---|---|---|---|---|---|
| 2024 | 2030 | 2035 | 2040 | 2045 | 2050 | 2024–2050 | 2024–2050 | 2024 | 2050 | |
| OECD Americas | 55.4 | 56.7 | 57.1 | 56.8 | 56.6 | 56.6 | 1.2 | 0.1 | 18.0 | 15.0 |
| OECD Europe | 33.8 | 34.4 | 33.8 | 32.9 | 32.4 | 32.1 | –1.7 | –0.2 | 10.9 | 8.5 |
| OECD Asia-Pacific | 17.3 | 17.8 | 18.0 | 18.0 | 18.0 | 18.2 | 0.8 | 0.2 | 5.6 | 4.8 |
| OECD | 106.5 108.9 | 108.8 | 107.8 | 107.0 106.8 | 0.3 | 0.0 | 34.5 | 28.3 | ||
| China | 80.5 | 84.3 | 84.4 | 82.9 | 81.2 | 79.4 | –1.1 | –0.1 | 26.1 | 21.0 |
| India | 22.0 | 27.1 | 31.3 | 35.3 | 39.5 | 43.6 | 21.6 | 2.7 | 7.1 | 11.5 |
| Other Asia | 24.7 | 29.1 | 32.8 | 36.1 | 38.5 | 40.0 | 15.3 | 1.9 | 8.0 | 10.6 |
| Latin America | 14.1 | 16.4 | 18.4 | 20.0 | 21.2 | 22.2 | 8.1 | 1.8 | 4.6 | 5.9 |
| Middle East | 19.0 | 22.3 | 25.1 | 27.4 | 29.2 | 30.7 | 11.7 | 1.9 | 6.2 | 8.1 |
| Africa | 17.6 | 20.1 | 22.4 | 24.9 | 27.1 | 29.1 | 11.5 | 1.9 | 5.7 | 7.7 |
| Russia | 16.3 | 16.2 | 16.0 | 15.8 | 15.7 | 15.6 | –0.7 | –0.2 | 5.3 | 4.1 |
| Other Eurasia | 4.6 | 4.9 | 5.2 | 5.5 | 5.8 | 6.3 | 1.7 | 1.2 | 1.5 | 1.7 |
| Other Europe | 3.1 | 3.2 | 3.4 | 3.6 | 3.8 | 4.2 | 1.1 | 1.2 | 1.0 | 1.1 |
| Non-OECD | 201.9 | 223.7 | 239.0 | 251.5 | 261.9 | 271.0 | 69.0 | 1.1 | 65.5 | 71.7 |
| World | 308.4 | 332.6 | 347.9 | 359.3 | 369.0 | 377.8 | 69.4 | 0.8 | 100.0 | 100.0 |
Source: OPEC.
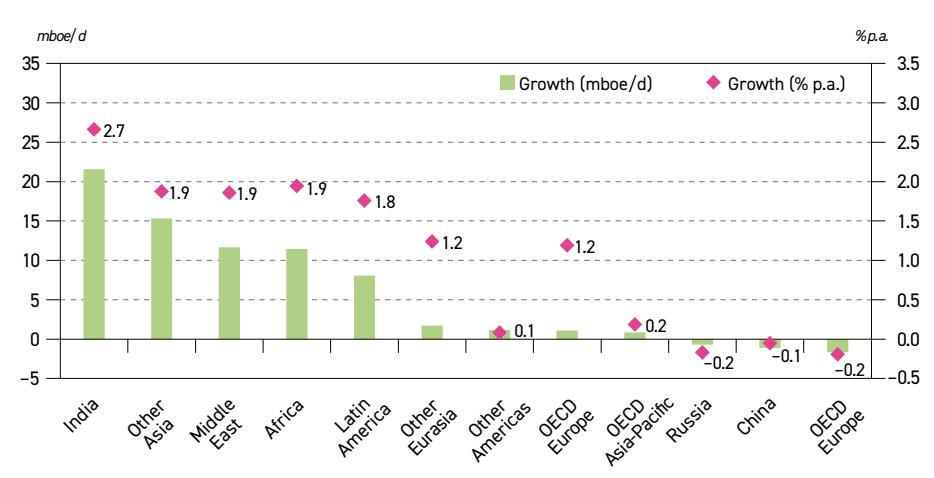
Figure 2.2 Growth in primary energy demand by region, 2024–2050
Source: OPEC.
The most important driver of energy demand growth in the period to 2050 will be India and Other Asia, increasing by 21.6 mboe/d and 15.3 mboe/d, respectively, as shown in Figure 2.2. Combined, these two regions make up more than half of the total energy demand growth in the period to 2050. Strong population growth, expanding economies, as well as rising industrialization in these regions, are the major drivers behind this staggering growth in demand. India is expected to almost double its energy demand over the outlook period, seeing an average annual growth rate of 2.7% p.a.
At the same time, energy demand in China is expected to increase through 2035, reaching 84.4 mboe/d, up from 80.5 mboe/d in 2024. However, in line with a maturing economy, rising energy efficiency and a declining population, China's energy demand is expected to start declining and reach 79.4 mboe/d in 2050. This drop will be driven by a significant phase-out of coal-fired generation and a rapid increase in the deployment of solar and wind.
The Middle East is another region that will see strong demand growth in the long term. From around 19 mboe/d in 2024, demand is set to increase to 30.7 mboe/d in 2050, an increment of 11.7 mboe/d, or 1.9% p.a. on average. This growth is expected to be driven by a growing population, increasing industrialization and rising electricity demand for water desalination. It will also be supported by the availability of comparatively low-cost energy resources, including oil and gas, as well as renewables (especially solar). A similar development is projected for Africa.
Primary energy demand growth in Africa is expected to increase from 17.6 mboe/d in 2024 to just above 29 mboe/d in 2050. The primary drivers of this are population growth, an expanding middle class and improving access to modern energy services. Similar to the Middle East, the availability of low-cost energy resources, including oil, gas and renewables, will support this growth. At the same time, energy demand in Latin America is projected to increase by around 8 mboe/d in the outlook period, reaching 22.2 mboe/d.
In Russia, energy demand is projected to decline marginally throughout the outlook period. A decrease in population, in combination with rising energy efficiency, is the major reason for this. Primary energy demand in Russia is seen at 15.6 mboe/d in 2050, down from

16.3 mboe/d in 2024. In Other Eurasia, primary energy demand is expected to experience growth, driven by increases in population and economic development. Demand is projected to increase from 4.6 mboe/d in 2024 to 6.3 mboe/d in 2050. In Other Europe, primary energy demand is set to increase from 3.1 mboe/d in 2024 to 4.2 mboe/d in 2050, primarily due to economic development.
In the OECD, primary energy demand remains mostly stagnant, seeing relatively small changes over the outlook period. In OECD Americas, demand is set to increase from 55.4 mboe/d to 57.1 mboe/d in 2035, followed by a marginal decline to 56.6 mboe/d in 2050. The need for more energy due to an expanding economy is expected to be offset by rising energy efficiency and increased penetration of renewables. In OECD Europe, primary energy demand is expected to peak around 2030 at about 34.4 mboe/d, followed by a gradual decline to 32.1 mboe/d in 2050. Similar to OECD Americas, rising efficiency, the phasing out of inefficient coal plants and the penetration of renewables are the main reasons for the region's decline in primary energy demand. In OECD Asia-Pacific, primary energy demand is expected to increase by around 0.8 mboe/d over the outlook period.
2.2 Energy demand by major regions
This section discusses regional details related to primary energy demand trends in the medium and long term. It also refers to the energy mix evolution in relation to regional economic development and major energy policies. The focus of this section is on major regions, such as the OECD and non-OECD, as well as two major economies, China and India. Due to their size, these regions and/or countries have a greater significance for energy demand compared to the rest of the world.
Figure 2.3 shows the changing primary energy mix in selected regions, including the OECD, China, India and Other Non-OECD between 2024 and 2050. There are visible similarities between these regions, but also significant differences.
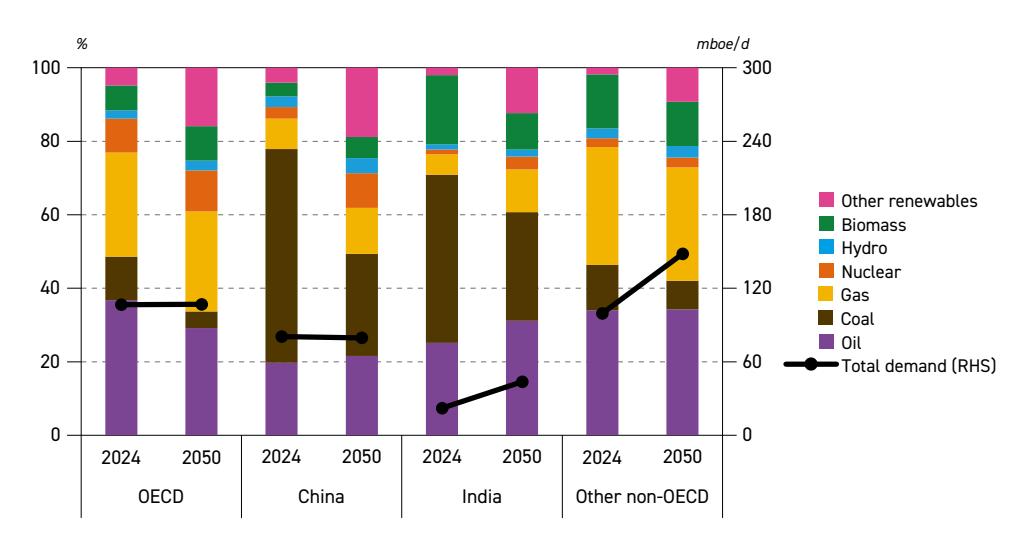
Figure 2.3
Energy mix and primary energy demand in selected regions, 2024–2050 Figure 2.3
Source: OPEC.
In the OECD and China, primary energy demand is stagnant over the outlook period, with the share of non-hydrocarbon energy sources increasing significantly in the energy mix. At the same time, the share of coal is expected to decline strongly in both regions, especially in China, in line with efforts to reduce GHG emissions. The share of natural gas is expected to increase in China, while declining marginally in the OECD. The visible difference between the OECD and China is related to the share of oil in the energy mix. In the OECD, the share of oil is expected to decline significantly, while in China it is expected to increase slightly.
In India and other developing countries, overall primary energy demand increases steadily over the outlook period, primarily driven by population growth and economic development. There is a visible increase in the share of non-hydrocarbon energy sources in the energy mix, albeit less pronounced than in the OECD and China. This difference is due to faster overall energy demand growth, as well as more limited financing and infrastructural capabilities in these regions to expand the deployment of renewables and nuclear energy. A reduction in the traditional use of biomass is also an important factor. At the same time, the share of coal is projected to decline strongly, due to unfavourable policies. This is partly offset by increasing the share of natural gas in India. The share of oil demand in the energy mix also increases, in line with demographic and economic trends in these regions, as well as strong demand from the transportation sector.
Figure 2.4 summarizes the incremental growth in primary energy demand from 2024 to 2050 by fuel type and region. Oil demand is expected to see a decline in the OECD only, while increasing in all other regions, mostly in India and other developing countries. A similar trend is seen for natural gas, with demand declining marginally in the OECD, while increasing in all other regions. In the case of coal, all regions except India are set to see a decline in demand between 2024 and 2050. China alone accounts for more than 80% of this reduction. Demand for nuclear and renewables in all regions is expected to increase over the outlook period.
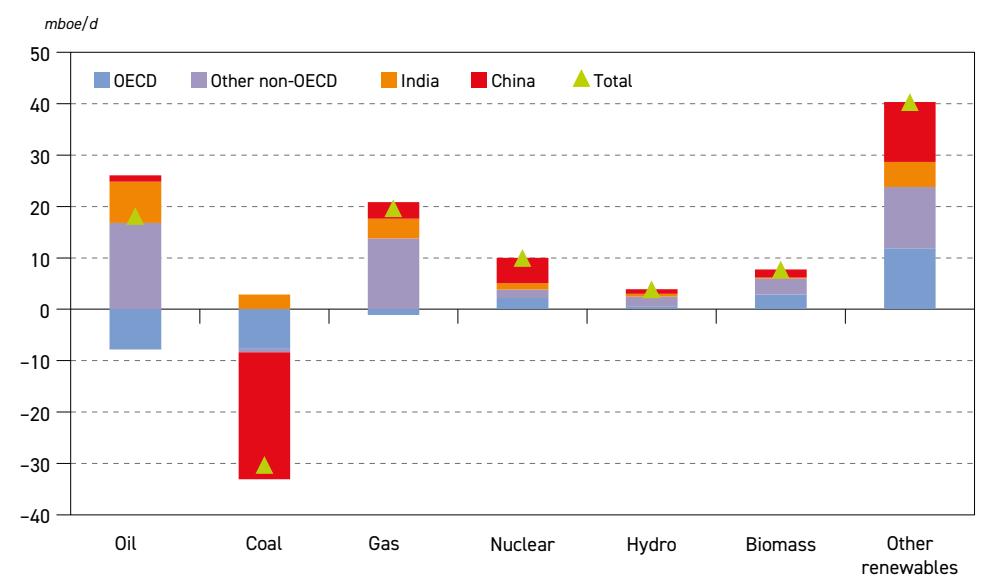
Figure 2.4 Growth in primary energy demand by fuel type and region, 2024–2050 Figure 2.4


Source: OPEC.
Other renewables lead the increase, with the OECD, China and Other Non-OECD increasing by around 12 mboe/d each over the outlook period.
2.2.1 OECD
Table 2.3 shows the outlook for primary energy demand in the OECD by major fuel. Overall energy demand in the OECD is set to increase from around 106.5 mboe/d in 2024 to just under 109 mboe/d in 2030, followed by a stepwise decline to 106.8 mboe/d in 2050. Underlying energy trends are dominated by relatively slow population growth and maturing economies. Many OECD countries have energy policies in place that promote energy efficiency and the increased deployment of renewables. However, uncertainty related to the OECD's long-term energy mix has increased significantly due to geopolitical challenges and other factors. This in turn has led to a renewed focus on energy security and affordability, prompting energy policy shifts across some OECD countries, especially the US.
Levels mboe/d Growth mboe/d Growth % p.a. Fuel share % 2024 2030 2035 2040 2045 2050 2024–2050 2024–2050 2024 2050 Oil 39.1 39.6 38.1 35.6 33.2 31.1 –7.9 –0.9 36.7 29.2 Coal 12.6 10.4 8.5 7.0 5.8 4.9 –7.8 –3.6 11.9 4.5 Gas 30.2 30.4 30.1 29.8 29.4 29.0 –1.2 –0.2 28.4 27.2 Nuclear 9.8 10.2 10.6 11.0 11.5 11.9 2.1 0.8 9.2 11.2 Renewables 14.8 18.4 21.4 24.4 27.2 29.9 15.1 2.7 13.9 28.0 of which: Hydro 2.5 2.6 2.6 2.7 2.8 2.9 0.4 0.6 2.3 2.7 of which: Biomass 7.2 7.7 8.3 8.9 9.5 10.0 2.8 1.3 6.7 9.3 of which: Other renewables (mainly solar & wind) 5.2 8.1 10.5 12.7 14.9 17.0 11.9 4.7 4.8 15.9 Total 106.5 108.9 108.8 107.8 107.0 106.8 0.3 0.0 100.0 100.0
Table 2.3 OECD primary energy demand by fuel type, 2024–2050
Source: OPEC.
Oil demand in the OECD is expected to decline by almost 8 mboe/d in the outlook period, reaching just above 31 mboe/d in 2050. Rising energy efficiency, penetration of EVs and the substitution of oil in other sectors is a major reason for this trend. However, the decline in oil demand is projected to be more gradual than in last year's outlook, due to a weakening of policies aimed at replacing oil. Demand reduction is strongest in OECD Europe at around 3.4 mboe/d, followed by OECD Americas at 2.8 mboe/d and OECD Asia-Pacific at 1.7 mboe/d.
Coal demand is also expected to decline, losing 7.8 mboe/d over the outlook period and dropping to just 5 mboe/d in 2050. The planned phase-out of coal due to energy policies and aging coal plants is expected to proceed. In addition, coal-fired electricity generation is expected to be substituted by other energy sources, such as renewables, nuclear and – to some extent – gas. The largest reduction in coal demand occurs in OECD Americas, at 3.7 mboe/d, followed by OECD Europe and OECD Asia-Pacific at 2.8 mboe/d and 1.3 mboe/d,

respectively. However, there remains a potential upside for coal demand in the event of electricity shortages, particularly if the expansion of renewables and/or nuclear energy proceeds at a slower pace than expected in many countries across these regions.
Natural gas demand in the OECD shows diverging regional trends. In OECD Americas and OECD Asia-Pacific, natural gas demand is expected to increase marginally between 2024 and 2050, while declining moderately in OECD Europe. Overall, natural gas demand in the OECD is expected to decline by 1.2 mboe/d. Natural gas is seen as the fuel of choice in many regions, due to its low carbon footprint, the availability of vast amounts of gas resources, its competitive cost and the flexibility of natural gas plants in electricity generation.
Demand for nuclear energy is expected to increase from 9.8 mboe/d in 2024 to almost 12 mboe/d in 2050. In recent months, there has been a fresh wave of support for nuclear energy among policymakers in OECD countries, partly due to concerns related to energy security. Furthermore, the expected commercialization of SMRs is also expected to support the expansion of nuclear energy in the long term. The largest share of this increase comes from OECD Asia-Pacific, reflecting the restart of existing nuclear plants and the construction of new ones in Japan. Smaller increases are also expected in OECD Americas and OECD Europe. However, it is worth noting that these modest increases for nuclear energy demand also assume the replacement of aging plants in many OECD countries in the period to 2050.
Other renewables are set to increase from 5.2 mboe/d in 2024 to 17 mboe/d in 2050, amid their strong expansion in all subregions of the OECD region (OECD Americas +5.5 mboe/d, OECD Europe +4.1 mboe/d and OECD Asia-Pacific +2.3 mboe/d). This is supported by the rising competitiveness of renewables, as well as continued policy support in many OECD countries. However, uncertainties remain, including potential policy-related headwinds in many regions and insufficient grid capacity to accommodate the deployment of intermittent renewables.
Hydropower is set to increase modestly from 2.5 mboe/d in 2024 to 2.9 mboe/d in 2050, reflecting minor new builds, as well as the refurbishment of existing hydropower plants, which increase their efficiency. Hydro remains a crucial component of power generation systems in many countries, with hydro storage capacities playing an important role in maintaining grid stability.
OECD biomass demand is set to increase from 7.2 mboe/d in 2024 to 10 mboe/d in 2050, with incremental demand driven by the advanced use of biomass. This reflects the growing production of bio-based fuels, such as biofuels for road and air transportation, as well as biomethane in most OECD countries. Bioplastics also represent a potential long-term driver of biomass demand.
2.2.2 Non-OECD
Table 2.4 shows long-term total primary energy demand in the non-OECD. Total energy demand is set to increase from almost 202 mboe/d in 2024 to 271 mboe/d in 2050, which represents an increase of 69 mboe/d. Around 31% of this increase is accounted for by India, with significant increases coming from Other Asia, the Middle East and Africa. Most of this demand growth is linked to population growth, improving living standards, reduced energy poverty, as well as increasing industrialization.

| Levels mboe/d | Growth mboe/d | Growth % p.a. | Fuel share % | |||||||
|---|---|---|---|---|---|---|---|---|---|---|
| 2024 | 2030 | 2035 | 2040 | 2045 | 2050 | 2024–2050 | 2024–2050 | 2024 | 2050 | |
| Oil | 55.2 | 63.4 | 69.2 | 73.9 | 77.8 | 81.3 | 26.1 | 1.5 | 27.3 | 30.0 |
| Coal | 69.2 | 67.1 | 63.0 | 57.8 | 52.2 | 46.5 | –22.7 | –1.5 | 34.3 | 17.2 |
| Gas | 39.8 | 45.8 50.6 54.8 58.2 60.7 | 20.9 | 1.6 | 19.7 | 22.4 | ||||
| Nuclear | 5.2 | 6.7 8.2 9.8 11.5 13.0 | 7.8 | 3.6 | 2.6 | 4.8 | ||||
| Renewables | 32.6 | 40.6 | 48.1 | 55.3 | 62.2 | 69.5 | 36.9 | 3.0 | 16.1 | 25.6 |
| of which: Hydro | 5.3 | 6.0 | 6.6 | 7.2 | 7.9 | 8.7 | 3.4 | 1.9 | 2.6 | 3.2 |
| of which: Biomass | 21.8 | 23.6 | 24.9 | 25.9 | 26.3 | 26.7 | 4.9 | 0.8 | 10.8 | 9.8 |
| of which: Other renewables (mainly solar & wind) | 5.5 | 11.0 16.6 22.2 27.9 34.1 | 28.6 | 7.3 | 2.7 | 12.6 | ||||
| Total | 201.9 | 223.7 | 239.0 | 251.5 | 261.9 | 271.0 | 69.0 | 1.1 | 100.0 | 100.0 |
Table 2.4 Non-OECD primary energy demand by fuel type, 2024–2050
Source: OPEC.
The largest growth is expected for other renewables, followed by oil and gas. Modest but significant increases are expected for nuclear energy, biomass and hydropower. Demand for coal is expected to decline significantly over the outlook period, driven by policies in China. The consequence is a significant change in the energy mix, with a more diversified energy supply expected in 2050 relative to the base year.
Other renewables in the non-OECD are expected to increase by 28.6 mboe/d, reaching 34.1 mboe/d in 2050. Around 40% of this growth comes from China, driven by strong policy support, well-developed supply chains and declining costs. In addition, the rapid development of China's renewables industry and production capacities are expected to have spillover effects, including boosting the deployment of renewables elsewhere, especially in Asia and the Middle East. Other Asia, India and the Middle East are projected to see demand for other renewables increasing by 5.1 mboe/d, 4.9 mboe/d and 2.3 mboe/d, respectively, between 2024 and 2050. The share of other renewables in the energy mix of the non-OECD is projected to increase by almost 10 pp to 12.6% in 2050.
Oil demand in the non-OECD is expected to increase by 26.1 mboe/d, rising to 81.3 mboe/d in 2050. The major driver is population growth and an increasing middle class, as well as rising energy access in many developing countries. This is reflected in anticipated rising demand from the transportation and industrial sectors, particularly in petrochemicals. Rising energy access is expected to support demand growth for liquefied petroleum gas (LPG), especially in Sub-Saharan Africa. Consequently, the share of oil in the energy mix of the non-OECD is expected to increase to 30%, displacing coal as the fuel with the highest share in the energy mix.
Non-OECD natural gas demand is projected to increase from just below 40 mboe/d in 2024 to 60.7 mboe/d in 2050, increasing its share from 19.7% to 22.4%. Rising electricity demand is a key driver of this growth in demand for natural gas, which will also support efforts to reduce GHG emissions and replace coal in countries like China and India. Furthermore, some

non-OECD regions, such as the Middle East and Africa, will benefit from having vast gas resources available at competitive costs.
Biomass demand in the non-OECD is expected to increase by almost 5 mboe/d and reach 26.7 mboe/d by 2050, mainly due to the advanced use of biomass. At the same time, as energy access is expected to increase, traditional use of biomass is set to decline in the long term. Finally, hydropower demand is set to increase from 5.3 mboe/d in 2024 to 8.7 mboe/d in 2050, driven by new projects in developing countries across Asia and Africa.
The only fuel that is expected to see a decline over the outlook period is coal. Demand is set to drop from 69.2 mboe/d in 2024 to 46.5 mboe/d in 2050. The major driver of this decline is China's effort to reduce the use of coal and achieve peak emissions by 2030. More efficient coal use in China is also contributing to this trend. However, this decline in Chinese coal use will partly be offset by increased coal demand in some countries of the non-OECD, including India and Other Asia.
The following section provides more details about energy demand trends in China and India, which, as mentioned, have a significant impact on the global energy landscape due to their size.
The primary energy demand outlook for China is presented in Table 2.5. Primary energy demand in China is expected to increase from 80.5 mboe/d in 2024 to 84.4 mboe/d in 2035. This increase in demand is driven by an expanding economy, especially industrial demand. Primary energy demand will start to decline from 2035 onwards, dropping to 79.4 mboe/d in 2050. This is due to several drivers, including population decline, slower GDP growth and the expansion of renewables replacing inefficient coal in the power generation sector. More clarity will be provided by the country's 15th Five-Year Plan, which will cover the period from 2026 to 2030.
| Levels mboe/d | Growth mboe/d | Growth % p.a. | Fuel share % | |||||||
|---|---|---|---|---|---|---|---|---|---|---|
| 2024 | 2030 | 2035 | 2040 | 2045 | 2050 | 2024–2050 | 2024–2050 | 2024 | 2050 | |
| Oil | 15.8 | 17.2 | 17.7 | 17.6 | 17.4 | 17.1 | 1.2 | 0.3 | 19.7 | 21.5 |
| Coal | 46.8 | 43.2 | 38.1 | 32.5 | 27.1 | 22.1 | –24.8 | –2.9 | 58.2 | 27.8 |
| Gas | 6.7 | 8.1 | 9.1 | 9.8 | 10.1 | 9.9 | 3.3 | 1.6 | 8.3 | 12.5 |
| Nuclear | 2.5 | 3.6 | 4.6 | 5.6 | 6.6 | 7.5 | 5.0 | 4.3 | 3.1 | 9.5 |
| Renewables | 8.6 | 12.1 | 15.0 | 17.3 | 19.9 | 22.8 | 14.2 | 3.8 | 10.7 | 28.7 |
| of which: Hydro | 2.3 | 2.6 | 2.8 | 2.9 | 3.1 | 3.3 | 0.9 | 1.3 | 2.9 | 4.1 |
| of which: Biomass | 3.0 | 3.5 | 4.0 | 4.2 | 4.4 | 4.6 | 1.6 | 1.6 | 3.7 | 5.7 |
| of which: Other renewables (mainly solar & wind) | 3.3 | 6.0 | 8.2 | 10.2 | 12.4 | 15.0 | 11.7 | 6.0 | 4.0 | 18.8 |
| Total | 80.5 | 84.3 | 84.4 | 82.9 | 81.2 | 79.4 | –1.1 | –0.1 | 100.0 | 100.0 |
Table 2.5 China primary energy demand by fuel type, 2024–2050
Source: OPEC


While China is expected to add significant coal-fired capacity in the medium term, new plants will likely replace older and inefficient units. Furthermore, a strong expansion of renewables and nuclear are expected to limit the utilization of coal power plants. This is the main reason for China's decline in coal demand from 46.8 mboe/d in 2024 to 22.1 mboe/d in 2050. Consequently, the share of coal in the mix is expected to drop from around 58% in 2024 to just below 28% in 2050. This is in line with efforts to achieve a peak in CO2 emissions by 2030 and carbon neutrality by 2060. It is important to note that expanding its coalfired capacity will also underpin the country's security of supply and help offset potential shortages from intermittent renewables due to unpredictable weather patterns.
China's impressive expansion of other renewables continued in 2024, seeing record high additions of PV capacity. Wind and solar electricity generation increased by around 25% in 2024, relative to the previous year. Declining costs of renewables, strong policy support, and a well-developed industrial base for renewables all contributed to this expansion. In the medium and long term, the increase in other renewables is expected to continue, with demand increasing from 3.3 mboe/d in 2024 to 15 mboe/d in 2050. The share of other renewables in the mix is expected to rise from 4% in 2024 to almost 19% in 2050.
Strong growth is projected for nuclear power as well, with many projects currently under construction (around 30 GW) and more to come in the long term. Demand for nuclear energy is set to triple from 2.5 mboe/d in 2024 to 7.5 mboe/d in 2050. Nuclear energy is expected to gain in prominence, as it is capable of providing a stable baseload supply of electricity. This will be increasingly necessary given the rising share of electricity supply from intermittent renewables. Hydropower and biomass will also increase over the outlook period, rising by 0.9 mboe/d and 1.6 mboe/d, respectively.
Natural gas is also gaining importance in China's energy mix. From around 6.7 mboe/d in 2024, natural gas demand is expected to increase to almost 10 mboe/d from 2040 onwards. Natural gas plays an important role in providing flexibility to the electricity grid, complementing the country's increase of other renewables. This growth is also expected to come from the transportation sector, which is seeing a rising number of LNG trucks.
Oil demand in China is expected to increase from 15.8 mboe/d in 2024 to 17.7 mboe/d in 2035, supported mainly by demand from industry (petrochemicals) and heavy transportation. However, in line with the rising share of electric vehicles in the country's passenger car fleet (more details in Chapter 3), oil demand is set to start declining slightly from 2035 onwards, reaching 17.1 mboe/d in 2050.
The primary energy demand outlook for India is shown in Table 2.6. Energy demand is expected to double over the outlook period, reaching 43.6 mboe/d in 2050. With an increase of 21.6 mboe/d, India is the single largest contributor to energy demand growth through 2050. The major drivers of this growth are population growth, an expanding middle class, and economic and industrial development.
Demand for all fuels is expected to increase in India. The largest increment is expected for oil, with demand rising from 5.5 mboe/d in 2024 to 13.6 mboe/d in 2050, an increase of around 8 mboe/d. This increase is supported by higher demand from the transportation and industrial sectors (mostly petrochemicals), and to a lesser extent, from the residential and commercial sector (e.g. LPG for cooking). Consequently, the share of oil in India's energy mix is expected to increase above 31% by 2050, up from 25.1% in 2024.

| Levels mboe/d | Growth mboe/d | Growth % p.a. | Fuel share % | |||||||
|---|---|---|---|---|---|---|---|---|---|---|
| 2024 | 2030 | 2035 | 2040 | 2045 | 2050 | 2024–2050 | 2024–2050 | 2024 | 2050 | |
| Oil | 5.5 | 7.3 | 8.8 | 10.4 | 12.0 | 13.6 | 8.0 | 3.5 | 25.1 | 31.1 |
| Coal | 10.1 | 11.7 | 12.6 | 13.1 | 13.2 | 12.9 | 2.8 | 1.0 | 45.8 | 29.6 |
| Gas | 1.2 | 1.7 | 2.3 | 3.0 | 3.9 | 3.8 | 5.6 | 5.6 | 11.6 | |
| Nuclear | 0.3 | 0.4 | 0.6 | 0.9 | 1.2 | 1.5 | 1.2 | 6.7 | 1.3 | 3.5 |
| Renewables | 4.9 | 5.9 | 6.9 | 7.9 | 9.1 | 10.5 | 5.6 | 3.0 | 22.3 | 24.2 |
| of which: Hydro | 0.3 | 0.4 | 0.5 | 0.6 | 0.7 | 0.8 | 0.5 | 3.6 | 1.5 | 1.9 |
| of which: Biomass | 4.1 | 4.4 | 4.5 | 4.5 | 4.4 | 4.3 | 0.2 | 0.2 | 18.8 | 9.9 |
| of which: Other renewables (mainly solar & wind) | 0.5 1.2 1.9 2.8 4.0 5.4 | 4.9 | 10.0 | 2.0 | 12.3 | |||||
| Total | 22.0 | 27.1 | 31.3 | 35.3 | 39.5 | 43.6 | 21.6 | 2.7 | 100.0 | 100.0 |
Table 2.6 India primary energy demand by fuel type, 2024–2050
Source: OPEC.
India's natural gas demand is set to increase from 1.2 mboe/d in 2024 to 5.1 mboe/d in 2050, in line with favourable energy policies related to natural gas in the country. Efforts to decarbonize power generation and foster the growth of intermittent renewables are the main drivers of this growth in demand. In addition, expected demand growth from the transportation sector is in line with the rising share of NGVs present across the country's road transportation fleet. Finally, expanding gasification in the major consuming regions supports consumption in the residential and commercial sector and helps to reduce the traditional use of biomass for cooking. Furthermore, the increase in natural gas demand is in line with efforts to increase domestic gas production in the medium and long term.
India is one of the few countries where coal demand is expected to grow significantly, increasing from 10.1 mboe/d in 2024 to 13.2 mboe/d in 2045. In line with its rising substitution by other fuels such as renewables, nuclear and gas, however, coal demand is ultimately expected to see a marginal decline in the period to 2050, eventually reaching 12.9 mboe/d. Due to significantly stronger growth of other fuels, the share of coal in the energy mix is expected to drop from almost 46% in 2024 to 29.6% in 2050.
Other renewables are projected to increase from 0.5 mboe/d in 2024 to 5.4 mboe/d in 2050, increasing from 2% in 2024 to reach 12.3% by the end of the outlook. The growth of other renewables is supported by the government's target to reach 500 GW of renewables capacity by 2030, up from just above 200 GW in 2024. Nuclear energy is set to rise from only 0.3 mboe/d in 2024 to 1.5 mboe/d in 2050. India currently has around 5.4 GW of nuclear capacity under construction, which will increase the country's current installed capacity by almost 80%. Hydropower demand is projected to increase from 0.3 mboe/d in 2024 to 0.8 mboe/d.
Biomass demand is projected to rise from 4.1 mboe/d in 2024 to 4.5 mboe/d in 2035, followed by a marginal decline to 4.3 mboe/d in 2050. This trend reflects rising demand for the advanced use of biomass, which will, however, increasingly be offset by a decline in traditional biomass use in the residential sector.
2.3 Energy demand by fuel
This section investigates energy demand trends by primary fuel, discusses energy policies and presents the Reference Case outlook to 2050.
2.3.1 Oil
Global oil demand experienced solid growth in 2024, increasing by 1.3 mboe/d compared to 2023 (when expressed on an energy content basis). This growth was primarily driven by the continued expansion of the petrochemical and aviation sectors, as well as sustained growth in road transportation and residential sectors in developing countries. The bulk of this expansion took place in developing countries across Asia, led by China, India and several other countries, mainly located in South-East Asia. OECD demand also increased last year, albeit at a much lower rate, demonstrating resilience despite widely publicized expectations of a decline.
Projections in this Outlook indicate similar, or even slightly accelerated, growth in global oil demand over the medium term to 2030. This is driven by a modest improvement in global economic growth during the period and a shifting policy focus in most regions, as underlined by recent developments in the US and Europe (more details provided in Chapter 1).
Changing priorities in these two regions are expected to have spillover effects for other regions, particularly developing countries. Energy and oil demand in developing areas continues to grow, driven by the need to support development, improve energy access and eliminate energy poverty. Over the longer term, however, this initial momentum is expected to gradually diminish. Deferred investments in the diversification of energy sources, including the electrification of transport through electric vehicles, are expected to return. At the same time, further technological progress and cost reductions will accelerate efficiency improvements and promote oil substitution, especially in favour of electricity and gas. As a result, oil demand growth will start decelerating and a divergence in OECD and non-OECD demand trajectories will become evident.
Indeed, as presented in Table 2.7, non-OECD oil demand is projected to increase by more than 26 mboe/d over the forecast period, moving from 55.2 mboe/d in 2024 to 81.3 mboe/d by 2050. This robust demand growth will be driven by population growth and urbanization, along with sustained economic growth that will enable greater car ownership and demand for both international and domestic travel. Moreover, economic development will support the expansion of commercial vehicle fleets, with a higher share of trucks, buses and agricultural machinery, most of which will run on oil products. Finally, strong demand for petrochemical products, a shift away from the traditional use of biomass to LPG and growing maritime trade will all also contribute to the continued demand growth in this region.
The largest part of this incremental demand will come from India, which is anticipated to add 8 mboe/d between 2024 and 2050, followed by Other Asia (+5 mboe/d), the Middle East (+4.4 mboe/d) and Africa (+4.1 mboe/d).
In the OECD, following a period of modest growth this decade, demand is anticipated to decline gradually, moving from more than 39.1 mboe/d in 2024 to 35.6 mboe/d by 2040 and 31.1 mboe/d by 2050. This represents an overall decline in demand of almost 8 mboe/d over the forecast period. After 2030, continued growth in demand in the non-OECD will stand in stark contrast to declining OECD demand; however, it is worth noting that non-OECD demand

growth will far outweigh any decline in the OECD. Indeed, this Outlook sees global oil demand reaching a level of 112.4 mboe/d in 2050, more than 18 mboe/d higher than the figure observed in 2024.
| Levels mboe/d | Growth mboe/d | Growth % p.a. | Share % | |||||||
|---|---|---|---|---|---|---|---|---|---|---|
| 2024 | 2030 | 2035 | 2040 | 2045 | 2050 | 2024–2050 | 2024–2050 | 2024 | 2050 | |
| OECD Americas | 20.5 | 20.9 | 20.7 | 19.7 | 18.6 | 17.7 | –2.8 | –0.6 | 21.7 | 15.7 |
| OECD Europe | 11.9 | 12.1 | 11.2 | 10.2 | 9.3 | 8.6 | –3.4 | –1.3 | 12.7 | 7.6 |
| OECD Asia-Pacific | 6.7 | 6.7 | 6.2 | 5.7 | 5.3 | 4.9 | –1.7 | –1.2 | 7.1 | 4.4 |
| OECD | 39.1 | 39.6 | 38.1 | 35.6 | 33.2 | 31.1 | –7.9 | –0.9 | 41.5 | 27.7 |
| China | 15.8 | 17.2 | 17.7 | 17.6 | 17.4 | 17.1 | 1.2 | 0.3 | 16.8 | 15.2 |
| India | 5.5 | 7.3 | 8.8 | 10.4 | 12.0 | 13.6 | 8.0 | 3.5 | 5.9 | 12.1 |
| Other Asia | 9.1 | 10.8 | 12.0 | 12.8 | 13.6 | 14.1 | 5.0 | 1.7 | 9.7 | 12.6 |
| Latin America | 6.4 | 7.5 | 8.2 | 8.7 | 9.0 | 9.2 | 2.8 | 1.4 | 6.8 | 8.2 |
| Middle East | 8.3 | 9.5 | 10.6 | 11.5 | 12.2 | 12.7 | 4.4 | 1.7 | 8.8 | 11.3 |
| Africa | 4.3 | 5.0 | 5.7 | 6.5 | 7.4 | 8.3 | 4.1 | 2.6 | 4.5 | 7.4 |
| Russia | 3.7 | 4.0 | 4.0 | 3.9 | 3.9 | 3.9 | 0.1 | 0.1 | 4.0 | 3.4 |
| Other Eurasia | 1.2 | 1.3 | 1.4 | 1.5 | 1.5 | 1.5 | 0.3 | 0.9 | 1.3 | 1.4 |
| Other Europe | 0.8 | 0.9 | 0.9 | 0.9 | 0.8 | 0.8 | 0.0 | 0.1 | 0.8 | 0.7 |
| Non-OECD | 55.2 | 63.4 | 69.2 | 73.9 | 77.8 | 81.3 | 26.1 | 1.5 | 58.5 | 72.3 |
| World | 94.3 103.0 | 107.4 | 109.5 | 111.0 | 112.4 | 18.2 | 0.7 | 100.0 | 100.0 |
Table 2.7 Oil demand by region, 2024–2050
Source: OPEC.
Further details about regional and sectoral trends in oil demand, as well as demand for specific refined products, are available in Chapter 3. However, it is important to note that the numbers presented in Chapter 3 are not directly comparable with those shown in this section. There are two main reasons for this. First, Chapter 2 uses energy equivalent units (mboe/d) to allow for a comparison between the different primary fuel types. In other chapters, however, oil is expressed in volumetric units of mb/d. Second, the definition of oil in Chapter 2 is different from that used in chapters 3 through 6. While Chapter 2 deals with primary energy sources, other chapters consider the outlook for all liquid fuels. In this sense, biofuels are considered biomass in this chapter, coal-to-liquids (CTLs) as coal and gas-to-liquids (GTLs) as gas, but they are all part of the liquids outlook in chapters 3 through 6.
2.3.2 Coal
In 2024, global coal demand reached a record high of around 81.8 mboe/d, supported by strong electricity demand in major developing economies, including China. This growth in coal use came despite ongoing efforts to reduce coal demand and cut CO2 emissions. In 2024, global coal-fired electricity generation reached a record high of 10,800 TWh, accounting for almost 35% of the generation mix. The future of coal largely depends on developments in

2
major developing economies, especially in China and India, but also in other countries in Other Asia. China and India alone account for almost 70% of global coal usage.
The importance of coal in China's power generation sector cannot be overstated. In 2024, coal-fired electricity generation in China was estimated at around 5,900 TWh, almost 55% of global coal-fired generation. In 2024, the country started construction on 94.5 GW of new coal-fired power plants and commissioned around 30 GW of new coal plants (Figure 2.5). Another 67 GW of coal-fired capacity have received permits, while only 2.5 GW were retired. This reflects China's commitment to securing its electricity supply and addressing shortages experienced in recent years. This will become even more important in the long term, amid the country's growing share of intermittent renewables in its power generation mix.
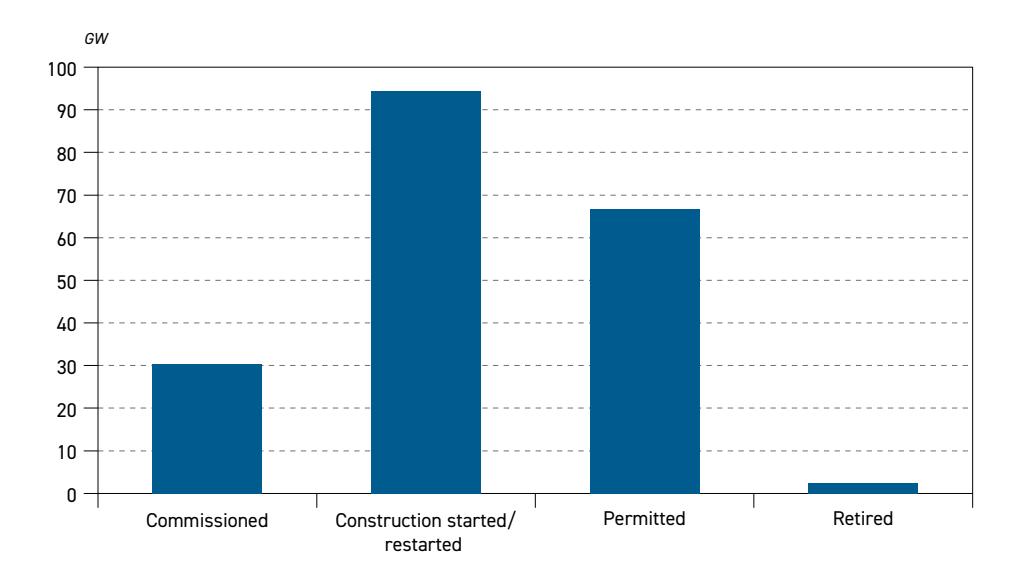
Figure 2.5 Coal-fired power generation capacity changes in China, 2024
Source: Centre for Research and Clean Air.
Behind China, India is the world's second-largest consumer of coal, using it mostly for power generation. Coal is a reliable and affordable fuel in India, but it is also a source of local pollution – a problem that the government will seek to solve in the future. Coal-fired generation in India reached around 1,200 TWh in 2024, accounting for around 75% of the country's generation mix.
Elsewhere, coal demand in the OECD region has been declining for some time already. This is due to a variety of reasons, including energy policies and/or substitution by other fuels such as renewables and natural gas. This trend continued in 2024. In the US, coal-fired electricity generation dropped by some 30 TWh, partly due to a higher penetration of other fuels, especially renewables. In OECD Europe, a similar trend was visible. Greater competition from renewable energy sources and nuclear energy led to a drop in coal-fired generation of around 50 TWh in 2024, y-o-y. With the policies currently in place, and despite many uncertainties, this trend is likely to continue in the future.

As shown in Table 2.8 and Figure 2.6, coal use will decline in most regions except for India and some other regions like Other Asia and Africa. This is expected to be offset by a decline in China and OECD countries, in line with stated climate-related policies. In the long term, global coal demand is expected to decline from 81.8 mboe/d in 2024 to 51.4 mboe/d in 2050, in line with policies targeting a reduction in local pollution and CO2 emissions. The substitution of coal through other energy sources, such as natural gas, nuclear and renewables, will also contribute to the decline in coal use. Finally, increasing transformation efficiency by introducing state-of-the-art coal power plants and retiring older, less inefficient plants will also contribute to reducing coal demand in the long term.
More than 80% of the global decrease in global coal demand in the period to 2050 is expected to occur in China. China's coal demand is set to decline from 46.2 mboe/d in 2024 to almost 22 mboe/d in 2050. This tremendous drop over the long term is in line with the country's efforts to achieve a peak in CO2 emissions in 2030 and reach carbon neutrality by 2060. A strong increase in wind and solar generation, as well as a significant expansion in the country's nuclear capacity, is expected to help reduce coal demand. However, uncertainties remain, largely stemming from the exceptional growth in electricity demand observed in recent years.
In contrast, coal demand in India is set to continue increasing amid strong power demand growth. Nevertheless, a significant slowdown in coal demand growth is expected moving forward. From around 10.1 mboe/d in 2024, coal demand in India is expected to peak at 13.2 mboe/d in 2045 before slightly declining to 12.9 mboe/d by 2050. This is due to the increasing substitution of coal by competing fuels, such as natural gas and renewables, which will gradually replace coal in the power mix. This will also help to address the issue of local pollution from old and inefficient coal-fired power plants in India.
In Other Asia, many countries are expanding their coal-fired capacity, albeit at a slower rate than China and India. This is partly a reaction to the recent energy crisis of 2022, when many of these countries were not able to afford LNG supplies. As a result, they partly turned to coal, thus prioritizing energy affordability and security of supply. From around 5.6 mboe/d in 2024, coal demand in this region will increase moderately to 6.3 mboe/d in 2050. However, longterm policy shifts promoting LNG, hydropower, and other renewables will gradually also curb both countries' reliance on coal.
Africa's coal demand is largely concentrated in South Africa, where coal still accounts for over 70% of the country's electricity generation. In the long term, coal demand is expected to increase marginally to 2.3 mboe/d in 2040 and remain steady at this level through 2050, as coal continues to provide affordability and energy security.
In the Middle East, coal plays a marginal role in the energy mix, largely due to the region's vast availability of alternatives like oil and gas. Coal demand is expected to remain at 0.1 mboe/d throughout the outlook period. Similarly, in Latin America, coal cannot compete against a variety of alternatives, including oil and gas, as well as hydropower. Coal demand is nevertheless set to inch up from 0.4 mboe/d in 2024 to 0.5 mboe/d in 2040 and remain stable at that level to 2050.
In Russia and Other Eurasia, as well as Other Europe, coal demand is projected to decline gradually, as old and inefficient coal power plants are taken offline. Coal will be substituted by other energy sources, especially natural gas, which is available in Eurasia at competitive costs. Coal demand in Russia and Other Eurasia is expected to decline by 1.2 mboe/d and
Table 2.8 Coal demand by region, 2024–2050
| Levels mboe/d | Growth mboe/d | Growth % p.a. | Share % | |||||||
|---|---|---|---|---|---|---|---|---|---|---|
| 2024 | 2030 | 2035 | 2040 | 2045 | 2050 | 2024–2050 | 2024–2050 | 2024 | 2050 | |
| OECD Americas | 5.1 | 4.2 | 3.3 | 2.5 | 1.9 | 1.4 | –3.7 | –4.9 | 6.2 | 2.6 |
| OECD Europe | 3.5 | 2.5 | 1.8 | 1.2 | 0.9 | 0.7 | –2.8 | –6.0 | 4.2 | 1.3 |
| OECD Asia-Pacific | 4.1 | 3.7 | 3.4 | 3.2 | 3.0 | 2.8 | –1.3 | –1.5 | 5.0 | 5.4 |
| OECD | 12.6 | 10.4 | 8.5 | 7.0 | 5.8 | 4.9 | –7.8 | –3.6 | 15.4 | 9.4 |
| China | 46.8 | 43.2 | 38.1 | 32.5 | 27.1 | 22.1 | –24.8 | –2.9 | 57.3 | 43.0 |
| India | 10.1 | 11.7 | 12.6 | 13.1 | 13.2 | 12.9 | 2.8 | 1.0 | 12.3 | 25.1 |
| Other Asia | 5.6 | 5.9 | 6.2 | 6.3 | 6.4 | 6.3 | 0.7 | 0.5 | 6.8 | 12.3 |
| Latin America | 0.4 | 0.4 | 0.4 | 0.5 | 0.5 | 0.5 | 0.1 | 0.7 | 0.5 | 0.9 |
| Middle East | 0.1 | 0.1 | 0.1 | 0.1 | 0.1 | 0.1 | 0.0 | 0.7 | 0.1 | 0.2 |
| Africa | 2.1 | 2.2 | 2.2 | 2.3 | 2.3 | 2.3 | 0.1 | 0.2 | 2.6 | 4.4 |
| Russia | 2.7 | 2.4 | 2.2 | 1.9 | 1.7 | 1.5 | –1.2 | –2.2 | 3.2 | 2.9 |
| Other Eurasia | 1.0 | 1.0 | 0.9 | 0.9 | 0.9 | 0.8 | –0.2 | –0.7 | 1.2 | 1.6 |
| Other Europe | 0.4 | 0.3 | 0.2 | 0.2 | 0.1 | 0.1 | –0.3 | –5.8 | 0.5 | 0.2 |
| Non-OECD | 69.2 | 67.1 | 63.0 | 57.8 | 52.2 | 46.5 | –22.7 | –1.5 | 84.6 | 90.6 |
| World | 81.8 | 77.5 | 71.5 | 64.8 | 58.0 | 51.4 | –30.4 | –1.8 | 100.0 | 100.0 |
Source: OPEC.
Figure 2.6 Coal demand by major region, 2024–2050
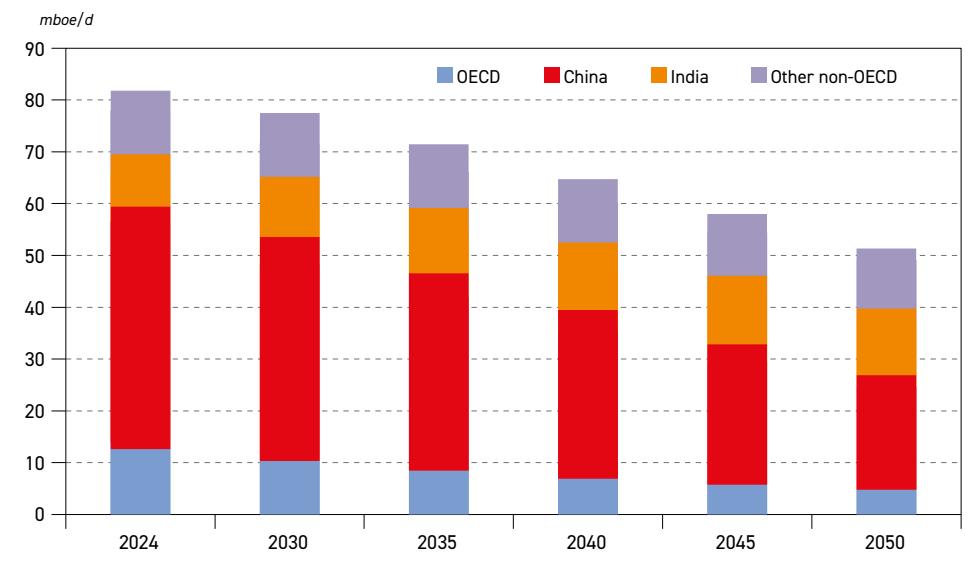
Source: OPEC.
0.2 mboe/d, respectively. In Other Europe, coal demand (to a large extent lignite) will be gradually replaced by rising supplies of alternatives, such as other renewables and gas. Coal demand will fall to around 0.1 mboe/d in 2050, down from 0.4 mboe/d in 2024.
In the OECD, coal demand is expected to decline from 12.6 mboe/d in 2024 to 4.9 mboe/d in 2050, with significant contributions in all sub-regions. In OECD Americas, coal demand is projected to drop from 5.1 mboe/d in 2024 to 1.4 mboe/d in 2050. This is largely due to rising competition from natural gas, renewables, as well as nuclear. Furthermore, many coal-fired power plants will be taken off the grid as they approach the end of their lifetime.
In OECD Europe, coal demand is expected to decline from 3.5 mboe/d in 2024 to 0.7 mboe/d in 2050. Many European countries remain committed to decommissioning their coal plants and increasing their electricity supply from renewables, nuclear and natural gas. However, given the region's increased focus on energy security, there are potential upsides to this outlook, similar to developments during the energy crisis of 2022.
In OECD Asia-Pacific, coal demand is expected to drop to 2.8 mboe/d in 2050, down from 4.1 mboe/d in 2024. The restarting of nuclear plants and expansion of the nuclear sector in Japan are key drivers underpinning this trend. Other countries in the region are expected to decommission their coal plants, in line with strict regulations related to pollution and CO2 emissions.
2.3.3 Natural gas
Following the market turbulence caused by the conflict in Eastern Europe, global natural gas demand rose to an all-time high in 2024. The main drivers for this trend were industrial expansion and growing electricity consumption in non-OECD Asia, the Middle East and OECD Americas (mostly the US). Market participants increasingly see natural gas as an integral component of future energy systems, due to its lower carbon footprint, availability and flexibility. The latter means that natural gas power plants are well-suited to compensate for the increasing share of intermittent renewables in power generation systems. This importance will become even greater over time, given the anticipated retirement of numerous coal-fired power plants, which – albeit to a lesser extent – have helped to balance the variability of wind and solar generation. In the US, strong electricity demand growth from data centres is expected to boost natural gas demand for power generation.
On the supply side, many consumer countries were exposed to natural gas shortages and high LNG prices during the energy crisis of 2022, prompting concerns related to security of supply. In response, some countries expanded their deployment of renewables while also increasing coal consumption in the short term, thus limiting growth in natural gas demand. In the meantime, prices have stabilized, helping consumers regain confidence in the international gas market. Furthermore, a large number of new LNG liquefaction capacities are expected to come online from next year onwards, mostly in North America and Qatar, alongside new additions in Africa and Russia. This could create a buyer's market and consequently support further demand growth in the medium and long term.
Table 2.9 and Figure 2.7 show the outlook for natural gas demand in the long term. Global gas demand is expected to increase from 70 mboe/d in 2024 to 89.7 mboe/d in 2050, growth of almost 20 mboe/d. Natural gas will increase its share in the primary energy mix from 22.7% to 23.7%. Already in 2035, natural gas will replace coal as the second largest fuel in the primary

energy mix. There are two distinctive regional trends in the long term. Growth will come from developing countries (i.e. the non-OECD region, excluding Russia), which will see growth of more than 21 mboe/d. Mature markets, including OECD countries and Eurasia, are expected to see marginal growth, stagnation, or a moderate decline in gas usage in the long term.
Table 2.9 Natural gas demand by region, 2024–2050
| Levels mboe/d | Growth mboe/d | Growth % p.a. | Share % | |||||||
|---|---|---|---|---|---|---|---|---|---|---|
| 2024 | 2030 | 2035 | 2040 | 2045 | 2050 | 2024–2050 2024–2050 | 2024 | 2050 | ||
| OECD Americas | 18.7 | 19.0 | 19.1 | 19.1 | 19.1 | 19.1 | 0.4 | 0.1 | 26.7 | 21.3 |
| OECD Europe | 7.9 | 7.8 | 7.4 | 7.0 | 6.5 | 6.1 | –1.7 | –1.0 | 11.3 | 6.8 |
| OECD Asia-Pacific | 3.6 | 3.6 | 3.7 | 3.7 | 3.8 | 3.8 | 0.2 | 0.2 | 5.2 | 4.3 |
| OECD | 30.2 | 30.4 | 30.1 | 29.8 | 29.4 | 29.0 | –1.2 | –0.2 | 43.2 | 32.4 |
| China | 6.7 | 8.1 | 9.1 | 9.8 | 10.1 | 9.9 | 3.3 | 1.6 | 9.5 | 11.1 |
| India | 1.2 | 1.7 | 2.3 | 3.0 | 3.9 | 5.1 | 3.8 | 5.6 | 1.8 | 5.7 |
| Other Asia | 4.7 | 5.8 | 6.7 | 7.4 | 8.0 | 8.2 | 3.5 | 2.1 | 6.8 | 9.1 |
| Latin America | 2.6 | 3.1 | 3.5 | 4.1 | 4.6 | 5.1 | 2.5 | 2.6 | 3.7 | 5.7 |
| Middle East | 10.3 | 12.1 | 13.3 | 14.1 | 14.5 | 14.7 | 4.4 | 1.4 | 14.8 | 16.4 |
| Africa | 3.1 | 3.8 | 4.6 | 5.3 | 6.0 | 6.7 | 3.6 | 3.0 | 4.4 | 7.4 |
| Russia | 8.2 | 7.9 | 7.6 | 7.4 | 7.1 | 6.9 | –1.2 | –0.6 | 11.7 | 7.7 |
| Other Eurasia | 1.7 | 1.9 | 2.0 | 2.1 | 2.2 | 2.3 | 0.6 | 1.2 | 2.5 | 2.6 |
| Other Europe | 1.3 | 1.4 | 1.5 | 1.6 | 1.7 | 1.7 | 0.5 | 1.2 | 1.8 | 1.9 |
| Non-OECD | 39.8 | 45.8 | 50.6 | 54.8 | 58.2 | 60.7 | 20.9 | 1.6 | 56.8 | 67.6 |
| World | 70.0 | 76.1 | 80.7 | 84.6 | 87.6 | 89.7 | 19.7 | 1.0 | 100.0 | 100.0 |
Source: OPEC.
Figure 2.7
Natural gas demand by major region, 2024–2050
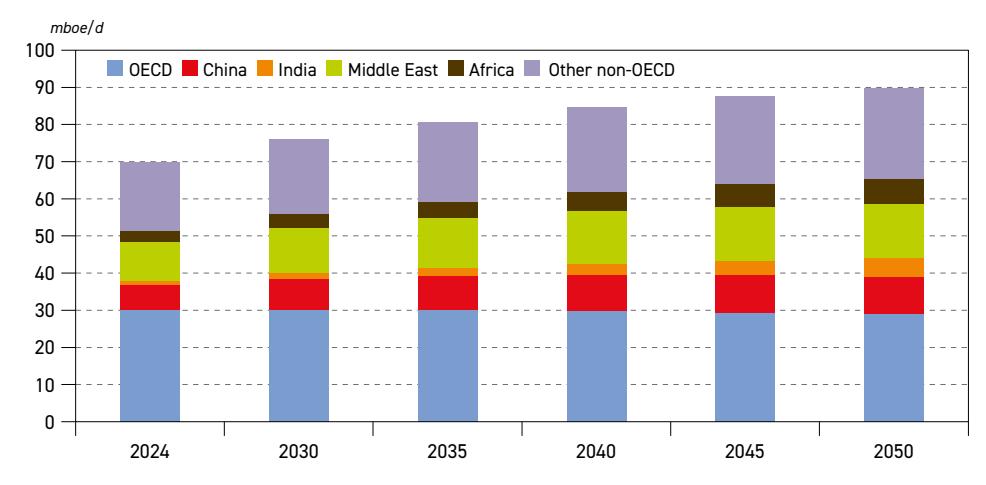
Source: OPEC.

The largest increase in natural gas demand is expected in the Middle East, rising by 4.4 mboe/d between 2024 and 2050. Many countries in the region are expected to see a strong increase in electricity generation, which will be partly met by natural gas. Industrial demand growth, including from the petrochemical sector, represents another important driver. In addition, vast natural gas resources – available at competitive prices – will further support its use and long-term growth. Many states, including OPEC Member Countries, have announced targets to increase their production of natural gas, including Saudi Arabia, IR Iran, the UAE and Iraq. Rising gas production would also facilitate a reduction in the use of crude oil and oil products for power generation.
Elsewhere, India's natural gas demand is expected to quadruple from 1.2 mboe/d in 2024 to just above 5 mboe/d in 2050. Higher usage of natural gas is in line with the country's efforts to reduce local pollution from coal-fired plants and support the growth of renewables. Rising levels of gasification across the country will support increased gas demand in the residential and commercial sector and simultaneously reduce the traditional use of biomass for cooking. Official support for natural gas vehicles will also contribute to growth. In addition, India is seeking to increase domestic gas production, which would further support this anticipated growth in demand.
Natural gas demand in China is set to rise by around 3.3 mboe/d to almost 10 mboe/d in 2050. Higher gas use is driven by rising electricity demand, the substitution of coal across all demand sectors and the rise of intermittent renewables in the power mix. The latter can be effectively balanced by the high flexibility of gas-fired power generation, and the rapid expansion of intermittent renewables in China will increasingly require natural gas power plants to provide balancing and backup services. Another important demand driver is LNG trucking, with demand for natural gas from this sector rising as well.
Other Asia is another important demand centre, with gas usage increasing from 4.7 mboe/d in 2024 to 8.2 mboe/d in 2050. Like in China and India, electricity demand and the replacement of coal are the main drivers behind this growth. However, it is important to note that many countries in the region are price sensitive and are likely to reduce their gas (LNG) imports at times of elevated prices, as seen in 2022.
In Africa, gas demand is set to more than double from 3.1 mboe/d in 2024 to 6.7 mboe/d in 2050. Population growth, in combination with rising urbanization and increasing energy access, are the major drivers. This growth will also result in a reduction in traditional biomass use, especially in Sub-Saharan Africa, while rising electricity demand will require additional gas volumes. Gas resources are available in Africa and many countries, including OPEC Member Countries, have targets to increase gas usage in the long term. For instance, Nigeria has declared 2021 to 2030 as the 'Decade of Gas', seeking to utilize its gas resources while also reducing gas flaring.
In Latin America, natural gas demand is projected to double over the outlook period, reaching 5.1 mboe/d in 2050. Rising demand from power generation and industry represent the major contributors to this growth.
In Russia, gas demand is expected to sink by some 1.2 mboe/d over the outlook period and reach 6.9 mboe/d in 2050. This is due to a declining population and mature economy. Rising energy efficiency is also expected to save natural gas and reduce demand. At the same time, gas demand in Other Eurasia is set to increase from 1.7 mboe/d in 2024 to
2.3 mboe/d in 2050, supported by economic growth and locally available natural gas supplies.
In Other Europe, natural gas supply is set to increase from 1.3 mboe/d in 2024 to 1.7 mboe/d in 2050, in line with rising electricity demand and a declining share of coal in the power generation mix. Some support will come from the industrial sector switching to natural gas as well.
Gas demand growth in the OECD is expected to be negative between 2024 and 2050, due to an expected drop in OECD Europe, partly offset by a marginal increase in OECD Americas and OECD Asia-Pacific. Gas demand in OECD Europe is set to decline from 7.9 mboe/d in 2024 to 6.1 mboe/d in 2050, which is in line with the official policy of European countries to reduce their reliance on gas. Europe aims to substitute gas using other fuels, such as renewables, nuclear power, and renewable gases like biomethane. Increased electrification in the residential and industrial sectors across many countries of the region will also help to drive this shift. Nevertheless, natural gas will remain a crucial component of energy systems in OECD Europe, especially in power generation.
Gas demand in OECD Americas is likely to increase modestly over the outlook period, reaching 19.1 mboe/d in 2050. However, this year's outlook is slightly more optimistic than last year's, due to a strong increase in electricity demand, especially from data centers amid the rise of AI. As in China, the rising supply of intermittent renewables will require support from gasfired generation, thus supporting gas usage. Moreover, the new US Administration is also generally more supportive of natural gas, which could lend additional support for natural gas demand, especially in the medium term.
In OECD Asia-Pacific, gas demand is set to inch up from 3.6 mboe/d in 2024 to 3.8 mboe/d in 2050, supported by rising electricity demand and declining coal usage.
2.3.4 Nuclear
Following a period of stagnation and temporary declines, nuclear power generation experienced steady growth for the second consecutive year, reaching an all-time high in 2024 above 2800 TWh (Figure 2.8). This growth was driven by new projects in Asia and the Middle East, as well as the recovery of nuclear power supply in Europe. The year saw the addition of new capacity in the UAE (Barakah Unit 4, with 1.4 GW), China (Fengchenggang Unit 4, with 1.2 GW, and Zhangzhou Unit 1, with 1.1 GW), the US (Vogtle Unit 4, with 1.1 GW), France (Flamanville, with 1.6 GW) and India (Kakrapar Unit 4, with 0.7 GW).
In the short and medium term, the expansion of nuclear capacity will continue steadily, with the 62 reactors currently under construction having a total capacity of almost 65 GW. Nearly half this capacity, around 30 GW, is in China. Significant additions are also expected in several other countries, including in the Middle East, Asia-Pacific, Europe and Latin America.
A significant share of the new nuclear capacity that is currently under construction is likely to replace aging reactors nearing retirement. Many large reactors built in the 1970s and 1980s are likely approaching the end of their operational lifespans. For example, more than 130 GW of nuclear capacity is already more than 40 years old. In some cases, subject to investments, operators can extend the lifetime of their plants by 20, or even 40 years. However, some of these units will have to be retired over the outlook period.

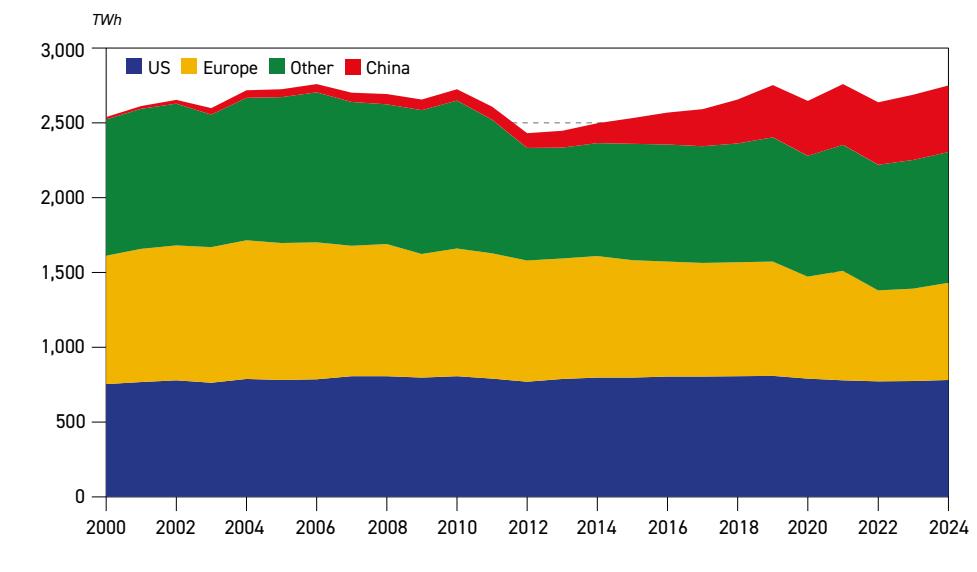
Figure 2.8 Nuclear generation by major region
Source: Ember.
Nevertheless, the long-term prospects for nuclear energy remain optimistic. In recent months, nuclear power has attracted renewed interest from governments given its potential to enhance supply security in an expanding electricity market. Furthermore, nuclear power plants can provide stability to electricity grids, thereby complementing the deployment of intermittent renewables. Increased electricity demand from data centers and AI has led
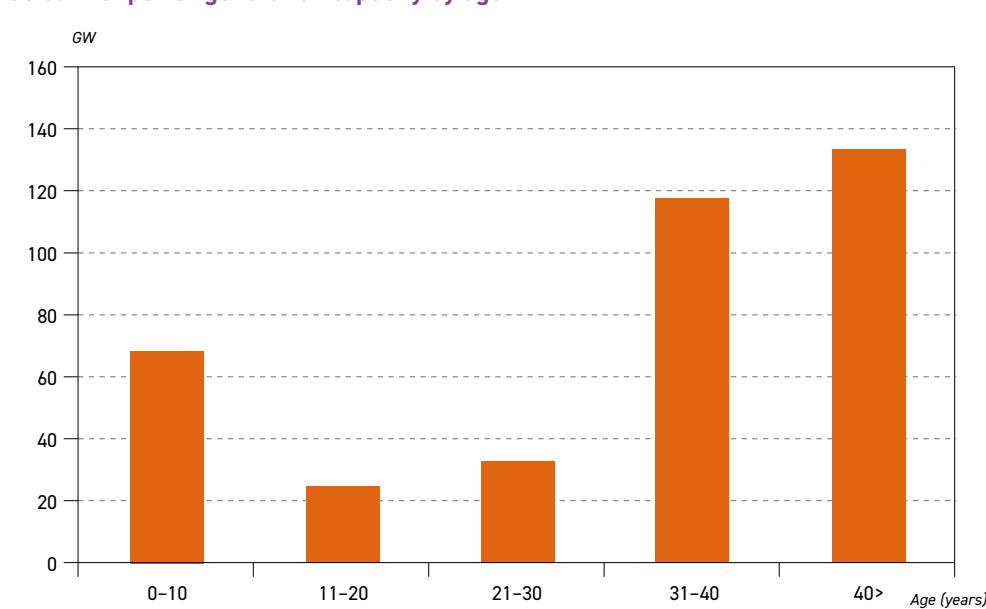
Figure 2.9 Nuclear net power generation capacity by age
Source: IAEA.

to rising interest from US tech giants in nuclear energy, given its stability and low carbon footprint. Overall, 31 countries, 14 major global banks and 140 nuclear industry companies, as well as major technological companies like Google, Meta and Amazon, endorsed a pledge at COP28 to triple global nuclear energy use by 2050.
The enthusiasm surrounding nuclear energy could speed up investments in nuclear power plants in the medium and long term, including so-called SMRs. Several companies are already developing SMRs, with the first commercial units expected in the early 2030s. Together, these factors contribute to an optimistic long-term outlook for nuclear energy in the Reference Case, including both the expansion of nuclear capacity and the lifetime extension of existing plants.
Table 2.10 and Figure 2.10 show long-term projections for nuclear demand. On a global level, nuclear energy is set to increase from 14.9 mboe/d in 2024 to almost 25 mboe/d in 2050. Around 75% of this increment will materialize in the non-OECD, mainly in China. The country is expected to triple its nuclear demand from 2.5 mboe/d in 2024 to 7.5 mboe/d in 2050, driven by strong electricity demand growth and an increased focus on energy security. China is also developing SMRs, which may help this expansion in the long term.
In India, demand for nuclear power is expected to increase fivefold over the outlook period, rising from 0.3 mboe/d in 2024 to 1.5 mboe/d in 2050. The country is targeting 100 GW of nuclear capacity by 2047, including a fast breeder reactor (FBR) programme and thorium-based nuclear initiatives, which could play a crucial role in shaping India's long-term nuclear energy plan.
| Levels mboe/d | Growth mboe/d | Growth % p.a. | Share % | |||||||
|---|---|---|---|---|---|---|---|---|---|---|
| 2024 | 2030 | 2035 | 2040 | 2045 | 2050 | 2024–2050 | 2024–2050 | 2024 | 2050 | |
| OECD Americas | 4.7 | 4.8 | 4.9 | 5.0 | 5.2 | 5.4 | 0.6 | 0.5 | 31.7 | 21.5 |
| OECD Europe | 3.7 | 3.6 | 3.7 | 3.8 | 3.9 | 4.1 | 0.4 | 0.4 | 24.8 | 16.3 |
| OECD Asia-Pacific | 1.3 | 1.7 | 2.0 | 2.2 | 2.4 | 2.5 | 1.1 | 2.4 | 9.0 | 9.9 |
| OECD | 9.8 | 10.2 | 10.6 | 11.0 | 11.5 | 11.9 | 2.1 | 0.8 | 65.5 | 47.8 |
| China | 2.5 | 3.6 | 4.6 | 5.6 | 6.6 | 7.5 | 5.0 | 4.3 | 16.9 | 30.1 |
| India | 0.3 | 0.4 | 0.6 | 0.9 | 1.2 | 1.5 | 1.2 | 6.7 | 1.9 | 6.1 |
| Other Asia | 0.3 | 0.3 | 0.3 | 0.3 | 0.4 | 0.4 | 0.1 | 1.2 | 1.8 | 1.5 |
| Latin America | 0.1 | 0.1 | 0.2 | 0.2 | 0.2 | 0.2 | 0.1 | 1.9 | 0.8 | 0.8 |
| Middle East | 0.2 | 0.3 | 0.4 | 0.5 | 0.6 | 0.7 | 0.5 | 5.3 | 1.2 | 2.6 |
| Africa | 0.1 | 0.1 | 0.1 | 0.1 | 0.1 | 0.1 | 0.0 | 1.3 | 0.4 | 0.3 |
| Russia | 1.2 | 1.3 | 1.3 | 1.5 | 1.6 | 1.7 | 0.5 | 1.4 | 7.9 | 6.9 |
| Other Eurasia | 0.4 | 0.4 | 0.5 | 0.6 | 0.6 | 0.7 | 0.3 | 2.2 | 2.6 | 2.8 |
| Other Europe | 0.1 | 0.2 | 0.2 | 0.2 | 0.2 | 0.3 | 0.1 | 2.2 | 1.0 | 1.1 |
| Non-OECD | 5.2 | 6.7 | 8.2 | 9.8 | 11.5 | 13.0 | 7.8 | 3.6 | 34.5 | 52.2 |
| World | 14.9 | 16.9 | 18.8 | 20.8 | 22.9 | 24.9 | 10.0 | 2.0 | 100.0 | 100.0 |
Table 2.10 Nuclear energy demand by region, 2024–2050
Source: OPEC.

Figure 2.10
Nuclear energy demand by region, 2024–2050
Nuclear capacity expansion in the Middle East is expected to continue in the medium and long term too. Total nuclear demand is set to increase from 0.2 mboe/d in 2024 to 0.7 mboe/d in 2050, supported by strong electricity demand growth and efforts to diversify electricity generation in the energy mix. The UAE has already launched its nuclear programme, while Saudi Arabia is advancing plans to develop its first commercial nuclear reactor as part of a broader strategy to diversify its energy mix. In addition to large-scale reactors, Saudi Arabia is exploring SMRs for desalination and industrial applications, positioning itself as a key player in the region's nuclear development.
Limited expansion is expected in Other Asia, with countries such as Pakistan and Bangladesh commencing the construction of nuclear units. Nuclear demand in this region is set to increase from 0.3 mboe/d in 2024 to 0.4 mboe/d in 2050. Minor expansions are also expected in Africa and Latin America in the outlook period.
Russia and Other Eurasia are projected to see a nuclear demand increase of 0.5 mboe/d and 0.3 mboe/d, respectively. Russia's nuclear demand increase is supported by the country's continued investment in domestic reactors and international nuclear exports. Russia remains a leading provider of reactor construction services, nuclear fuel supply and operational expertise to several countries.
In the OECD, nuclear demand is projected to increase by 2.1 mboe/d. The largest increase is expected in OECD Asia-Pacific (+1.1 mboe/d), in line with expected restarts of nuclear power plants in Japan and further expansion in the long term. In South Korea, three new nuclear reactors are foreseen by 2038, which would push the country's share of nuclear power in the generation mix to 35.2%.
Several countries in OECD Europe are keen to expand their nuclear fleet, such as France, the UK and Slovakia. Türkiye currently has 4.5 GW of nuclear capacity under construction. In addition, Poland and Italy are increasingly considering the possibility of building nuclear power plants, which would reduce the share of coal in their power generation mixes. In the US, nuclear power has attracted interest from large technology companies like Google, Microsoft and OpenAI, which increasingly need a low carbon and stable power supply for their data centers and AI development plans. Microsoft has already signed a contract to reactivate a reactor at Three Mile Island nuclear power plant, while other companies have shown interest in investing in SMR technology. Nuclear demand in OECD Americas is expected to increase from 4.7 mboe/d in 2024 to 5.4 mboe/d in 2050, which includes the replacement of aging nuclear units.
Despite its resurgence, the nuclear industry could face specific long-term challenges. High upfront capital costs and often lengthy construction timelines could delay progress and nuclear capacity expansion. Public perception and regulatory barriers also represent significant obstacles, particularly in regions where nuclear energy has faced public resistance.
2.3.5 Hydro
Hydropower is a key component of the global energy mix, playing a significant role in power generation across many countries. Hydropower's flexibility and storage capabilities have become increasingly valuable for grid stability, complementing the expansion of other renewables such as solar and wind in electricity generation. Developed countries have already exploited most of their resources in recent decades. Furthermore, geographical constraints and public resistance to large-scale hydropower plants are limiting new projects and shifting the focus towards modernizing existing plants and increasing their efficiency. As a result, major expansions today are taking place in developing regions, a trend that is expected to continue over the medium and long term. Despite its advantages, hydropower could face significant challenges in the future. Climate variability and water availability remain major concerns, as seen in recent years, with droughts and shifting precipitation patterns affecting hydropower generation in many regions.
The Reference Case expects hydropower demand to rise from 7.8 mboe/d in 2023 to 11.6 mboe/d in 2050, as shown in Table 2.11 and Figure 2.11. This represents an increase of 3.8 mboe/d, of which 3.4 mboe/d will materialize in the non-OECD. The single largest contribution to this growth comes from China, with hydropower demand increasing 0.9 mboe/d over the outlook period. China has recently approved the construction of the world's largest dam along the Yarlung Tsangpo River in Tibet. The project, once commissioned, could generate three times more power than the Three Gorges Dam, which is the largest hydropower plant currently in existence.
Hydropower is likely to expand in India (+0.5 mboe/d), Other Asia (+0.6 mboe/d), Latin America (+0.8 mboe/d) and Africa (+0.4 mboe/d), driven by strong growth in electricity demand and the availability of large, untapped hydropower resources. For instance, India has the potential for almost 150 GW of hydropower capacity, with only one-third constructed to date.
In OECD Americas, hydropower demand is set to increase by 0.2 mboe/d to 1.6 mboe/d throughout the outlook period. In OECD Europe, expanding hydropower is limited by the fact that available resources have been utilized to date already. Total hydropower demand in this region is anticipated to reach 1 mboe/d in 2050, inching up by 0.1 mboe/d from 2024.

Table 2.11 Hydropower energy demand by region, 2024–2050
| Levels mboe/d | Growth mboe/d | Growth Share % p.a. % | ||||||||
|---|---|---|---|---|---|---|---|---|---|---|
| 2024 | 2030 | 2035 | 2040 | 2045 | 2050 | 2024–2050 2024–2050 | 2024 | 2050 | ||
| OECD Americas | 1.4 | 1.4 | 1.5 | 1.5 | 1.6 | 1.6 | 0.2 | 0.6 | 17.6 | 13.9 |
| OECD Europe | 0.9 | 0.9 | 0.9 | 1.0 | 1.0 | 1.0 | 0.1 | 0.6 | 11.2 | 8.8 |
| OECD Asia-Pacific | 0.2 | 0.2 | 0.2 | 0.2 | 0.2 | 0.2 | 0.0 | 0.5 | 2.8 | 2.2 |
| OECD | 2.5 | 2.6 | 2.6 | 2.7 | 2.8 | 2.9 | 0.4 | 0.6 | 31.6 | 24.8 |
| China | 2.3 | 2.6 | 2.8 | 2.9 | 3.1 | 3.3 | 0.9 | 1.3 | 30.2 | 28.1 |
| India | 0.3 | 0.4 | 0.5 | 0.6 | 0.7 | 0.8 | 0.5 | 3.6 | 4.2 | 7.0 |
| Other Asia | 0.6 | 0.7 | 0.8 | 0.9 | 1.0 | 1.2 | 0.6 | 2.7 | 7.4 | 10.0 |
| Latin America | 1.2 | 1.3 | 1.5 | 1.6 | 1.8 | 2.0 | 0.8 | 2.0 | 15.1 | 16.9 |
| Middle East | 0.0 | 0.0 | 0.0 | 0.0 | 0.0 | 0.0 | 0.0 | 1.0 | 0.4 | 0.3 |
| Africa | 0.3 | 0.4 | 0.5 | 0.5 | 0.6 | 0.7 | 0.4 | 3.4 | 3.9 | 6.2 |
| Russia | 0.3 | 0.4 | 0.4 | 0.4 | 0.4 | 0.5 | 0.1 | 1.1 | 4.5 | 4.0 |
| Other Eurasia | 0.1 | 0.1 | 0.1 | 0.1 | 0.2 | 0.2 | 0.1 | 1.5 | 1.5 | 1.5 |
| Other Europe | 0.1 | 0.1 | 0.1 | 0.1 | 0.1 | 0.1 | 0.0 | 1.5 | 1.2 | 1.2 |
| Non-OECD | 5.3 | 6.0 | 6.6 | 7.2 | 7.9 | 8.7 | 3.4 | 1.9 | 68.4 | 75.2 |
| World | 7.8 | 8.6 | 9.3 | 9.9 | 10.7 | 11.6 | 3.8 | 1.6 | 100.0 | 100.0 |
Source: OPEC.
Figure 2.11 Hydropower energy demand by region, 2024–2050
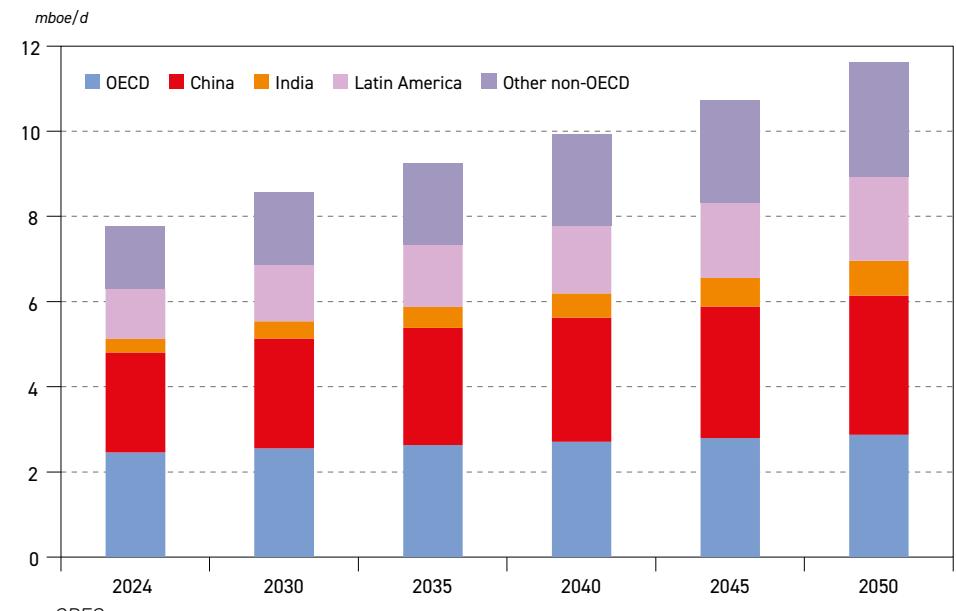
Source: OPEC.

2.3.6 Biomass
Biomass remains an important energy source in many regions in two important ways. In developed countries, most demand is attributed to the advanced use of biomass for the production of biofuels, biogas, heat and electricity. In many developing countries, biomass is still used in a traditional way for cooking and heating purposes and, as such, is a leading cause of premature deaths due to indoor pollution.
Moving forward, the advanced use of biomass in developed and developing countries is expected to increase. Biofuel mandates are set to expand, particularly in aviation and road transportation, driven by SAF regulations in Europe and North America. At the same time, in line with rising access to modern energy services, the traditional use of biomass is likely to decline, especially in Sub-Saharan Africa and developing countries in Asia.
Supported by energy policies, global biomass demand is set to increase from 29 mboe/d in 2024 to 36.6 mboe/d in 2050, with its share in the primary energy mix inching up from 9.4% to 9.7% over the outlook period. Biomass use is expected to grow in all regions, with an average growth rate of 0.8% p.a. Although this growth is significant, the limited availability of biomass represents a potential challenge. This is associated with competition for arable land between food and biomass production. Additionally, challenges related to biomass and/ or waste collection often make the overall process more expensive and less competitive compared to traditional fuels.
Figure 2.12 shows the outlook for biomass demand and its regional distribution. Biomass demand in the OECD is expected to increase from 7.2 mboe/d in 2024 to 10 mboe/d in 2050, an increment of 2.8 mboe/d. The largest share is attributed to OECD Europe (+1.6 mboe/d),
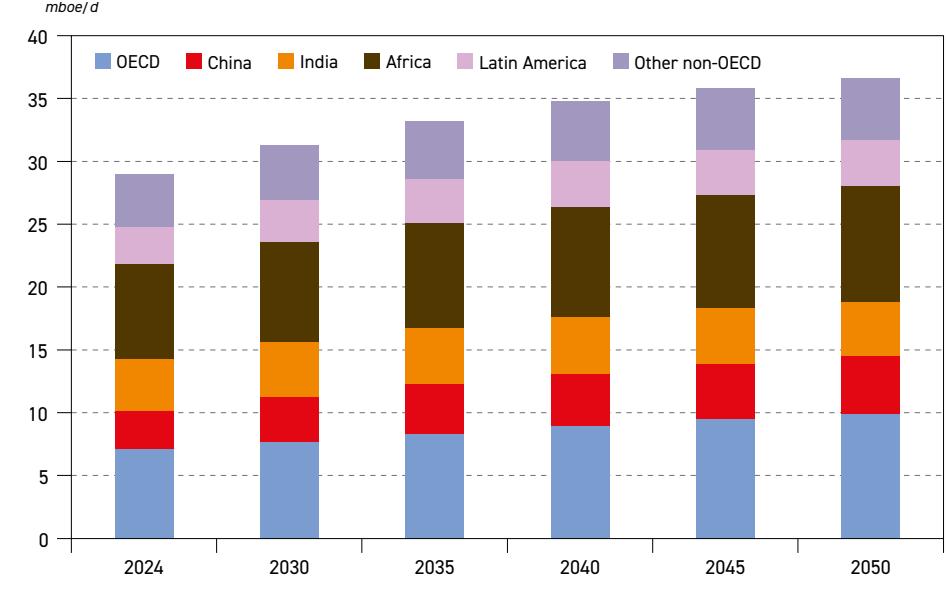
Figure 2.12 Biomass energy demand by region, 2024–2050
Source: OPEC.

supported by ambitious regulations related to biofuels in the road transportation and aviation sectors. Furthermore, many countries in the region have increased their production of biomethane, partly as a strategy to reduce the consumption of natural gas.
| Levels mboe/d | Growth mboe/d | Growth % p.a. | Share % | |||||||
| 2024 | 2030 | 2035 | 2040 | 2045 | 2050 | 2024–2050 | 2024–2050 | 2024 | 2050 | |
| OECD Americas | 2.9 | 3.1 | 3.3 | 3.5 | 3.7 | 3.9 | 1.0 | 1.1 | 10.0 | 10.6 |
| OECD Europe | 3.6 | 4.0 | 4.3 | 4.7 | 5.0 | 5.3 | 1.6 | 1.4 | 12.6 | 14.4 |
| OECD Asia-Pacific | 0.6 | 0.7 | 0.7 | 0.8 | 0.8 | 0.8 | 0.2 | 1.0 | 2.1 | 2.2 |
| OECD | 7.2 | 7.7 | 8.3 | 8.9 | 9.5 | 10.0 | 2.8 | 1.3 | 24.7 | 27.2 |
| China | 3.0 | 3.5 | 4.0 | 4.2 | 4.4 | 4.6 | 1.6 | 1.6 | 10.4 | 12.4 |
| India | 4.1 | 4.4 | 4.5 | 4.5 | 4.4 | 4.3 | 0.2 | 0.2 | 14.3 | 11.8 |
| Other Asia | 3.5 | 3.6 | 3.7 | 3.8 | 3.8 | 3.8 | 0.3 | 0.4 | 11.9 | 10.3 |
| Latin America | 3.0 | 3.3 | 3.5 | 3.6 | 3.6 | 3.6 | 0.6 | 0.7 | 10.3 | 9.9 |
| Middle East | 0.0 | 0.0 | 0.0 | 0.0 | 0.0 | 0.0 | 0.0 | 2.0 | 0.1 | 0.1 |
| Africa | 7.5 | 8.0 | 8.4 | 8.8 | 9.0 | 9.2 | 1.7 | 0.8 | 26.0 | 25.2 |
| Russia | 0.2 | 0.3 | 0.3 | 0.3 | 0.4 | 0.4 | 0.2 | 2.2 | 0.8 | 1.1 |
| Other Eurasia | 0.1 | 0.1 | 0.1 | 0.1 | 0.2 | 0.2 | 0.1 | 1.6 | 0.4 | 0.5 |
| Other Europe | 0.3 | 0.4 | 0.4 | 0.4 | 0.5 | 0.5 | 0.2 | 1.9 | 1.1 | 1.5 |
| Non-OECD | 21.8 | 23.6 | 24.9 | 25.9 | 26.3 | 26.7 | 4.9 | 0.8 | 75.3 | 72.8 |
| World | 29.0 | 31.3 | 33.2 | 34.8 | 35.8 | 36.6 | 7.7 | 0.9 | 100.0 | 100.0 |
Table 2.12 Biomass energy demand by region, 2024–2050
Source: OPEC.
In OECD Americas, biomass demand is expected to rise by +1 mboe/d over the outlook period. This is despite current uncertainties related to the new US Administration and related regulations on biofuels. At the same time, there is broad consensus in the energy industry supporting an increase in renewable fuels blended into the fuel mix from 2026 onwards. In OECD Asia-Pacific, biomass demand is expected to increase by only 0.2 mboe/d between 2024 and 2050.
In the non-OECD, the largest increase in biomass use is expected in China, rising from 3 mboe/d in 2024 to 4.6 mboe/d in 2050. This reflects government efforts to reach a peak in CO2 emissions by 2030. Biomass in China is used as biofuel in the transportation sector and for heat and electricity generation. The co-firing of biomass in coal power plants is also increasing.
Biomass use in India is expected to increase from 4.1 mboe/d in 2024 to 4.3 mboe/d in 2050, reflecting two opposing trends. India is expected to reduce the traditional use of biomass by increasing energy access to modern energy sources, including LPG, natural gas and renewables. At the same time, the advanced use of biomass is projected to increase in the outlook period. This is supported by rising ethanol blending in the country, which is
expected to reach the 20% threshold in the gasoline pool in 2025. India also plans to introduce a biodiesel blending target of 5% in 2030.
Africa's use of biomass is expected to increase from 7.5 mboe/d to 9.2 mboe/d, representing a strong increase of 1.7 mboe/d. This growth is driven by increasingly advanced use of biomass, including biofuels, as well as its application in power generation. However, in line with strong population growth in Africa, a further increase in the traditional use of biomass in the medium term is still possible. Latin America is another region where biomass demand is expected to increase significantly, rising from 3 mboe/d in 2024 to 3.6 mboe/d in 2050. This is mostly in line with the rising production of biofuels, biomass cogeneration and biogas.
Biomass demand is also expected to rise in other regions, albeit in a much less pronounced fashion. In Other Asia, biomass demand is expected to move up by 0.3 mboe/d, followed by Other Europe (+0.2 mboe/d), Russia (+0.2 mboe/d) and Other Eurasia (+0.1 mboe/d).
2.3.7 Other renewables
Other renewables generation, dominated by wind and solar, posted another record increase last year. Global electricity generation from wind and solar increased by around 650 TWh in 2024, a significant acceleration from around 520 TWh in 2023. Similar to 2023, growth was largely driven by China, which accounted for more than half of the global incremental generation in 2024. Solar power generation is the main driver behind this growth and accounted for 70% of the incremental supply of other renewables.
This growth was driven by supportive policies, as well as declining LCOEs. Other renewables are increasingly competitive against traditional fuels in the power generation mix in many regions, supporting their rapid expansion.
However, the expansion of other renewables is also increasingly facing headwinds. New builds are being delayed in many regions due to various reasons, including supply chain issues, permitting procedures and financing costs, for example. The rising share of intermittent renewables also heightens the need for balancing and backup services, and places additional stress on power grids. In addition, power grid infrastructure remains a critical bottleneck, as outdated transmission networks struggle to integrate increasing renewable capacity. To accommodate the expansion of new solar and wind generation capacities, grid modernization is required, leading to additional costs.
Therefore, although LCOEs of wind and solar are declining, the rising share of these generation technologies in the generation mix necessarily leads to higher integration costs, including additional expenditure related to balancing, backup, grid expansion and batteries. Baseload power supply, as well as flexible backup capacity, must be ensured to prevent blackouts and ensure security of supply.
In addition, market participants are increasingly concerned about the effects of long periods of low wind and solar power generation. For countries with a high share of intermittent renewables and limited backup capacity, these periods can pose a major challenge to power systems, resulting in elevated prices. As a result, governments are increasingly focusing on energy security and affordability and adjusting their policies accordingly. In the US, the new administration is less supportive of renewables – especially offshore wind – which is likely to result in slower growth in the medium term.

Consequently, this year's Refence Case sees slower growth in the deployment of other renewables compared to the WOO 2024. Nevertheless, growth is still set to be immense, moving from 10.6 mboe/d in 2024 to 19.1 mboe/d by 2030, before surging to 51.1 mboe/d by 2050, as shown in Table 2.13 and Figure 2.13. Other renewables are projected to experience
Table 2.13
'Other renewables' energy demand by region, 2024–2050
| Levels mboe/d | Growth mboe/d | Growth % p.a. | Share % | |||||||
|---|---|---|---|---|---|---|---|---|---|---|
| 2024 | 2030 | 2035 | 2040 | 2045 | 2050 | 2024–2050 | 2024–2050 | 2024 | 2050 | |
| OECD Americas | 2.2 | 3.3 | 4.3 | 5.4 | 6.5 | 7.6 | 5.5 | 5.0 | 20.2 | 14.9 |
| OECD Europe | 2.3 | 3.5 | 4.5 | 5.2 | 5.7 | 6.3 | 4.1 | 4.1 | 21.2 | 12.4 |
| OECD Asia-Pacific | 0.8 | 1.2 | 1.7 | 2.1 | 2.6 | 3.1 | 2.3 | 5.6 | 7.1 | 6.0 |
| OECD | 5.2 | 8.1 | 10.5 | 12.7 | 14.9 | 17.0 | 11.9 | 4.7 | 48.4 | 33.3 |
| China | 3.3 | 6.0 | 8.2 | 10.2 | 12.4 | 15.0 | 11.7 | 6.0 | 30.6 | 29.3 |
| India | 0.5 | 1.2 | 1.9 | 2.8 | 4.0 | 5.4 | 4.9 | 10.0 | 4.2 | 10.5 |
| Other Asia | 0.9 | 2.0 | 3.2 | 4.4 | 5.4 | 6.0 | 5.1 | 7.3 | 8.9 | 11.7 |
| Latin America | 0.4 | 0.7 | 1.1 | 1.4 | 1.5 | 1.6 | 1.2 | 5.6 | 3.7 | 3.1 |
| Middle East | 0.1 | 0.3 | 0.7 | 1.2 | 1.8 | 2.4 | 2.3 | 14.3 | 0.7 | 4.6 |
| Africa | 0.3 | 0.6 | 1.0 | 1.4 | 1.7 | 1.8 | 1.5 | 7.6 | 2.5 | 3.5 |
| Russia | 0.0 | 0.1 | 0.2 | 0.3 | 0.5 | 0.8 | 0.7 | 12.4 | 0.3 | 1.5 |
| Other Eurasia | 0.0 | 0.1 | 0.1 | 0.2 | 0.3 | 0.6 | 0.6 | 12.5 | 0.3 | 1.1 |
| Other Europe | 0.0 | 0.1 | 0.1 | 0.2 | 0.3 | 0.6 | 0.6 | 10.9 | 0.4 | 1.2 |
| Non-OECD | 5.5 | 11.0 | 16.6 | 22.2 | 27.9 | 34.1 | 28.6 | 7.3 | 51.6 | 66.7 |
| World | 10.6 | 19.1 | 27.1 | 34.9 | 42.8 | 51.1 | 40.5 | 6.2 | 100.0 | 100.0 |
Source: OPEC.
Figure 2.13 'Other renewables' energy demand by region, 2024–2050

Source: OPEC.

the largest and fastest growth of any energy source over the outlook period, increasing by 40.5 mboe/d, or an average of 6.2% p.a. China will account for almost 30% of this growth. Demand for other renewables is projected to increase from 3.3 mboe/d in 2024 to 15 mboe/d in 2050. The main driver of this growth is the country's emission targets and declining costs of renewables. China is also the world's major producer of solar panels, wind turbines, battery storage solutions and other related equipment. Increasing production capacities have also enabled cost reductions through economies of scale.
Demand for other renewables in India is expected to soar from 0.5 mboe/d in 2024 to 5.4 mboe/d in 2050. The country's official target is to reach 500 GW of installed renewable capacity (mostly wind and solar) by 2030. It is uncertain whether this target will be reached, as India's renewable capacity stood at just above 200 GW in late 2024. Other Asia will follow suit and is expected to increase its deployment of other renewables by 5.1 mboe/d in the outlook period, moving from 0.9 mboe/d in 2024 to 6 mboe/d in 2050. Many countries in the region have significant unused potential in this regard. For example, Indonesia is adding solar and wind capacity to reach its target of increasing the share of renewable energy in its energy mix to 35% by 2034. Similarly, Malaysia has set a target of 40% for renewables' share of generation capacity by 2035.
The Middle East is expected to increase demand for other renewables from 0.1 mboe/d in 2024 to 2.4 mboe/d in 2050. This considerable growth is based on the policy of many countries in the region to reduce oil consumption for power generation and meet growing electricity demand. Furthermore, solar generation in many countries has much lower costs than elsewhere, with sufficient available area for large solar plants. This situation explains why several countries in the Middle East (including OPEC Member Countries) have ambitious targets in this regard. Saudi Arabia already has more than 6 GW of renewables capacity, adding 3.7 GW of capacity (mostly solar) in 2024 alone. The official target for renewables in Saudi Arabia is 130 GW of installed capacity by 2030, 58.7 GW of solar and 40 GW of wind.
Significant additions of other renewables are expected in Africa (+1.5 mboe/d) and Latin America (+1.2 mboe/d), supported by rising electricity demand and vast renewable resources. Renewable distributed energy systems, some of which can also operate in offgrid mode, are helpful in increasing energy access in underdeveloped areas, thus reducing energy poverty.
Elsewhere, sizable additions are expected in Russia (+0.7 mboe/d), Other Eurasia (+0.6 mboe/d) and Other Europe (+0.6 mboe/d). Due to their low starting base, the average annual growth rate in all three regions is above 10% p.a.
In the OECD region, the largest addition of other renewables is expected in OECD Americas, where demand is expected to increase from 2.2 mboe/d in 2024 to 7.6 mboe/d in 2050. This is especially related to offshore wind, with leases in federal waters temporarily suspended by the government. Growing electricity demand and the competitiveness of renewables are expected to provide momentum for further growth in the long term regardless.
In OECD Europe, demand for other renewables is expected to increase by 4.1 mboe/d in the outlook period to reach 6.3 mboe/d in 2050. This growth is supported by energy policies like RePowerEU and broader efforts to reduce emissions. However, the expansion is facing challenges, such as insufficient grid development and slow permitting procedures.

Furthermore, spiking electricity prices and instability of power grids during periods of low wind and solar utilization has led to disagreements between European countries and could have consequences for the interconnectedness of the European electricity market.
In OECD Asia-Pacific, other renewables are expected to increase from 0.8 mboe/d in 2024 to 3.1 mboe/d in 2050. Japan's new energy plan sees the share of renewables in electricity generation expanding to between 40% and 50% in 2040, up from 23% today. Similarly, South Korea is attempting to increase the share of renewables in its generation mix to around 29% by 2038, up from less than 10% in 2023.
2.4 Energy demand by sector
This section discusses energy demand outlook by major sectors. It focuses on coal and gas, as well as electricity. Sectoral demand for oil will not be addressed in this section but will be discussed in detail in Chapter 3.

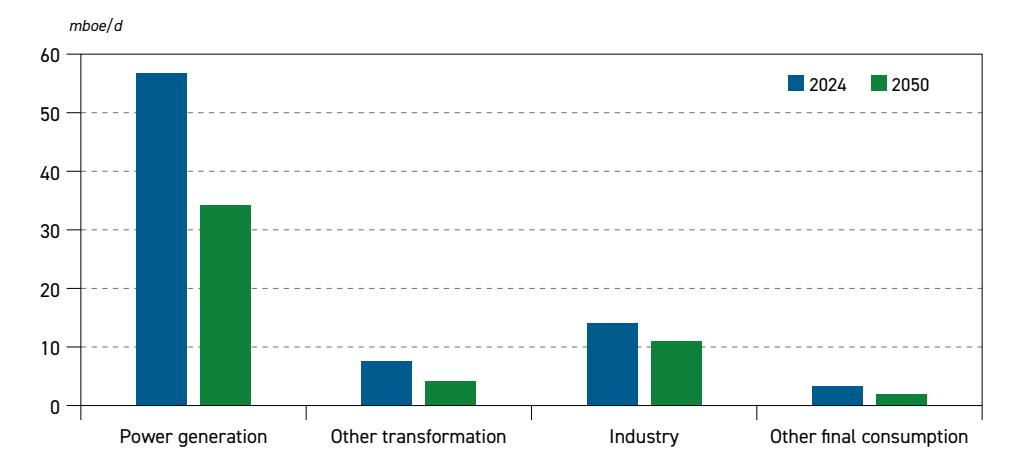
Source: OPEC.
Coal demand in the power generation sector was estimated at almost 57 mboe/d in 2024 and is projected to drop to 34.3 mboe/d in 2050, representing a decline of 22.5 mboe/d or 40% over the outlook period. This is largely attributed to a decline in China of 17 mboe/d over the outlook period, accounting for 75% of the global decline. Strong declines are also expected in all OECD regions, in line with coal's substitution by other fuels. Among the OECD countries, the largest decline is expected in the US, where coal demand is projected to fall by around 3 mboe/d between 2024 and 2050. At the same time, declines in advanced economies will partly be offset by modest increases in several regions, including India and Indonesia.
The industrial sector is the second largest consumer of coal, with demand estimated at around 14.1 mboe/d in 2024. Almost half of this consumption is accounted for by China. The industrial sector in India is also a large consumer of coal, estimated at around 2 mboe/d in 2024. Coal demand in the industrial sector is shaped by two trends. Economic growth and

industrialization in developing countries supports coal demand growth in the industrial sector (e.g. India). At the same time, substitution with other fuels and rising efficiency are helping to reduce coal demand in advanced economies (e.g. China and the OECD). Consequently, global coal demand in the industrial sector is expected to drop by 3.1 mboe/d to 11 mboe/d in 2050. This represents a decline of 22%, which is significantly lower compared to the 40% drop in the power generation sector in the same period. This is attributed to the replacement of coal by other fuels in industry, which is much harder, due to the nature of industrial processes and competitiveness.
Coal demand in other sectors is significantly lower. Coal demand in other transformation (e.g. coal processing and own use) is set to drop from 7.6 mboe/d in 2024 to 4.1 mboe/d in 2050. Finally, coal demand in other final consumption (e.g. the residential and commercial sector) is projected to decline from 3.3 mboe/d in 2024 to 2 mboe/d in 2050.
Figure 2.15 shows global natural gas demand by sector in the Reference Case. Unlike coal, natural gas demand is projected to increase in all sectors, supported by its lower carbon footprint, energy policies and the substitution of coal in the power generation and industrial sectors. Natural gas is considered crucial in ensuring power grid stability, given the rising share of intermittent renewable power supply. Furthermore, natural gas resources are available at low costs, which, in combination with rising LNG export capacities, is likely to keep international prices competitive. Global natural gas demand is projected to increase from 70 mboe/d in 2024 to nearly 90 mboe/d in 2050. In some cases, this demand will be accompanied by the application of CCUS, including power generation, industry and blue hydrogen production.
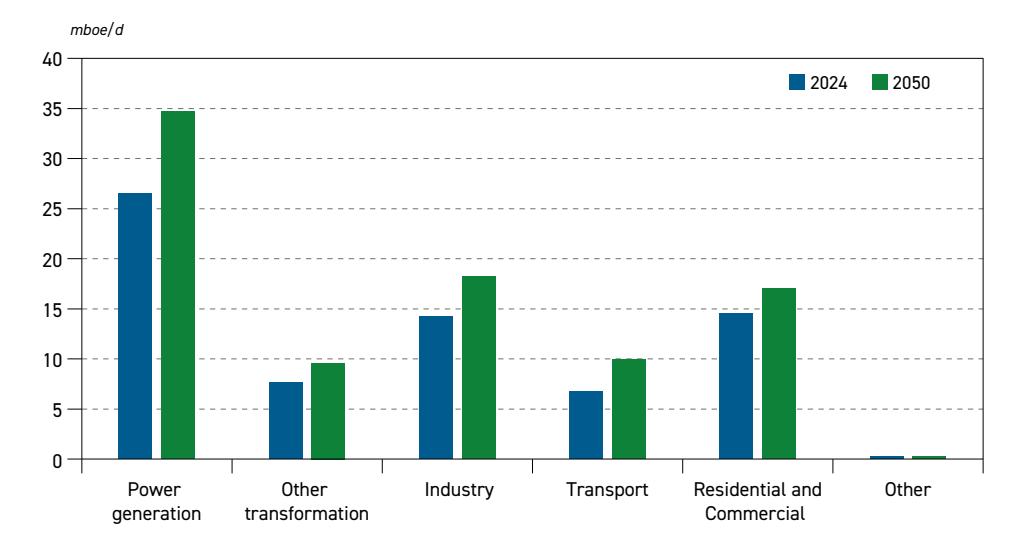
Figure 2.15 Global natural gas demand by sectors, 2024 and 2050
Source: OPEC.
The largest share of gas demand is accounted for by the power generation sector, with demand estimated at 26.5 mboe/d in 2024. In the period to 2050, gas demand in global power generation is set to rise to almost 35 mboe/d, up by 31%. Most developing regions are likely to see rising natural gas demand in the power generation sector, supported by power demand

growth and a phase-out of coal in some countries. In OECD Americas, gas demand in the power generation sector is expected to increase slightly, underpinned by strong electricity demand growth, especially in connection with rising demand from data centres and AI. In OECD Europe, gas demand in power generation is projected to decline, in line with its rising substitution by other fuels and the rising supply of biogas. In OECD Asia-Pacific, gas demand in power generation is seen as remaining flat throughout the outlook period.
Gas demand in the industrial sector is expected to increase by 20% over the outlook period, reaching 18.2 mboe/d in 2050. Increasing gas demand in the industrial sector is a quick and efficient way to replace coal and thus reduce CO2 emissions substantially, especially if accompanied by CCUS. In addition, the petrochemical sector accounts for a significant share of this demand growth, given that it uses gas as feedstock.
A strong increase in gas demand is expected in the transportation sector. From around 6.8 mboe/d in 2024, demand is set to reach 10 mboe/d in 2050, up by almost 50%. Rising usage in the shipping and trucking sector (as LNG), as well as a rising number of natural gas vehicles in the road transportation sector, are the major factors driving this increase. Furthermore, rising demand for the transportation of gas in pipeline systems is also contributing to growth.
Natural gas demand in the residential and commercial sector is projected to increase from 14.5 mboe/d in 2024 to 17 mboe/d in 2050. This is the result of two opposing tendencies. Most developed countries are likely to see a decline in demand due to a rising substitution of gas through electricity (e.g. heat pumps). This will be more than offset by rising demand in developing regions in Asia, the Middle East and Africa, in line with rising population growth and gasification rates. Natural gas is also a crucial fuel in increasing energy access across Africa and Asia, thus reducing the traditional use of biomass for cooking and/or heating.
Finally, natural gas use in other transformation is projected to rise from 7.7 mboe/d in 2024 to 9.6 mboe/d in 2050, which mostly reflects the rising production of hydrogen. A large part of this additional hydrogen production is likely to be combined with CCUS, in line with efforts to reduce the carbon footprint of hard-to-abate sectors.
Figure 2.16 shows global total final consumption of electricity by sector in 2024 and 2050. Strong electricity demand growth is expected in all regions, driven not only by population and economic growth, but also by rising electrification of all sectors, including industry, the residential and commercial sector, as well as transportation.
Total final electricity demand is expected to increase from around 26,500 TWh in 2024 to 48,300 TWh in 2050, an increase of almost 85% over the outlook period. The largest demand increase is expected in the residential and commercial sector, where electricity demand increases to above 20,000 TWh, up by more than 7,800 TWh. Population growth and rising electrification rates in developing regions are the main drivers of this growth. Furthermore, rising living standards lead to higher consumption as well. This includes a strong increase in air conditioning use across the developing world, with electricity demand for cooling functions rising during hot periods. In addition, the growing substitution of other fuels in the residential and commercial sector also contributes to rising demand. This especially relates to highly efficient heat pumps replacing heating oil and natural gas for heating purposes.
The second largest increment comes from the industrial sector, with projected growth from 10,900 TWh in 2024 to 16,500 TWh in 2050, an increase of more than 50% over the outlook
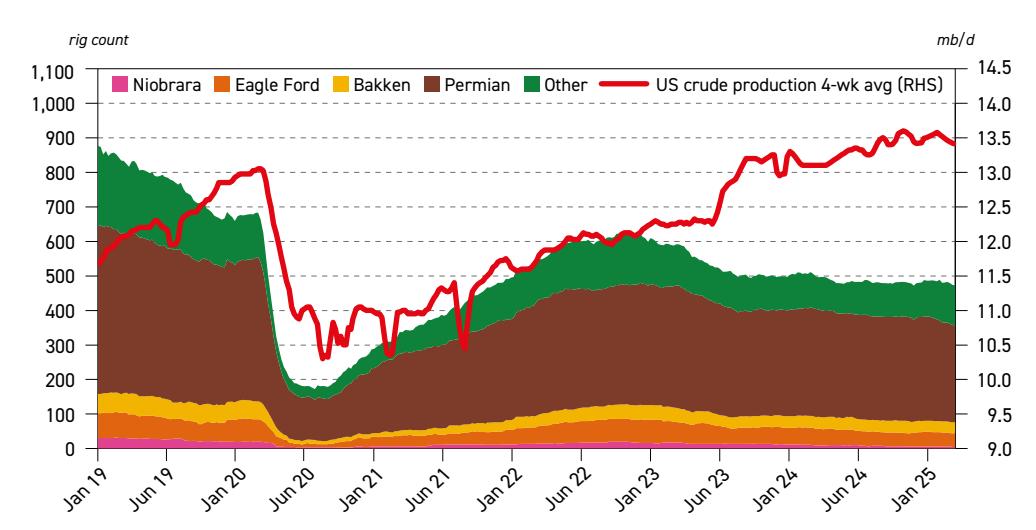
Figure 2.16 Global total final consumption of electricity by sector, 2024 and 2050
Note: Total final consumption does not include own use and transmission/distribution losses and, therefore, is not equal to electricity generation
Source: OPEC.
period. Rising industrialization and manufacturing is set to drive this demand, especially in developing countries. In developed countries, rising demand for electricity is also related to the electrification of the industrial sector and replacement of other fuels, including coal and gas. Even in hard-to-abate sectors, it is increasingly possible to use electricity – including electric arc furnaces – for steel production.
Electricity demand in the transportation sector is expected to increase from 550 TWh in 2024 to almost 4,400 TWh in 2050, largely driven by increasing electric mobility. Regions such as China and OECD countries are expected to see a significant increase in EV sales over the long term, which will lead to a substantial increase in power demand for transportation. While less pronounced, the expansion of railway transport will also contribute to the overall increase in electricity demand in the transportation sector.
Data centres and AI represent a novel electricity demand sector that has seen astonishing growth in recent years, especially in specific regions like the US, China and Europe. The rapid growth in electricity demand from data centres has subjected local generation facilities, as well as power networks, to stress tests. Data centres and AI, in most cases, require a stable baseload power supply. This is the reason why intermittent power supply from renewables is not sufficient to stratify this demand, ensuring that additional supplies from conventional sources such as nuclear and/or gas-fired plants are required. Several technology companies are prepared to invest in nuclear power and additional gas-fired generation facilities as a result. In 2024, global electricity demand was estimated at around 500 TWh, but it is projected to increase rapidly to around 1,100 TWh in 2030 and around 3,300 TWh in 2050. This growth is expected in all regions; however, the largest increments are expected in the US, China and Europe. The level of uncertainty related to looming demand from data centres is large. New AI models from China are reportedly much more energy efficient than their US counterparts, for example. However, more efficient AI models could also lead to rebound effects and higher

usage, thus fostering higher demand. The continuous development of new models will certainly increase electricity demand, but the pace of change in this sector poses significant uncertainty regarding the trajectory of long-term electricity demand.
2.5 Electricity demand and generation
This section focuses on electricity demand and generation. It discusses recent trends and provides a long-term outlook for major regions. Electricity demand in this section includes final electricity consumption, as well as own use and transmission/distribution losses.
Electricity demand has been increasing steadily since the beginning of the century. From around 15,500 TWh in 2000, global electricity demand soared to above 31,000 TWh in 2024. This is an increase of more than 100% since 2000, or around 3.15% p.a. on average. This was largely in line with global GDP growth over the same period, which increased at around 3.35% p.a. on average. Growing populations and economies were the main drivers of this power demand growth, coupled with increasing industrialization and rising middle classes.
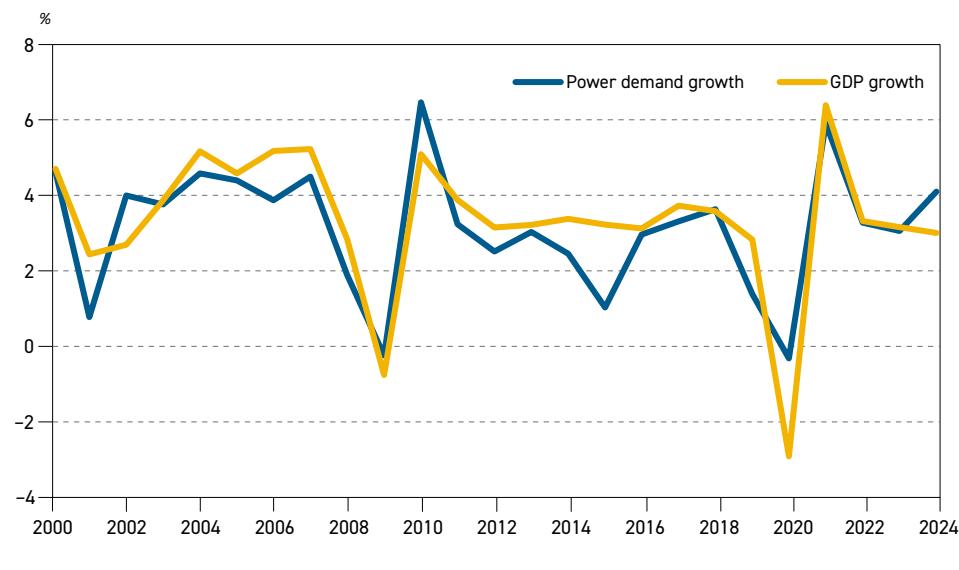

Source: OPEC.
Global electricity demand growth from 2000 to 2024 in developed countries was sluggish or even negative. This was more than offset, however, by strong demand growth in developing countries, especially in Asia and the Middle East. Annual average power demand growth was highest in China, at almost 9% p.a., followed by India at 5.6% p.a., Other Asia and the Middle East. Demand growth in developing countries was driven by expanding electricity access, rising middle classes and increasing demand from industrial sectors, especially from energy-intensive industries.
At the same time, average power demand growth in developed regions was significantly lower, at 1.2% p.a. in OECD Asia-Pacific, 1.1% p.a. in OECD Americas and 0.7% p.a. in OECD Europe.

In some developed countries, electricity demand growth was even negative in some years, despite rising GDP. The main reasons for this were rising energy efficiency, market maturity, slow economic growth, as well as the shifting focus from industry to service economies. For instance, electricity demand in Germany decreased by around 15% between 2010 and 2024. In Japan, it dropped by around 12% in the same period.
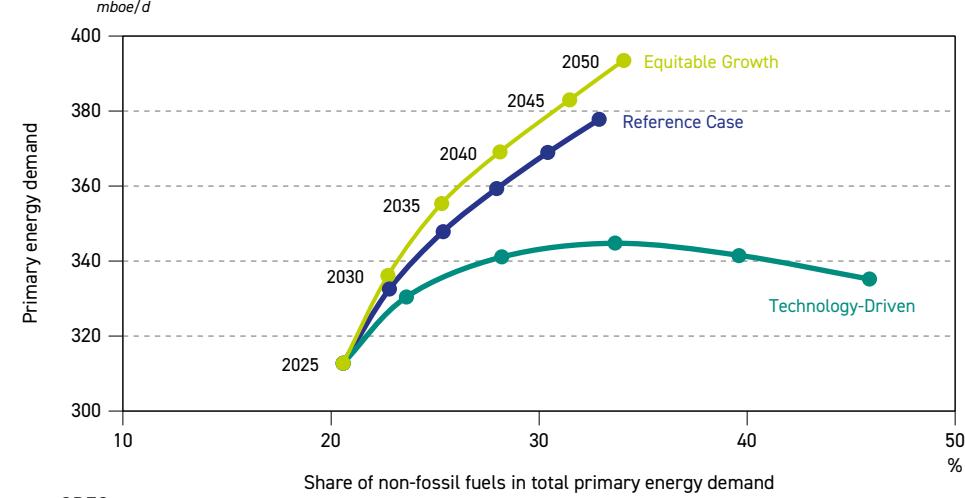
Figure 2.18 Average annual growth rate of electricity demand, 2000–2024
Source: OPEC.
In 2024, according to preliminary data, global electricity demand increased strongly by more than 4% relative to the previous year. This was the highest annual rate of growth since 2007, if two demand rebounds are excluded, one in 2010, after the global financial crisis, and one in 2021, after the COVID-19 slump. 2024 may be a turning point for electricity demand, with strong growth possible across all regions in the years ahead.
In developing countries, rising population and economic growth – in combination with rising energy access and living standards – are the main drivers of future growth. Rising electrification and the substitution of traditional fuels in the energy mix, as well as demand from data centres, also contribute to this trend. In developed regions, rising electrification and the replacement of coal, gas and oil in all sectors is likely to lead to stronger electricity demand growth than in previous years. This is in line with energy policies in many OECD countries, especially OECD Europe. In addition, data centres and AI will ensure a significant amount of additional demand, especially in the US, but also in other OECD countries.
Figure 2.19 shows total global electricity demand by region, which is expected to increase from 31,400 TWh to 57,500 TWh in 2050. Around 75% of this growth is projected to come from developing countries, and almost 60% from developing countries in Asia alone. China is expected to see an increase of around 6,500 TWh in the outlook period, while India will grow by around 4,200 TWh. Significant growth of around 4,000 TWh is also projected in Other Asia. Elsewhere, the Middle East and Africa are expected to see electricity demand increasing by

1,350 TWh and 1,700 TWh, respectively. In the OECD, electricity demand growth is estimated at around 6,000 TWh between 2024 and 2050. OECD Americas accounts for almost half of this growth, while the share of OECD Europe is at around 40%.

Figure 2.19 Electricity demand by region, 2024–2050
Source: OPEC.
The projected rise in electricity demand calls for a rapid increase in power generation. A significant expansion of new generation capacity is required, especially given the decline in coal-fired generation, a policy that aligns with the phase-out of coal power plants and efforts to reduce CO2 emissions. Figure 2.20 shows the global electricity generation by major fuel. Total generation is projected to increase from 31,300 TWh in 2024 to 57,500 TWh in 2050, an increase of nearly 85%, as shown in Table 2.14 and Figure 2.20.
By far the largest increase in the generation mix is projected for other renewables (mostly wind and solar), which will grow from around 4,900 TWh in 2024 to 26,000 TWh in 2050, aided by energy policies and declining costs. In many regions, other renewables have become competitive against traditional power sources. This is especially the case in the Middle East, where a staggering expansion of solar capacity is projected in the medium and long term.
Power generation from natural gas is projected to increase by 3,500 TWh between 2024 and 2050, in an effort to replace coal in the generation mix. Natural gas is a much cleaner fuel than coal, emits far less CO2 and reduces local air pollution significantly. Natural gas plants are also flexible and can begin operating within several minutes, ensuring they are well-suited to complement intermittent renewables and help balance their variability. Due to a strong expansion of intermittent renewables in some countries, it is possible that the operational regime for gas-fired plants will shift from baseload to peak load.
The further expansion of hydropower, especially in the developing world, is likely to add around 2,200 TWh of electricity generation between 2024 and 2050. This will mostly be due to
| Levels TW/h | Growth TW/h | Growth % p.a. | Fuel share % | |||||||
|---|---|---|---|---|---|---|---|---|---|---|
| 2024 | 2030 | 2035 | 2040 | 2045 | 2050 | 2024–2050 | 2024–2050 | 2024 | 2050 | |
| Coal | 10,785 | 10,931 | 10,766 | 10,244 | 9,203 | 7,884 | –2,901 | –1.2 | 34.4 | 13.7 |
| Gas | 6,638 | 7,366 | 8,114 | 8,861 | 9,568 | 10,194 | 3,556 | 1.7 | 21.2 | 17.7 |
| Oil | 827 | 845 | 828 | 787 | 729 | 660 | –167 | –0.9 | 2.6 | 1.1 |
| Nuclear | 2,856 | 3,222 | 3,590 | 3,982 | 4,382 | 4,762 | 1,905 | 2.0 | 9.1 | 8.3 |
| Renewables | 10,240 | 15,097 | 19,601 | 24,080 | 28,819 | 34,057 | 23,817 | 4.7 | 32.7 | 59.2 |
| of which: Hydro | 4,500 | 4,967 | 5,359 | 5,760 | 6,216 | 6,727 | 2,227 | 1.6 | 14.4 | 11.7 |
| of which: Biomass | 809 | 955 | 1,071 | 1,164 | 1,243 | 1,317 | 508 | 1.9 | 2.6 | 2.3 |
| of which: Other renewables (mainly solar & wind) | 4,931 | 9,175 | 13,171 | 17,156 | 21,360 | 26,013 | 21,082 | 6.6 | 15.7 | 45.2 |
| Total | 31,345 | 37,460 42,899 | 47,954 | 52,702 | 57,556 | 26,210 | 2.4 | 100.0 | 100.0 |
Table 2.14 Global electricity generation by fuel, 2024–2050
Source: OPEC.
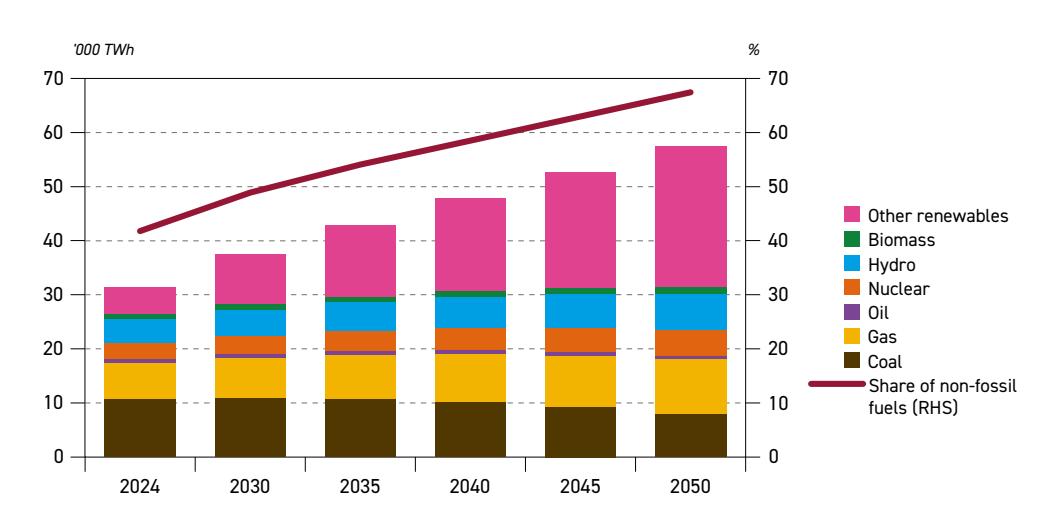
Figure 2.20 Global electricity generation by fuel, 2024–2050
Source: OPEC.
additions of new hydropower plants but, to a smaller extent, will also occur due to increasing turbine efficiency in existing units.
Nuclear power is currently going through a renaissance period, with many new projects and much more optimism than in previous years. This may bring the nuclear sector's long phase of stagnation to an end. Many countries are building new reactors, with a total of

64.5 GW of new capacity under construction. With rising electricity demand from data centres, many technology companies – including Microsoft, Meta, Amazon and OpenAI – have started investing in nuclear power. Additional supply may also come from SMRs, some of which may become commercial in the early 2030s. The Reference Case sees nuclear generation increasing from 4,500 TWh in 2024 to 6,700 TWh in 2050.
A limited increase of around 500 TWh is expected from biomass in the outlook period. This stems from biomass-to-power applications and biogas. This addition is likely to materialize mostly in developed countries (e.g. in Europe), which have supportive energy policies.
Coal-fired generation is projected to decline by nearly 3,000 TWh over the outlook period. Restrictive policies, ageing plants, as well as competition and substitution by other fuels, all contribute to this decline. The largest decline in coal-fired generation is expected in China and the OECD, which will be partly offset by other countries in the developed world, notably India and some countries in Other Asia.
A minor decline is expected for oil-fired generation, moving from 830 TWh in 2024 to 660 TWh in 2050. The largest share of this decline is expected in the Middle East and OECD Asia-Pacific, where oil will be replaced by renewables, gas and nuclear in the power generation mix. This decline, however, is likely to be partly offset by a modest increase in Africa. Oil will also remain part of the power generation mix in some regions and is likely to be used as reserve capacity and during peak load hours.
The share of non-fossil fuels in the power generation mix is set to increase from 42% in 2024 to 67.5% in 2050. This is mostly due to a decline in coal-fired generation and an increase in other renewables.
Implications for power generation
The largest increase in power generation is expected to come from other renewables, which are mostly intermittent. This will have significant implications for future power systems and could cause major problems in the long term.
Intermittent renewable power generation has increased significantly in recent years, especially in some European countries, the US and China. Rising intermittent power generation capacity has brought new risks related to electricity supply that did not exist before. For example, periods of cloudy, calm days with low wind lead to a strong decline in wind and PV generation, posing challenges for power systems. They can occur up to ten times a year, usually in the fall and winter, and can last for 24 hours or more, or sometimes even for a full week.
In traditional power generation systems, these periods remain largely unnoticed. However, they can pose significant problems for power generation systems that have a large share of solar and wind generation capacity. In order to meet demand during these periods, power generation systems have to use all available alternatives and backups. This includes maximizing the use of storage hydropower and pumped hydro, as well as thermal generation, including reserve capacity. Another alternative is to increase power imports through interconnections with neighbouring countries, if available. Although limited now, the rising availability of battery storage could help in the future. However, it is questionable whether battery storage can offset the absence of wind and PV power generation over periods lasting longer than several days. These relatively sudden swings in electricity generation patterns

place electricity grids and electricity systems under considerable stress, creating a high risk of blackouts.
An additional consequence of intermittency is soaring electricity prices. For instance, due to the lack of renewable electricity generation, the German baseload electricity price rose above 350 EUR/MWh on 12 December 2024. Rising prices in Germany led to higher electricity imports through interconnections, which, in turn, increased prices in these markets (e.g. France or Norway) as well. Repeated price spikes due to strong demand in Germany resulted in dissatisfaction in exporting countries such as Norway, with some political actors there proposing to cut the interconnection with Germany to keep domestic electricity prices low.
If not properly addressed, these problems could become even more frequent in the future, not only in Europe but also elsewhere. Against this backdrop, it is clear that the expansion of renewable generation capacity alone is not sufficient to meet future electricity demand. Instead, significant investments in grids and reserve thermal capacities (e.g. gas-fired power plants), as well as battery storage, are essential if security of electricity supply is to be ensured.
2.6 Energy intensity and consumption per capita
Energy intensity is defined as the ratio of primary energy used per unit of GDP (adjusted for purchasing power parity) and is a simple aggregate measure often employed to help assess the energy efficiency of an economy. Despite the shortcomings of using energy intensity as a proxy for efficiency, it is one of the most important indicators used to measure progress against the UN's Sustainable Development Goal (SDG) 7.
A one-directional link between efficiency and intensity is clear: improving energy efficiency naturally reduces an economy's energy intensity. For example, new technologies deployed in the manufacturing sector could lower the energy requirements of a product. Policy mechanisms that encourage these energy efficiency improvements have been common across the globe for some time and remain an important focus for many governments. This was visible at COP28 in 2023, when around 120 countries pledged to double their energy efficiency improvement rates.
However, causality in the other direction is more complex. To understand intensity figures and trends that vary greatly across regions and countries, factors that have no direct impact on energy efficiency and the complexities that they introduce need to be considered. The structural makeup of an economy – whether service-based, manufacturing-based or somewhere between the two – feeds into energy intensity levels. In addition, factors such as local climate conditions and the behavioural patterns of populations are also important considerations.
As shown in Figure 2.21, the overall global trend of improving energy intensity is clear and highlights how, despite the global economy being twice as large in 2024 as it was in 2000, energy demand has only increased by a factor of 1.5. This demonstrates the positive impact of energy efficiency improvements, which can be largely attributed to technological advancements, various policy interventions, and renewable energy deployment – such as wind and solar – which help to reduce transformation losses in the supply of primary energy.

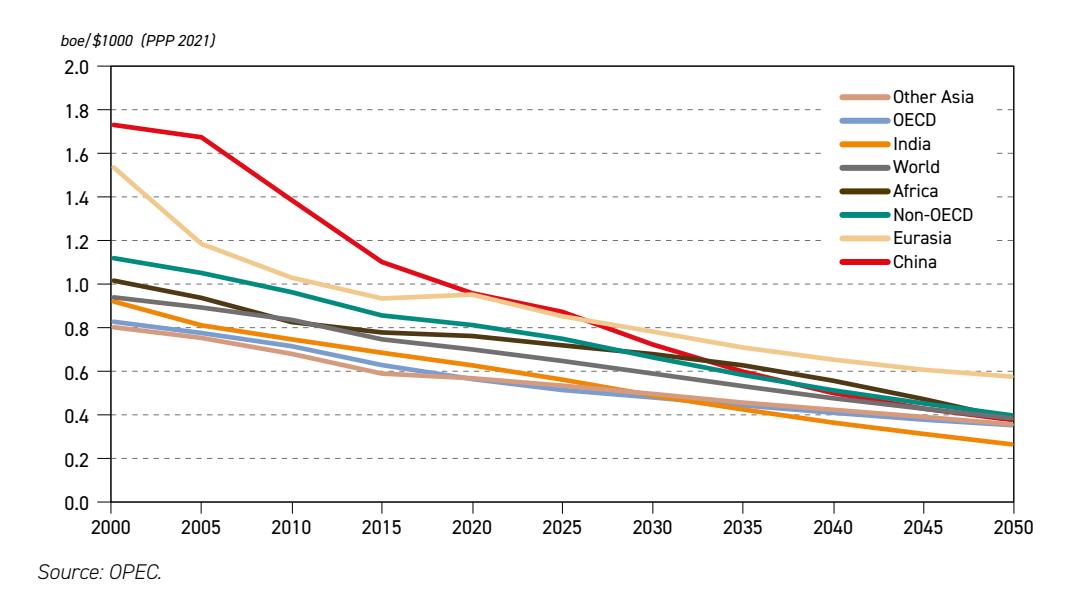
Figure 2.21 Evolution and projections of energy intensity in major regions, 2000–2050
The largest reduction in energy intensity has taken place in China. As a top priority, energy intensity has been a headline target of the Chinese government's five-year plans in the last two decades, and the country has made significant progress in energy conservation. In addition, as discussed earlier in this chapter, China's incremental demand for other renewables over the long term is by far the largest among all regions, implying improvements in energy intensity measured by the supply of primary energy. Overall, improvements in energy intensity are expected to continue, with a rapid average annual rate of improvement of 3.3% p.a. between 2024 and 2050 (Figure 2.22).
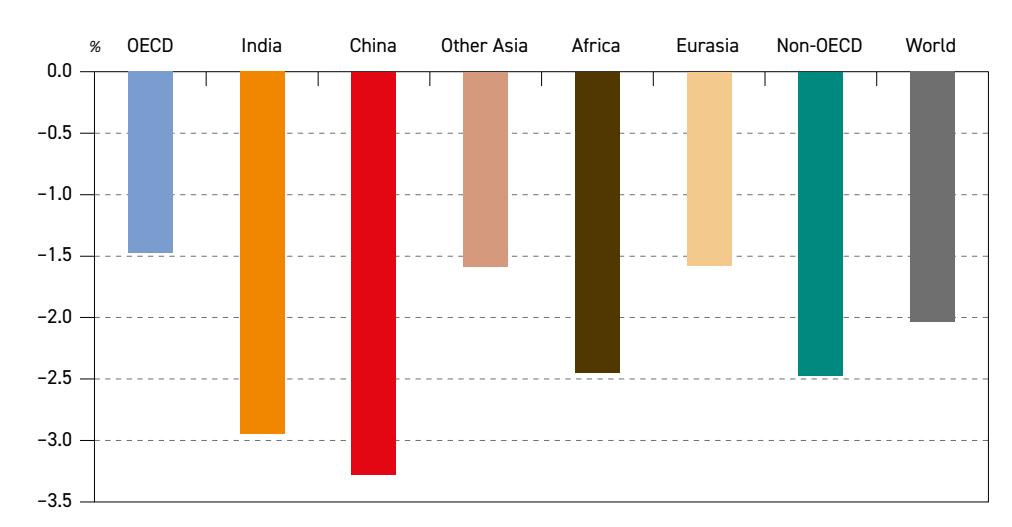
Figure 2.22

Source: OPEC.

India and other countries in Other Asia have also made significant improvements in recent decades, benefiting from key government initiatives and strategies. India's booming economy is expected to grow at a faster average annual rate than its energy demand, leading to a 2.9% p.a. rate of energy intensity improvement over the long term. For Other Asia – another region with substantial growth in primary energy demand through 2050 – the rate of improvement in energy intensity is significantly lower at 1.6% p.a., leaving the region behind the non-OECD regional average rate of approximately 2.5% p.a.
Since 2000, Eurasia has seen its energy intensity drop from a high level compared to other regions. The intensity levels of Russia and Other Eurasia used to be very similar but have been diverging recently.
Africa's energy intensity levels have been noticeably lower than those in other non-OECD regions over the past 20 years – even comparable to levels in the OECD. Relative to a rapidly growing population and an expanding economy, Africa's increase in energy use has been much slower and hundreds of millions of people continue to go without access to electricity. Going forward, the average rate of improvement between 2024 and 2050 is expected to be approximately 2.4% p.a. As large parts of Africa are in different stages of economic development, a slower decline of intensity is not necessarily a sign of lower efficiency, given ongoing industrialization and improved energy access.
In general, OECD countries continue to prioritize energy efficiency as a critical aspect of their sustainable development goals for the future and are building on significant past improvements based on technological progress and energy efficiency policies. As further improvements will become increasingly difficult, the OECD's average annual rate of improvement is steady at around 1.5% p.a. in the long term. OECD Americas is projected to show improvements above the regional average; conversely, improvements in the OECD Pacific are projected to remain below the regional average.
Overall, these regional improvements contribute to a worldwide reduction rate of just over 2% p.a. between 2024 and 2050. Moreover, there remains a critical disparity in energy consumption between regions, with a large amount of the world's population experiencing energy poverty and having no access to clean and affordable energy. This continues to have wide-ranging consequences for the success of economies and wellbeing of populations.
The historical disparity can be clearly seen through a comparison of the OECD and Non-OECD regions. In 1990, the OECD's average per capita energy consumption was almost 32 boe, while the non-OECD's per capita consumption lagged far behind at around 7 boe, varying significantly between a low of 2 boe per capita in India and a high of 44 boe per capita in Russia.
By 2024, the gap between the OECD and non-OECD regions had narrowed only slightly. Rapid economic expansion, especially in developing Asian countries, has had a positive impact, including lifting millions out of energy and economic poverty, expanding the middle class and increasing access to energy. However, non-OECD consumption in 2024 was still less than half of OECD consumption and energy poverty remains a critical issue for governments (Figure 2.23).
Figure 2.23 illustrates the OECD region's long-term trend of declining energy consumption per capita, while also improving its GDP per capita. Energy consumption started to decrease in the mid-2000s, but the economy continued to grow because of energy efficiency

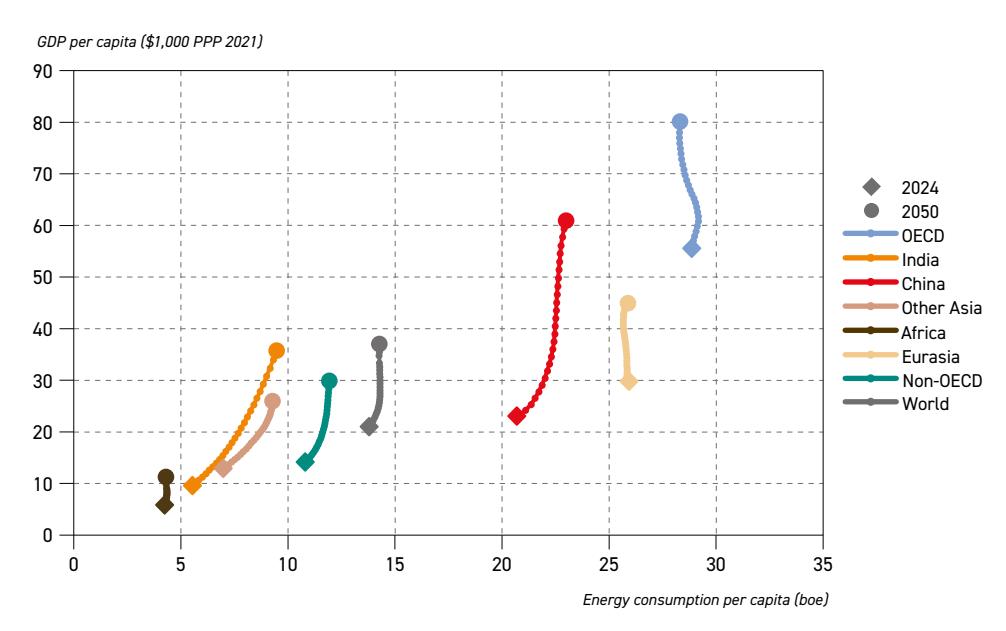
Figure 2.23 Per capita GDP and energy consumption, 2024–2050
Source: OPEC.
improvements and advancements in technology. This decoupling is expected to continue over the long term, as energy consumption per capita drops to 28.3 boe in 2050 from 28.9 boe in 2024.
In contrast, the non-OECD region's faster-growing economy will see energy consumption increase by a larger amount of 1.1 boe over the period to 2050, due to economic growth being accompanied by increasing electrification, rising income levels, urbanization and an expanding middle class.
The largest growth trajectories can be seen in China and India. In China, a dramatic increase in GDP per capita is expected to be accompanied by an increase in energy consumption per capita from 20.7 boe in 2024 to 23 boe in 2050. India's incremental increase is greater still, with consumption rising from just 5.5 boe to 9.5 boe over the outlook period.
For Other Asia, in line with an increase in GDP per capita, the region is expected to see an increase in energy consumption per capita, from 7 boe in 2024 to 9.3 boe in 2050. Noticeably, annual increases will slow towards the end of the outlook period. Of all developments in non-OECD regions, as presented in Figure 2.23, Africa's are the most limited. Despite making up over 18% of the world's population in 2024, the continent's share of global energy demand was only 6%. As energy consumption per capita only rises by less than 0.1 boe over the period between 2024 and 2050, the continent clearly continues to be underserved with energy.
Altogether, worldwide energy consumption is expected to increase by around 0.5 boe per capita between 2024 and 2050. Despite significant growth in energy consumption in developing countries, this will not be sufficient to address the global challenge of energy

poverty, which is anticipated to remain acute even in the long term. Indeed, the persistent gap between OECD and non-OECD per capita energy consumption acutely underlines the need for a strong multilateral and collaborative approach to tackle energy poverty and increase energy access.

Oil demand
Key takeaways
- • The US withdrawal from the Paris Agreement will impact climate change negotiations and would most likely result in higher demand for hydrocarbons, in general, and oil and gas, in particular.
- • Supported by recent policy shifts and an improved economic outlook, global oil demand is projected to reach 113.3 mb/d in 2030 – a robust increase of 9.6 mb/d compared to 2024.
- • Non-OECD oil demand is projected to increase by 8.6 mb/d to 2030 and reach 66.7 mb/d. Moreover, OECD demand is also set to increase over the same period, albeit by a much smaller 1 mb/d, reaching 46.6 mb/d by 2050.
- • In the long term, global oil demand is projected to rise by almost 19.2 mb/d between 2024 and 2050, increasing from 103.7 mb/d to almost 123 mb/d.
- • Long-term projections show a contrasting picture between continued strong non-OECD oil demand growth and declining OECD demand. While non-OECD demand is projected to increase by almost 28 mb/d between 2024 and 2050, OECD demand is set to drop by 8.5 mb/d.
- • India, Other Asia, the Middle East and Africa are set to be the primary sources of incremental demand growth. Combined demand in these four regions is set to increase by 22.4 mb/d between 2024 and 2050.
- • India alone is expected to add 8.2 mb/d to its oil demand over the outlook period.
- • China's oil demand is projected to increase by 1.8 mb/d over the outlook period. A large part of this increase is expected to occur over the medium term, with minimal demand changes projected for the rest of the forecast period.
- • The largest incremental demand growth over the outlook period is projected for road transportation, petrochemicals and aviation sectors. Oil demand in these sectors is set to increase by 5.3 mb/d, 4.7 mb/d and 4.2 mb/d, respectively.
- • The global vehicle fleet is expected to increase from 1.7 billion in 2024 to 2.9 billion in 2050 with the fastest growth expected in the segment of EVs. Nevertheless, ICEbased vehicles are set to continue to dominate the global fleet over the outlook period, accounting for around 72% in 2050.
- • With respect to refined products, major long-term demand growth is expected for gasoil/diesel (4.4 mb/d), jet/kerosene (4.1 mb/d), LPG/ethane (3.6 mb/d), gasoline (3.1 mb/d) and naphtha (2.7 mb/d).
The past two editions of the OPEC WOO foresaw an emerging change in energy transition narratives that drive specific energy policies, leading to upward long-term revisions to global oil demand. Recent developments have evidently confirmed this trend, which has both accelerated and become more complex. The issues of energy security, energy availability and reducing emissions are now central in political debates on energy across the world. Combined with the ambiguous and changing investment priorities of companies, including major energy and oil companies, as well as the ever-shifting public sentiment and sensitivity to climate actions, the energy landscape has become more complex, polarized, and lacks clear policy signals for the future.
This is not only visible at the country level, but also at the multilateral level too. To date, under the circumstances highlighted, only a small number of countries submitted their updated NDCs to the UNFCCC by early 2025, as required by the Paris Agreement.
On this front, the most visible change is taking place in the US. The new Administration, inaugurated in January 2025, made it clear by withdrawing from the Paris Agreement that it will be less concerned with climate change issues. Instead, its priority is on domestic economic growth, while from an energy perspective it has resurrected the 'energy dominance' agenda.
Although it remains to be seen how this policy shift will be reflected in specific oil-related policy measures, such as expected adjustments to Corporate Average Fuel Economy (CAFE) standards, the level of support for EVs, and incentives to reinvigorate domestic oil supply, the early signs point to a slower decline in long-term US oil demand, which is reflected in this year's Outlook assessment.
To some extent, a similar trend is also noticeable in Europe. Reflecting the results of the 2024 European Parliament election, as well as recent geopolitical developments, the new EU Commission, which took office on 1 December 2024, is set to give a much higher priority to enforcing defence capabilities and improving Europe's economic competitiveness. While the Commission continues to stress that the 'Green Deal' remains a priority, in practice the revised focus on defence and economic competitiveness will likely see less emphasis placed on decarbonization efforts.
Moreover, the reduction or removal of EV subsidies in several EU countries has led to lower sales, and, hence, slower penetration of these vehicles in the region's overall fleet. It is also important to note that lower EV subsidies are not the only reason for lower sales. These also reflect the delayed EV investment plans of major European car manufacturers, as the automotive industry seeks guidance from policymakers on the rate and direction of energy transitions. There is mounting pressure from several EU Member states for a deferral of strict and overly ambitious policy targets, including those assuming a complete shift to EVs already by 2035.
This creates an element of uncertainty for investment planning, especially when combined with trade disputes between the US and China, both major export destinations for European cars. Cars, in general, and EVs, in particular, are one of the major targets of tariffs. If this issue escalates, it could dramatically hit the European automotive industry.
A different set of factors can be observed in recent developments in China. There is a continued shift in the economy's structure towards a more service-oriented and less energy-intensive
one, alongside strong EV sales growth and some substitution of oil by LNG in the trucking segment. Apart from LNG use for trucks, which will likely be a temporary phenomenon with limited long-term impact, the other factors are expected to continue shaping China's future oil demand pattern. They are set to largely offset incremental demand from the petrochemical and aviation industries, especially in the long term.
Another important observation is that the oil demand recovery process from COVID-19 seems to be completed, with demand growth now undistorted by the impacts of the pandemic. The return to a more stable and predictable oil demand outlook is important for countries across the world, but especially for developing countries with rising populations, young labour forces and expanding economies, especially in developing Asia and Africa. These countries require substantial oil demand growth to meet rising demand for mobility and transport services, industrial expansion and improved energy access.
It is clear, however, that the trajectory for unlocking future incremental oil demand will not be a straightforward one. It will arise from the interplay of multiple factors, all of which can have differing impacts. Besides the impact of policies, as highlighted earlier, technology will also play a role in shaping this trajectory.
On the one hand, technological progress can create new opportunities and ways for expanding oil use. On the other, it can lead to achieving improved efficiencies across all sectors of consumption and thus offsetting part of the potential growth. One demonstrable example is the application of AI, which has the potential to vastly improve efficiencies and optimize processes – especially for maintenance work in large energy facilities, refineries, distribution networks and drilling operations – although the widespread utilization of this technology requires additional energy in data centres. Other examples include more efficient car engines, advanced aircraft design, smarter grids, the further replacement of traditional materials by petrochemical products, and the introduction of mobile CCUS technologies for trucks and ships. The net effect of technology advances on future energy and oil demand is often country- and sector-specific, sometimes even counterintuitive, and requires detailed and complex modelling tools.
This chapter tries to capture all the demand trends at the regional, sectoral and product level, and identify critical factors that will steer future demand in the period to 2050. This is achieved by carefully balancing the most likely socio-economic prospects at the regional level against energy policy setups and technology progress. Needless to say, there is an element of uncertainty for each of them. Taking this uncertainty into account, the results highlight the robust global oil demand growth prospects to 2050, with no signs of oil demand peaking over the forecast period.
3.1 Oil demand outlook by region
Global oil demand recorded robust growth of 1.5 mb/d in 2024, primarily driven by economic growth in China and supported by sustained economic activity in India and other non-OECD regions. OECD demand showed resilience to downward pressure, offering an important message in that oil demand remained broadly unchanged in the region. Indeed, the continued expansion of the petrochemical industry, the aviation sector and resilient oil consumption in road transportation, in particular, provide a solid base for an extended OECD demand plateau at least over the current decade.

In addition to these trends, there are several other factors supporting sustained, and even slightly accelerated, growth over the medium-term period to 2030. Firstly, this Outlook assumes some improvement in global economic growth from current levels, as discussed in detail in Chapter 1. This is the case for OECD regions and several key developing regions such as Other Asia, the Middle East, Africa and Latin America. Moreover, India is also projected to broadly maintain its high economic growth. An exception is China, where GDP growth is expected to slow gradually from 4.6% p.a. in 2025 to 4.3% p.a. in 2030.
A larger oil demand impact is expected from the shifting policy focus in most regions, led by recent developments in the US and Europe. In the US, initial signals from the new Trump Administration clearly indicate its preference for continued reliance on hydrocarbons through changes in environmental policies and regulations, reduced funding for renewable projects and withdrawal from international commitments, such as the Paris Agreement and Just Energy Transition Partnership. The latter two developments will likely slow the pace of energy transitions, not only in the US, but also in a number of developing countries given the absence (or shortage) of funds to support investments required for the expansion of renewable energy sources.
From the perspective of future oil demand, the most important decisions, such as the likely rollback of Corporate Average Fuel Economy (CAFE) standards and policy targets for the penetration of EVs, are still to be announced. Nevertheless, the narrative established so far, as well as the specific measures adopted at the time of finalizing this Outlook, leave little doubt that continued, and even marginally higher, oil demand in the US is to be expected over the medium-term period.
The energy policy shift in Europe seems to be less dramatic but is still noticeable. The focus of the previous EU Commission (2020–2024) centred around the main targets included in the European Grean Deal. However, the new Commission that took office in 2025 faces a much broader range of challenges. It claims that achieving carbon neutrality by 2050, the main objective of the Green Deal, remains a central goal in terms of energy use. However, amid escalating global tensions, enhancing Europe's defence capabilities (including increased spending on defence within the ReArm Europe Plan) seems to be a major priority, alongside improving the region's competitiveness.
The latter was highlighted in the report, 'The future of European competitiveness' (tasked by the EU and prepared by Mario Draghi, a former president of the European Central Bank), which concluded that "Europe will no longer be able to rely on many of the factors that have supported growth in the past". Therefore, for Europe to maintain economic growth and a competitive edge, the report highlights that it is necessary to increase funding for innovation, reduce regulations, support industries and enable the diffusion of advanced technology. In particular, this relates to the EU automotive industry, which is currently facing a number of crises and stands at a crossroads in terms of the direction of future investments related to EVs and ICE vehicles.
At present, new EV registrations substantially lag behind required levels, given the 2035 target to ban the sale of ICE cars. Major manufacturers are also under immense pressure to meet 2025 emission targets or pay huge penalties. In response to this situation, the EU Commission presented the Automotive Action Plan in March 2025 to address some of these concerns by extending the compliance period for CO2 emission targets. Instead of assessing compliance on an annual basis, emissions will now be averaged over a three-year period from 2025 to 2027. While this adjustment allows for some 'breathing space' for automakers, the Action Plan failed to provide clear guidance on the issue of the ICE ban. However, the

Commission did announce its intention to bring forward a review of the viability of the ICE ban to 2025, which hints at the possibility of deferring this target or softening it.
In short, the Commission's need to balance decarbonization efforts with economic growth, EU industrial competitiveness and enhancing defence capabilities – all of which will require huge financial support in the coming years – means that there will be fewer resources available to support energy transitions. In turn, this means a slower penetration of EVs, a slower substitution of refined products in the industrial and residential sectors and a slower penetration of technologies with higher fuel efficiencies. In countries where incentives and direct subsidies were recently removed due to budgetary constraints, there have already been significant declines in new sales of EVs, heat pumps and photovoltaic (PV) installations.
At the same time, it is very likely that recent developments in the US and EU will have spillover effects on other regions, particularly developing countries, which face expanding energy needs to help support development, improve energy access and eliminate energy poverty. The US withdrawal from the Paris Agreement will also impact climate change negotiations and lower the amount of funds available to support transitions in these countries, which is expected to lead to higher demand for oil and gas.
It should be noted, however, that China will likely develop somewhat differently. While it will remain one of the most important sources of incremental oil demand over the medium term, its overall demand increase is lower compared to previous years. This comes on the back of slower economic growth, the faster penetration of EVs and related charging infrastructure and continued oil substitution in several sectors. The country is also expected to sustain a high rate of growth in adding renewable electricity generation capacity to meet growing demand for electricity and substitute coal in the power sector.
These expectations are present in projections for global and regional oil demand in the period to 2030, as outlined in Table 3.1 and Figure 3.1.
| Medium-term oil demand by region mb/d | ||||||||||||
|---|---|---|---|---|---|---|---|---|---|---|---|---|
| 2024 | 2025 | 2026 | 2027 | 2028 | 2029 | 2030 | Growth 2024–2030 | |||||
| OECD Americas | 24.9 | 25.0 | 25.1 | 25.3 | 25.4 | 25.6 | 25.7 | 0.8 | ||||
| OECD Europe | 13.5 | 13.5 | 13.5 | 13.5 | 13.6 | 13.6 | 13.6 | 0.1 | ||||
| OECD Asia-Pacific | 7.2 | 7.2 | 7.2 | 7.2 | 7.3 | 7.3 | 7.3 | 0.1 | ||||
| OECD | 45.7 | 45.8 | 45.8 | 46.0 | 46.3 | 46.5 | 46.6 | 1.0 | ||||
| China | 16.7 | 16.9 | 17.1 | 17.4 | 17.7 | 18.1 | 18.3 | 1.7 | ||||
| India | 5.6 | 5.7 | 6.0 | 6.3 | 6.6 | 7.0 | 7.3 | 1.8 | ||||
| Other Asia | 9.7 | 9.9 | 10.2 | 10.5 | 10.8 | 11.1 | 11.4 | 1.7 | ||||
| Latin America | 6.8 | 6.9 | 7.0 | 7.2 | 7.4 | 7.6 | 7.8 | 1.0 | ||||
| Middle East | 8.8 | 8.9 | 9.1 | 9.3 | 9.5 | 9.7 | 10.0 | 1.2 | ||||
| Africa | 4.6 | 4.7 | 4.8 | 4.9 | 5.0 | 5.1 | 5.2 | 0.7 | ||||
| Russia | 4.0 | 4.0 | 4.1 | 4.1 | 4.2 | 4.2 | 4.2 | 0.2 | ||||
| Other Eurasia | 1.3 | 1.3 | 1.3 | 1.4 | 1.4 | 1.4 | 1.4 | 0.2 | ||||
| Other Europe | 0.8 | 0.8 | 0.8 | 0.8 | 0.9 | 0.9 | 0.9 | 0.1 | ||||
| Non-OECD | 58.0 | 59.2 | 60.4 | 61.9 | 63.5 | 65.1 | 66.7 | 8.6 | ||||
| World | 103.7 | 105.0 | 106.3 | 107.9 | 109.8 | 111.6 | 113.3 | 9.6 | ||||
Table 3.1 Medium-term oil demand by region
Source: OPEC.
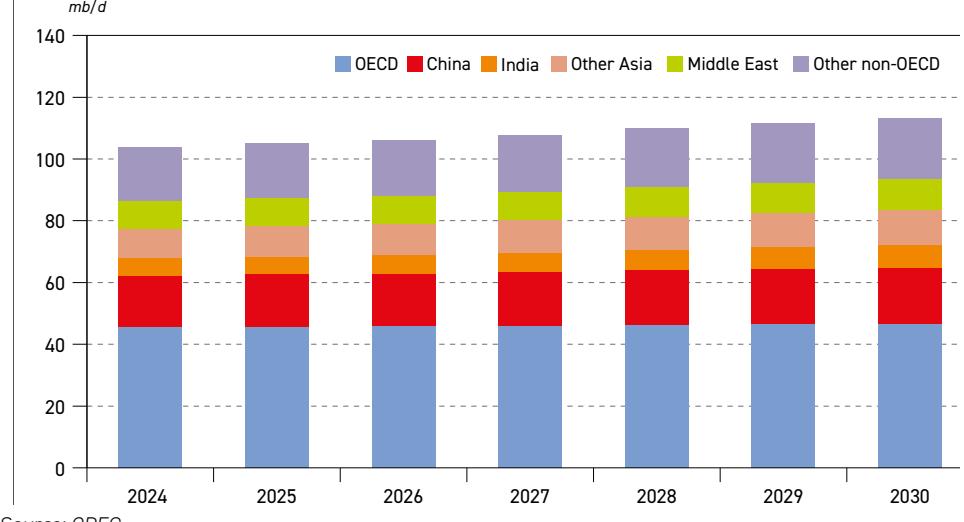
Figure 3.1 Meditum-term oil demand by region
Source: OPEC.
At the global level, oil demand is set for continued robust growth of 9.6 mb/d over the medium-term period, rising from 103.7 mb/d in 2024 to 113.3 mb/d by 2030. This represents an average annual increase of 1.6 mb/d. The primary reason for this pattern is strong demand growth in non-OECD countries, where annual incremental demand is projected at 1.4 mb/d on average, with almost no signs of decelerating growth during this period.
Contrary to the OECD oil demand pathways outlined in the past few outlooks, current projections show continued growth in this region, for the reasons highlighted earlier. While this growth is relatively modest – in the range of 0.1 mb/d to 0.2 mb/d p.a. – it adds to the overall demand increase rather than offsetting part of the non-OECD growth.
As presented in Figure 3.2, the net effect of these trends still offers a somewhat contrasting picture between strong non-OECD demand growth and rather stagnating OECD demand over the medium term. Indeed, non-OECD oil demand is projected to increase by 8.6 mb/d between 2024 and 2030 to reach a level of 66.7 mb/d, while OECD demand is projected to add an additional 1 mb/d. Moreover, OECD Americas accounts for a large majority of the OECD growth, increasing by 0.8 mb/d, whereas the other two OECD regions are set to oscillate around their current levels before experiencing a marginal demand decline towards the end of the medium term.
The period beyond 2030 will likely be marked by a gradual departure in the two major trends that characterize the medium-term period. Firstly, the effects of recent shifts in energy policies and priorities in developed countries are expected to gradually diminish, deferred investments in EVs will likely gradually take place and further technological progress and cost reduction are set to accelerate efficiency improvements and oil substitution, especially by electricity and gas.
The most visible impact comes from the gradual penetration of EVs in the road transportation sector and the penetration of alternative fuels in the marine (mainly LNG) and aviation sectors (biofuels and synthetic fuels). Some oil displacement is also expected to take place in the

Figure 3.2 Incremental oil demand by region, 2024–2030
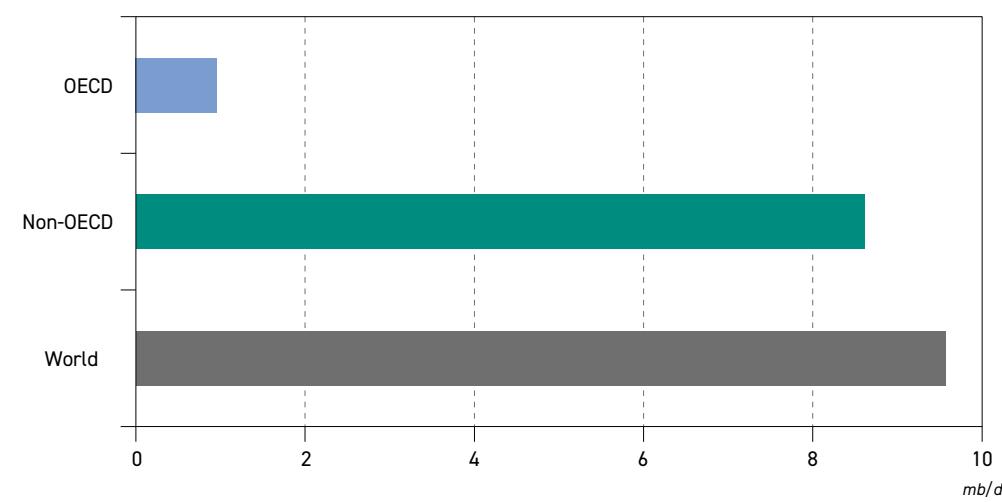
Source: OPEC.
residential and industrial sectors, where oil-based heating systems are set to be replaced by heat pumps and gas ovens. Finally, a further reduction in oil demand in this region is also projected in the power sector. Besides policy and technology, long-term OECD demand will also be adversely impacted by a rather static, but ageing population, and relatively low longterm economic growth.
As a result, OECD demand growth is set to gradually cease and revert to a slow, albeit long decline. As presented in Table 3.2, the OECD witnesses a gradual demand decline to around
Table 3.2 Long-term oil demand by region
| 2024 | 2030 | 2035 | 2040 | 2045 | 2050 | Growth 2024–2050 | |
|---|---|---|---|---|---|---|---|
| OECD Americas | 24.9 | 25.7 | 25.5 | 24.3 | 23.0 | 21.9 | –3.0 |
| OECD Europe | 13.5 | 13.6 | 12.7 | 11.6 | 10.6 | 9.8 | –3.7 |
| OECD Asia-Pacific | 7.2 | 7.3 | 6.8 | 6.3 | 5.8 | 5.4 | –1.8 |
| OECD | 45.7 | 46.6 | 45.0 | 42.2 | 39.5 | 37.2 | –8.5 |
| China | 16.7 | 18.3 | 18.9 | 18.9 | 18.8 | 18.4 | 1.8 |
| India | 5.6 | 7.3 | 8.9 | 10.5 | 12.1 | 13.7 | 8.2 |
| Other Asia | 9.7 | 11.4 | 12.6 | 13.5 | 14.3 | 15.0 | 5.3 |
| Latin America | 6.8 | 7.8 | 8.6 | 9.1 | 9.5 | 9.7 | 3.0 |
| Middle East | 8.8 | 10.0 | 11.1 | 12.1 | 12.9 | 13.5 | 4.7 |
| Africa | 4.6 | 5.2 | 6.0 | 6.9 | 7.8 | 8.8 | 4.2 |
| Russia | 4.0 | 4.2 | 4.3 | 4.2 | 4.2 | 4.1 | 0.1 |
| Other Eurasia | 1.3 | 1.4 | 1.5 | 1.6 | 1.6 | 1.6 | 0.4 |
| Other Europe | 0.8 | 0.9 | 0.9 | 0.9 | 0.9 | 0.8 | 0.0 |
| Non-OECD | 58.0 | 66.7 | 72.8 | 77.8 | 82.1 | 85.7 | 27.7 |
| World | 103.7 | 113.3 | 117.9 | 120.0 | 121.6 | 122.9 | 19.2 |
Source: OPEC.
3
mb/d
42 mb/d by 2040, and then even further to slightly above 37 mb/d at the end of the outlook period. This represents an overall demand decline of 8.5 mb/d, compared to 2024.
Non-OECD oil demand, however, is not expected to peak any time soon. Instead, it is projected to keep expanding over the entire outlook period. The non-OECD demand increase of 8.6 mb/d between 2024 and 2030 is expected to more than double in the period beyond 2030, driven by rising population growth and urbanization, as well as continued robust economic growth that averages 3.6% p.a. This will enable a strong expansion of the middle class, which in turn will foster greater car ownership and ensure more propensity for both international and domestic travel that supports expanding oil demand in the road and aviation sectors. Moreover, economic development will also lead to an expanding fleet of commercial vehicles, including a higher share of trucks, buses and agricultural machines, all primary driven by oil products. Finally, strong demand for petrochemical products, a shift from the traditional use of biomass to LPG and growing maritime trade are also set to contribute to the region's continued demand growth.
In short, oil demand in the OECD and non-OECD is set to follow divergent trajectories in the period after 2030, as continued growth in the non-OECD stands in stark contrast to declining OECD demand. However, non-OECD demand growth is set to far outweigh the OECD decline, such that this Outlook sees global oil demand reaching a level of almost 123 mb/d in 2050, more than 19 mb/d higher than in 2024.
The second difference between the medium- and long-term periods is a gradual slowdown in global demand growth. This is clearly demonstrated in Figure 3.3. As mentioned earlier in this chapter, annual oil demand growth in all Outlook regions – with the exception of China – is expected to either remain relatively stable or even marginally accelerate over the medium term, with average incremental demand of around 1.6 mb/d. This, however, changes in the long term. Annual growth is then projected to slow to 0.9 mb/d over the next five years, and further to around 0.3 mb/d over the last decade of the forecast period. One reason contributing to this lower growth is the OECD shifting to negative growth at some point between 2030 and
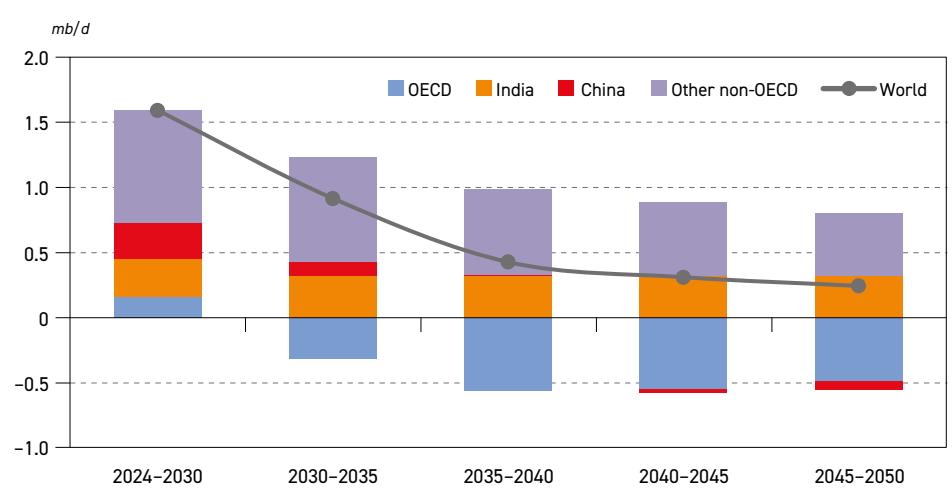
Figure 3.3

Average annual oil demand growth by region, 2024–2050
Source: OPEC.
2035. A similar trend reversal is also projected for China, although the shift from positive to negative growth will likely materialize much later, sometime after 2040.
Moreover, decelerating demand growth is also projected for several non-OECD regions. This is especially the case for Other Asia, Latin America and the Middle East. After an initial period of strong growth during the first half of the forecast period, oil demand in these regions is set to mature on the back of slower economic growth and less dynamic demographic developments. In contrast, demand growth in India is anticipated to gradually accelerate from an initial range of 0.2 mb/d p.a. to more than 0.3 mb/d p.a. by 2030 and retain this momentum for the rest of the outlook period. In addition to India, Africa is also expected to increasingly become a source of incremental oil demand due to its dynamic economic development, rising urbanization and industrialization, the substitution of biomass by LPG and the rapid expansion of transport services.
3.1.1 OECD
The previous section highlighted important shifts in the energy policies of OECD countries, which, in combination with other factors, will likely steer future oil demand. In addition to the policy setup, economic activity will play a significant role over all timeframes, with other factors typically requiring a longer time to have a measurable impact. Height: 65 mm
Last year's Outlook saw OECD oil demand flipping from positive to negative growth by 2028, with OECD Europe and OECD Asia-Pacific shifting into negative trajectory by 2026. However, a combination of slightly more optimistic economic growth, further shifts in energy policy and a slower-than-expected penetration of EVs in this Outlook help stabilize oil demand around current levels in both OECD Europe and OECD Asia-Pacific over the medium term. Indeed, as presented in Table 3.2 and Figure 3.4, the overall demand change in these two regions is almost negligible between 2024 and 2030, before other factors increasingly come into play and lead to declining demand.
Figure 3.4 OECD oil demand by region, 2024–2050
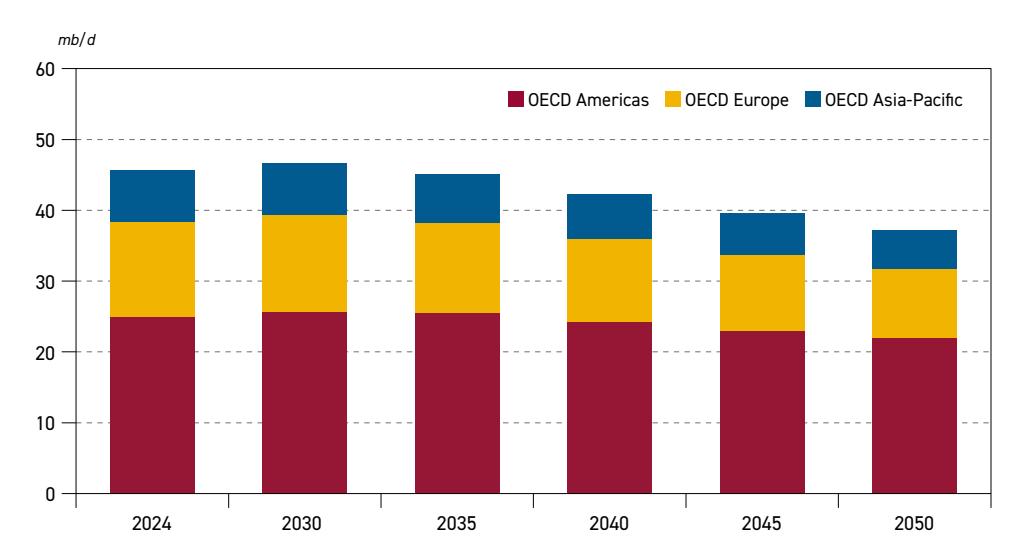
Source: OPEC.
In the case of OECD Americas, previous projections saw continued demand growth for several years and indicated that a turning point for this region could materialize around 2030. However, due to a substantial change in sentiment towards the continued use of hydrocarbons in the US and slightly improving economic conditions, oil demand in OECD Americas is set to expand over the medium term and reach a level of 25.7 mb/d by 2030, around 0.8 mb/d higher than in 2024. This represents average annual incremental demand of slightly above 0.1 mb/d, which will likely turn to negative growth sometime between 2030 and 2035.
This gradual reversal – from stabilized to marginally growing demand in OECD regions over the medium term to declining demand after 2030 – is the main feature of the long-term projections for these regions. At the OECD level, after an initial increase to 2030, oil demand is expected to drop from 46.6 mb/d in 2030 to 37.2 mb/d in 2050. This represents an overall demand decline of 8.5 mb/d. The largest demand decrease is projected for OECD Europe, at 3.7 mb/d between 2024 and 2050. This represents a drop of around 28% over this period. OECD Americas sees a somewhat lower demand drop – 3.0 mb/d in absolute terms and 12% in relative terms. The lowest overall demand decline is projected for OECD Asia-Pacific at 1.8 mb/d. However, due to a much lower base demand in 2024, this decline is comparable to OECD Europe in relative terms, as it represents around 25% of the base demand. Width: 135.6 mm Height: 65 mm
In addition to the main reasons for the long-term OECD demand trajectory outlined earlier in this chapter, Figure 3.5 provides further insight from a sectoral perspective. Undoubtedly, the key sector contributing to the overall demand decline in the OECD is road transportation, which is expected to account for more than 80% of the decline – almost 7 mb/d on a volume basis.
Significant changes are also projected in 'other sectors', mainly due to developments in the residential, industrial and commercial sectors. Oil demand in the combined 'other sectors' Figure 3.6
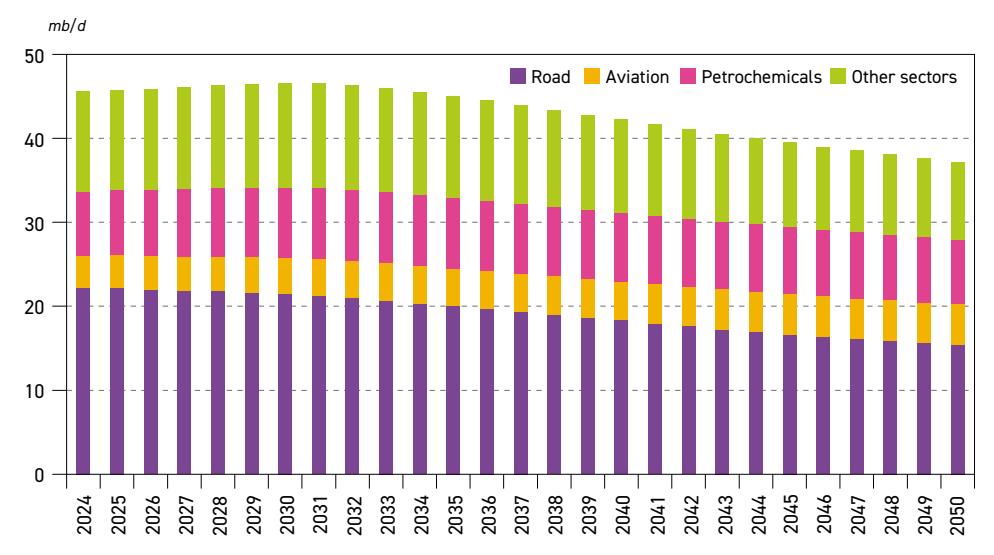
Figure 3.5 OECD oil demand by sector, 2024–2050
Source: OPEC.

is anticipated to drop by 2.7 mb/d between 2024 and 2050. The greatest potential for longterm demand reduction exists in the residential (–1 mb/d) and industrial (–0.5 mb/d) sectors. This is mainly due to tighter building codes, oil substitution by heat pumps in older buildings and better insulation. Oil demand in industry is expected to be largely affected by more efficient technology and replacement by electricity, natural gas and, potentially – at a later stage – hydrogen.
In the Outlook's sectoral classification, industry excludes petrochemicals. The OECD oil demand trajectory for petrochemicals is set to largely mirror that of US tight oil production, a source of ethane and LPG that are primary feedstocks for this industry in the US. Accordingly, demand in this sector is expected to grow until around 2035 and then start a slow decline for the rest of the forecast period, reaching a level of 7.7 mb/b by 2050, close to its demand level in 2024. The only sector where OECD demand is anticipated to keep expanding over the entire forecast period is aviation; this sector therefore partly offsets declines elsewhere. Even in this sector, however, overall growth is set to be rather limited, adding around 1.0 mb/d between 2024 and 2050.
In terms of road transportation, expected fuel efficiency improvements and the growing penetration of EVs are expected to propel the future demand decline. Fuel efficiency improvements are primarily driven by technology developments, but policy setups also play a role in pushing automakers to further advance technology. In this respect, the strictest policies exist in the EU. The region currently requires corporate average emissions of 93.6 g CO2/km for new cars registered within a year. This limit should tighten to 49.5 g CO2/km by 2030, which is almost impossible to achieve without a significant share of EVs that count as zero emission vehicles. Moreover, current policies still assume that no ICE cars will be allowed to be registered by 2035.
As mentioned in the previous section, the current emissions target has been softened by extending the calculation period to 2025–2027, which provides automakers with more leeway to adapt and make necessary investments. This Outlook assumes that these EU emissions targets will be softened further, and that the ICE ban on new registrations will eventually be deferred to a later date.
Similar, albeit less stringent regulations, also exist in other OECD countries. In Japan, these are set as fuel efficiency targets using the most efficient vehicles currently on the market as a benchmark (also called the Top Runner Programme). At present, the current target is to achieve fuel efficiency of 25.4 km/l by 2030. These standards are somewhere between the EU and US targets. In the US, regulations are governed by CAFE standards, with the current target of 49 miles per gallon (mpg) on average to be reached by 2026. However, these standards were set by the previous Administration, and it is unlikely that they will remain in place. More importantly, there are strong expectations that CAFE standards for the model years 2027–2031 (to reach 50.4 mpg by 2031) will also see revisions, with the current Administration initiating efforts to reconsider and potentially roll back these standards.
Despite this, it is clear that car efficiency improvements will progress and contribute to declining oil demand in the road transport sector. However, the experience in OECD countries shows that part of this improvement can be offset by consumers' shift to larger vehicles (especially SUVs); hence, the net effect is typically lower than expected, albeit still significant.

The second main reason relates to the growing penetration of EVs. Despite the fact that EV sales in the OECD have fallen behind initial expectations, and projections are being revised downward – as is also the case in this Outlook – the gradual substitution of ICE vehicles will increasingly play a role, especially in the long term. Bearing in mind the large uncertainties regarding future support to EVs, the total number of vehicles in the OECD is projected to increase by around 108 million between 2024 and 2050, while the number of EVs is set to increase by 267 million over the same period. However, the replacement of ICE vehicles is focused on the segment of passenger vehicles, with the commercial vehicle parc (with higher average fuel consumption per vehicle) expected to keep growing. Therefore, the net oil demand effect is set to be less than the simple proportion in the decline of the number of ICE vehicles.
The displacement of around 185 million ICE-based passenger vehicles from OECD roads will primarily affect gasoline demand. As presented in Figure 3.6, this product (including both oilbased gasoline and ethanol) is set to gradually decline from more than 14 mb/d in 2024 to 13.2 mb/d in 2035 and further to 10.7 mb/d by 2050. The increased penetration of EVs is also expected to partly affect diesel demand (again, including oil-based diesel and biodiesel), though a larger part of its decline is linked to a combination of developments in the residential sector, industry and marine transport. The combined effect is that OECD demand for diesel is set to decline even more than gasoline, namely by 3.8 mb/d between 2024 and 2050. Width: 135.6 mm Height: 65 mm
Demand for naphtha is almost exclusively linked to the petrochemical industry, where it typically provides a baseload. Given this, the product sees a relatively stable outlook for its demand in the OECD, marginally growing from 2.8 mb/d in 2024 to 3.1 mb/d by 2030 and oscillating around this level for the rest of the forecast period. Demand for ethane/LPG is more diverse (specifically its LPG component), including for the residential, industrial and road transport sectors, and exhibits more fluctuations. Driven by large, mostly ethane-based petrochemical projects in the US, OECD demand for this product is set to increase by more than 0.6 mb/d over the medium-term period, but then decline thereafter. Its long-term decline is partly related to the petrochemical industry, but the trend is exacerbated by LPG substitution in other sectors. Figure 3.6
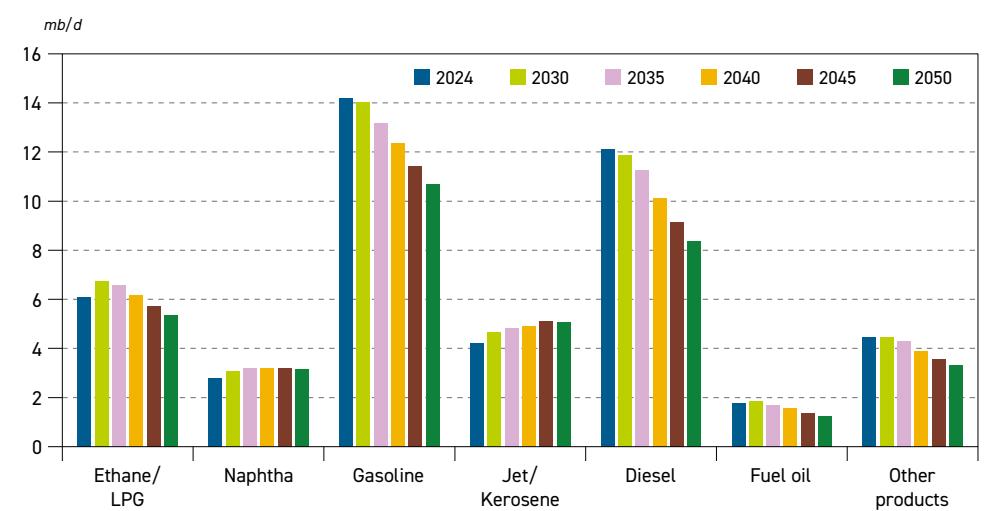
Figure 3.6 OECD oil demand by product, 2024–2050

Source: OPEC.
Fuel oil demand is also expected to decline in the long term. Its use is set to be almost completely displaced in the power sector, with the exception of electricity generation within the refinery gates. Some substitution by LNG is also expected in the marine transport and industrial sectors, leading to an expected cumulative demand decline of around 0.5 mb/d over the forecast period.
A much larger scope for demand reduction exists in the category of 'other products'. The need for fewer new roads in the future, lower refinery runs in OECD regions and the partial substitution by synthetic lubricants are set to drive demand for 'other products' to 3.3 mb/d by 2050, compared to 4.4 mb/d in 2024. In contrast, OECD demand for jet/kerosene is projected to increase by 0.9 mb/d over the forecast period. This is primarily driven by growing demand in the aviation sector, although part of this growth is expected to be offset by lower demand for domestic kerosene across all OECD regions.
3.1.2 Non-OECD
Non-OECD oil demand increased by 1.5 mb/d in 2024, driven primarily by robust growth in developing Asia. These countries, led by China and India, accounted for around 60% of the overall demand increase in the non-OECD. At the same time, 2024 also featured important structural changes in the composition of this growth. While China accounted for more than half of non-OECD growth in 2023 (adding 1.3 mb/d), its contribution declined to around 20% (0.3 mb/d) in 2024, primarily due to ongoing structural economic shifts and the increased adoption of alternative energy sources. India's demand growth in 2024 was broadly unchanged from 2023, at around 0.2 mb/d. The largest contribution to incremental demand came from Other Asia, with this group of countries witnessing an expansion of 0.4 mb/d in 2024.
To a large extent, the shifts observed during 2024 provide demand trends for the medium term, as presented in Figure 3.7 and Figure 3.8. Figure 3.7 clearly shows that non-OECD oil demand will continue its steady growth over the medium-term period with an average annual increase Figure 3.7
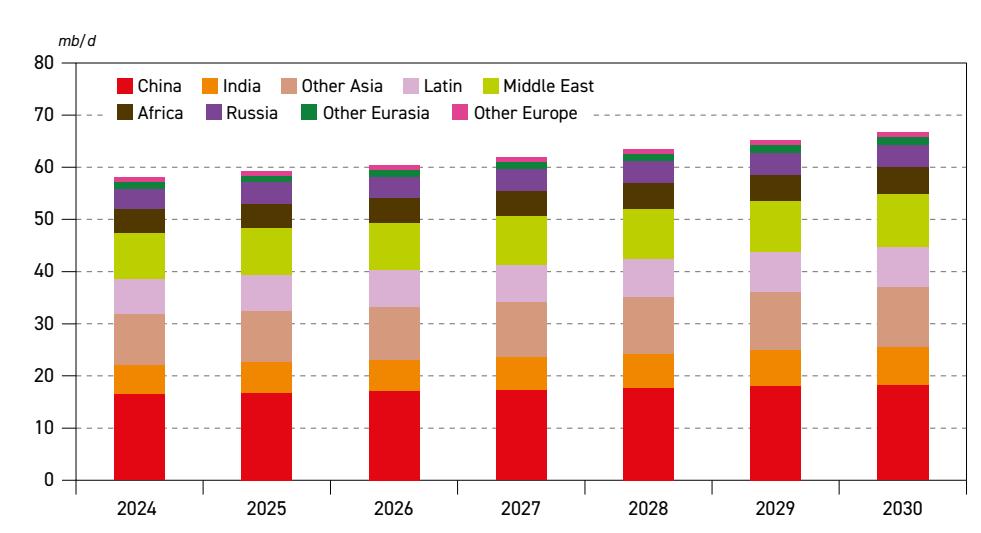
Figure 3.7 Non-OECD oil demand by region, 2024–2030
Source: OPEC.
World Oil Outlook 2025 Organization of the Petroleum Exporting Countries
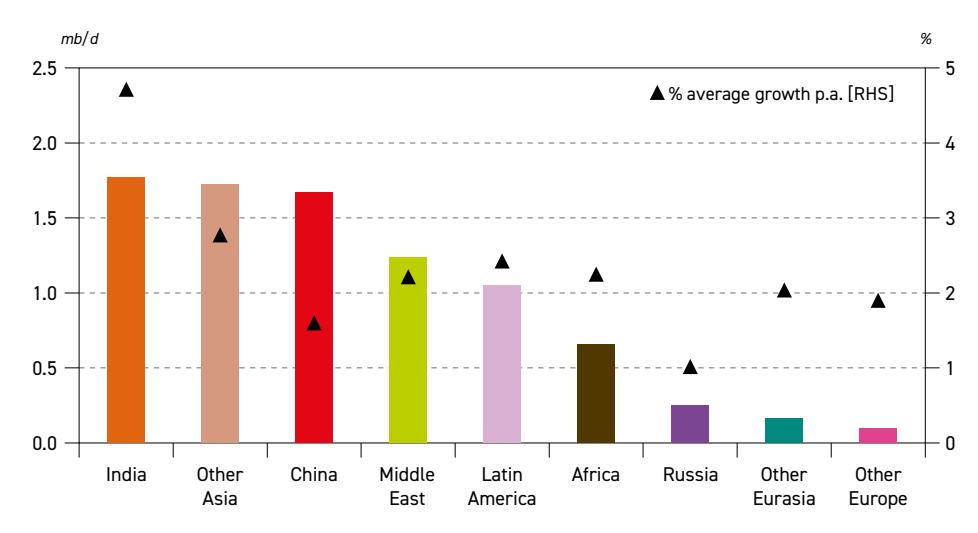
Figure 3.8 Non-OECD oil demand growth by region, 2024–2030
Source: OPEC.
of 1.4 mb/d. This is driven by continued industrialization, strong growth in petrochemicals production, a rising middle class and related expansion of the vehicle fleet and air transport, and better energy access and living standards for millions. The expected robust growth is set to bring the region's oil demand to a level of 66.7 mb/d by 2030, which is 8.6 mb/d higher than in 2024. It is important to note that demand is projected to rise in all non-OECD subregions, albeit at varying paces.
The main source of oil demand growth over the medium term is India, with consumption even seeing a gradual acceleration. As presented in Figure 3.8, the expected cumulative demand increase in this country is 1.8 mb/d between 2024 and 2030. This projection reflects recent developments in the country, with sound foundations for future growth being laid down. Vehicle sales in India are witnessing strong growth, supported by governmental initiatives to expand the necessary infrastructure, such as the Bharatmala Pariyojna, which focuses on extending highways. Moreover, India is becoming one of the world's fastest-growing aviation markets, with a steadily rising number of domestic and international airports. Other initiatives, such as the Sagarmala Programme (focusing on ports), are also contributing to rising oil demand. In short, India's economic expansion, transportation boom and industrialization are set to drive oil demand growth not only over the next five years, but also well beyond.
A similar set of drivers also applies to most large developing countries in Asia, including Indonesia, the Philippines, Malaysia and Vietnam. Rapid urbanization, a rising middle class, industrial and manufacturing growth, expanding aviation and tourism, as well as growing refining and petrochemical sectors, support expected steady oil demand growth in this region. As a result, Other Asia is projected to maintain its annual demand increase of around 0.3 mb/d over the medium term, thus adding 1.7 mb/d to overall incremental demand.
The narrative for China's oil demand outlook is somewhat different. For more than 20 years, China has been the main driving force behind expanding oil demand. While its demand growth is still significant, projections indicate a slow but steady deceleration. This is already present in medium-term projections that show China's demand growth stagnating at around

0.3 mb/d p.a. and gradually declining thereafter. The expected deceleration is not seen as dramatic, but in the long term it is expected to continue leading to oil demand peaking in China at some point around 2040. Despite this, it should be noted that China's oil demand is set to increase by a solid 1.7 mb/d in the period to 2030, meaning that it is the third largest contributor to global demand growth.
Continued demand growth is also projected in other non-OECD regions, albeit at relatively lower levels. Demand additions in the Middle East and Latin America are projected to be 1.2 mb/d and 1 mb/d, respectively. Africa's demand is expected to increase by 0.7 mb/d over the medium term, while the lowest incremental demand is projected in Russia, Other Eurasia and Other Europe, all below 0.3 mb/d. It is important to note, however, that this order changes when considering a comparison in relative terms. In this case, India, Other Asia and Africa are the regions with the fastest average annual growth over the medium term. While demand growth in Other Asia is expected to decelerate in the later period, India and Africa are set to be at the forefront in terms of long-term demand growth.
This observation is clearly visible in Figure 3.9, which presents a summary of non-OECD regional demand growth in the period from 2030 to 2050. It shows that India will likely add more than 6 mb/d of incremental demand during this period, as factors driving its mediumterm demand largely extend their role for the rest of the forecast period. Moreover, significant demand increases are also projected in Africa, Other Asia and the Middle East, each adding around 3.5 mb/d to global demand growth. The increased use of oil products in all these regions is assumed to help improve the living conditions of millions in relation by providing access to affordable energy, fostering industrial growth and expanding all transportation options. The combined demand in these four regions is set to increase by more than 17 mb/d between 2030 and 2050, and close to 23 mb/d compared to 2024.
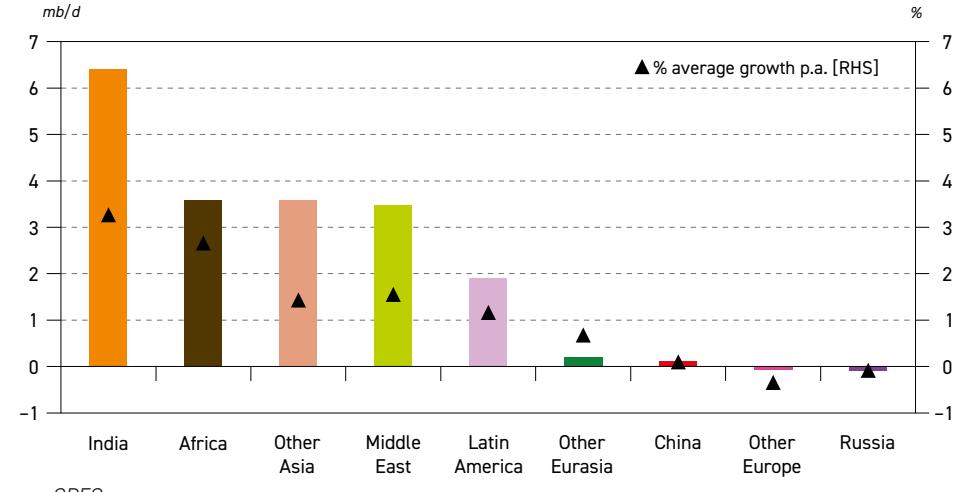
Figure 3.9 Non-OECD oil demand growth by region, 2030–2050
Source: OPEC.
Some demand additions are also projected for Latin America (1.9 mb/d), Other Eurasia (0.2 mb/d) and China (0.1 mb/d) between 2030 and 2050, although, as already noted, China is set to observe demand peaking around 2040. The same observation is also valid for the

remaining non-OECD regions, Russia and Other Europe, although demand in these two regions will likely peak sooner, leading to a marginal decline in demand levels at the end of the forecast period compared to 2030.
Figure 3.10 provides an overview of non-OECD oil demand from a sectoral perspective. It shows that the key sector with the highest demand level and largest incremental demand over the forecast period is road transportation. This sector is expected to account for more than 40% of the overall non-OECD demand increase, adding more than 12 mb/d between 2024 and 2050. This substantial growth is the result of an expectation that non-OECD vehicle fleets will more than double during this period, growing from an estimated 930 million vehicles in 2024 to more than 2 billion in 2050. Even though almost 300 million of these vehicles will be electric, the majority of them are anticipated to use gasoline, diesel and LPG (more details on this are provided in section 3.2.1).
Figure 3.10 Non-OECD oil demand by sector, 2024–2050
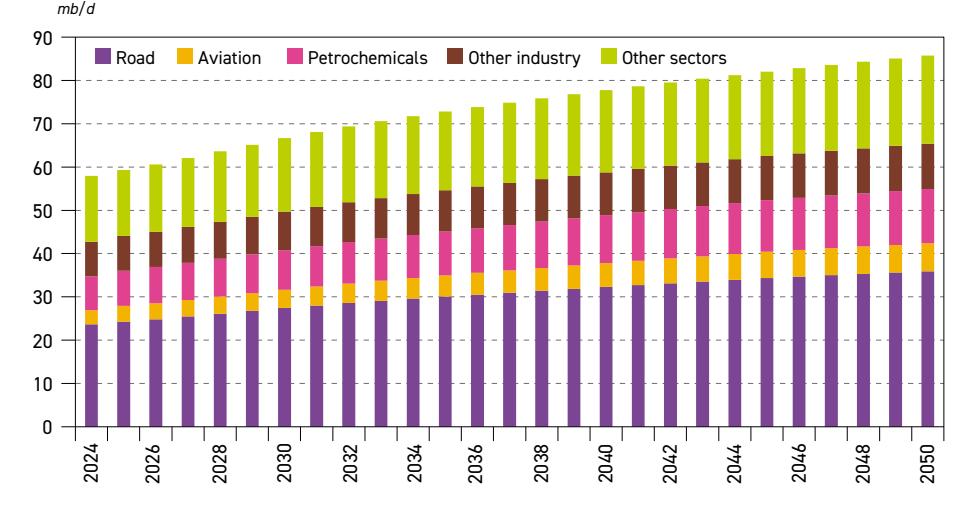
Source: OPEC.
Besides road transportation, the petrochemical sector is also expected to see a substantial demand increase, mainly in Asia and the Middle East, on the back of a number of large petrochemical projects and rising demand for petrochemical products (more details are included in section 3.2). As a result, oil demand in this sector is set to rise from close to 8 mb/d in 2024 to 12.5 mb/d by 2050, adding around 4.6 mb/d of incremental demand over this period.
Demand additions in other sectors will likely be smaller, but still significant. The combined residential and agriculture sectors are projected to contribute 3.3 mb/d, and the aviation sector 3.2 mb/d, over the forecast period. Even slower demand growth is expected in industry and other sectors. Nonetheless, their cumulative effect totals more than 4 mb/d of incremental demand in the non-OECD between 2024 and 2050.
Figure 3.11 provides an overview of non-OECD oil demand from the perspective of major refined products. The largest demand increase, of more than 8 mb/d between 2024 and 2050,
is projected for diesel, as this product will be supported by a strong increase in the commercial vehicle fleet, as well as by expanding industrial and agricultural activity in this region. Large demand growth is also projected for gasoline, which is set to increase by 6.6 mb/d over the forecast period, almost entirely linked to the growing fleet of passenger cars. This fleet is set to increase from less than 770 million cars in 2024 to almost 1.6 billion in 2050.
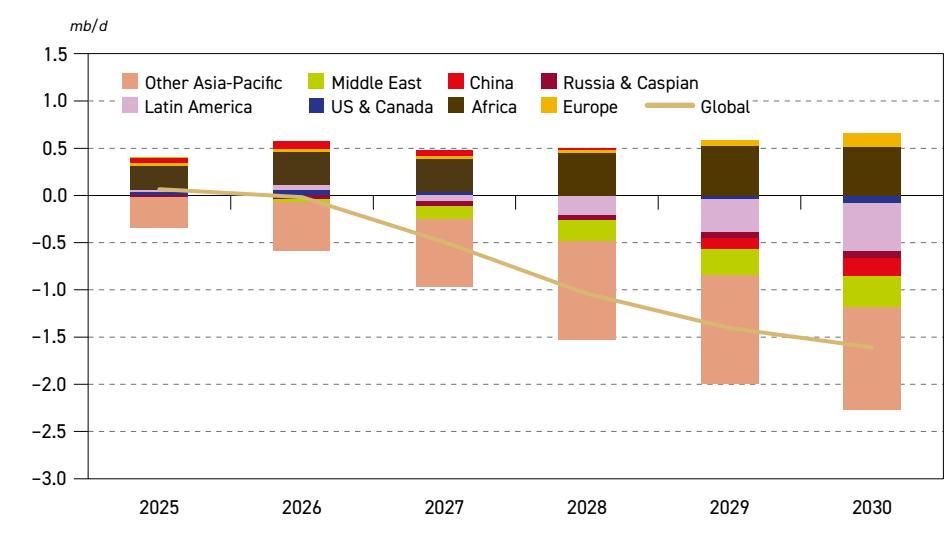
Figure 3.11 Non-OECD oil demand by product, 2024–2050
Source: OPEC.
Moreover, growing petrochemical production and an expanding residential sector will support demand for ethane/LPG and naphtha. Non-OECD demand for ethane/LPG will increase by more than 4 mb/d between 2024 and 2050, while naphtha will add another 2.4 mb/d to incremental demand during the same period. In a similar vein, growing demand for jet/kerosene (+3.3 mb/d) will be supported by developments in the aviation and residential sectors. Somewhat lower but still significant demand increases are projected for fuel oil (+1.1 mb/d) and 'other products' (+1.9 mb/d).
India
Global population demographics witnessed a turning point in 2022, when India overtook China as the world's most populous country. In 2024, its population reached 1.45 billion. Moreover, India's population growth is expected to continue rising steadily throughout the forecast period, with an estimated increase of 229 million people between 2024 and 2050.
While India and China are currently comparable in population size, their foreseeable demographic patterns throughout the forecast period diverge significantly. China's working population and fertility rates have been on a steady decline since 2015. Except for a relatively short period of stabilization over the next few years, this trend is expected to continue in the long term, with an estimated loss of around 239 million from China's working population by 2050, compared to 2024. India's current population, in contrast, is made up of approximately 50% under the age of 25.

This is set to invigorate India's workforce, adding an additional 144 million workers to the working-age population over the forecast period, bringing the total workforce to a staggering 1.13 billion people by 2050. Spurred in part by this surge, as well as a rising middle class, an increased urbanization rate and government support, India's medium-term annual GDP growth rate is estimated at an average of 6.4% from 2024 to 2030, and is set to remain well above 5% p.a. even during the last decade of the forecast period.
Another significant contrast between the two nations lies in their respective urbanization rates. China witnessed an impressive jump from 36% at the start of the 21st century to nearly 65% in 2024. In contrast, India has consistently reported a lower urbanization rate, at only 36% in 2024. This rate is lower than developed and most developing countries. This general trend is expected to persist throughout the long term, albeit with some acceleration that is set to see India reach the 50% urbanization mark by 2050. This growth will, in part, be facilitated by the implementation and expansion of the 'Smart Cities Mission', an initiative focused on expanding affordable housing and rapid transport systems in larger cities. India's heightened urbanization rate will be a necessary development in order to accommodate its population growth and, combined with the rise of the middle class, will lead to additional demand for modern energy sources, in particular oil. Width: 135.6 mm Height: 65 mm
Figure 3.12 translates the potential impact of these socio-economic developments on India's future oil demand at the sectoral level. Total oil demand in India is set to increase by 8.2 mb/d over the outlook period, rising from 5.6 mb/d in 2024 to 13.7 mb/d by 2050. Although an increase in overall oil demand is expected across most sectors, road transportation is projected to witness the most significant growth, rising from 2.3 mb/d in 2024 to 6.9 mb/d in 2050, an increase of 4.6 mb/d. Several factors are set to impact this growth, the most salient being the exponential expansion of India's passenger car fleet from around 50 million in 2024 to more than 240 million in 2050 (excluding two-wheelers). Furthermore, spurred by economic growth, commercial vehicles are expected to increase four-fold by 2050. Simultaneously, Figure 3.12
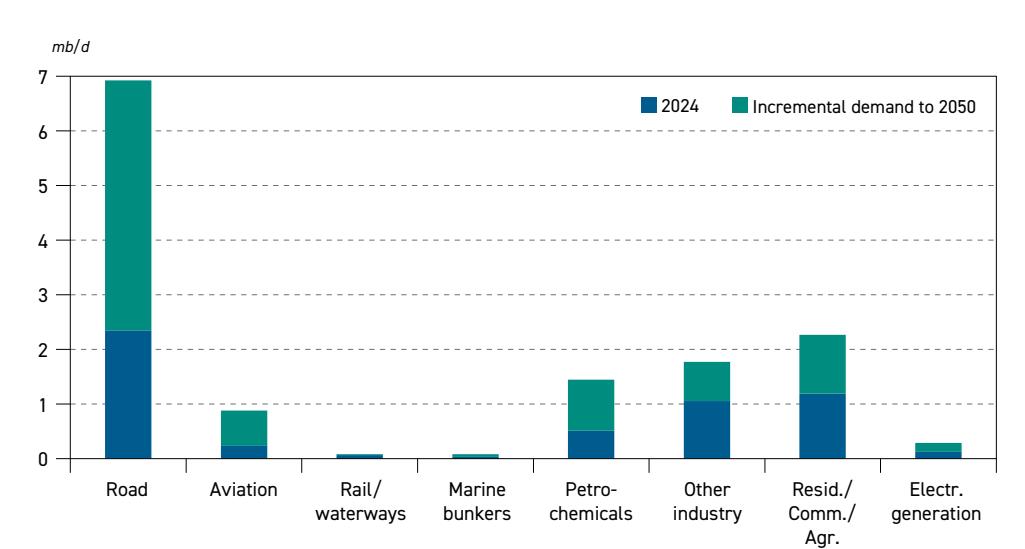
Figure 3.12 Oil demand in India by sector, 2024–2050

Source: OPEC.
OIL DEMAND
the market penetration of EVs in India is likely to remain limited, highlighting the country's expected continued reliance on ICE-powered vehicles and a significant oil demand rise in the road transportation sector.
The sector with the second-largest expected oil demand growth in India is the combined residential, commercial and agricultural sector. Over the forecast period, demand in this sector is expected to increase from 1.2 mb/d in 2024 to 2.3 mb/d by 2050. This growth is attributed to several factors, all closely linked to population growth and urbanization. The agricultural sector is also set to experience further development, ushering in increased use of fertilizer, farming infrastructure and agricultural machines. Needless to say, in addition to incremental oil demand, the sector's expansion will also require additional energy sources, such as electricity and natural gas.
Significant growth is also expected in the petrochemical sector, which is expected to increase from 0.5 mb/d to 1.4 mb/d between 2024 and 2050. This is due to rising demand for a variety of petrochemical products, primarily driven by an expansion in construction and industrial production, an expanding agricultural sector, as well as increased plastics demand. A variety of petrochemical projects are scheduled to come online in the coming years, not only further enhancing oil demand, but also placing India at the forefront of petrochemical projects in Asia. Approximately one-third of all related projects in Asia are slated for India in the next ten years.
Oil demand growth in India's aviation sector is also increasing at a rapid pace and is expected to reach 0.9 mb/d by 2050. Spurred by a booming middle-class, rapid change has already taken place, with a doubling in the number of airports over the last decade, and ambitious plans to have 220 operational airports and heliports by the end of 2025. These efforts to develop and improve India's aviation infrastructure are part of a government-supported initiative to address rising air travel demand, improve affordability for the public, decongest existing airports, and drive tourism and regional development.
Looking at India's demand from the perspective of major refined products, Figure 3.13 highlights the leading role of diesel/gasoil in the product mix. Indeed, approximately 35% of India's total oil demand is attributed to diesel/gasoil, which holds by far the largest share of overall demand. Throughout the forecast period, the share of diesel/gasoil is set to expand to 37% by 2040, before declining slightly to 36% in 2050. Moreover, diesel/gasoil is also set to be the most important source of incremental demand in India, expanding from around 2 mb/d in 2024 to 5 mb/d in 2050. This growth will be primarily driven by the expansion of freight transport and industrial production, and supported by developments in the petrochemical, commercial and agricultural sectors.
Gasoline is also projected to witness a considerable jump in demand over the outlook period, moving from 0.8 mb/d in 2024 to 2.9 mb/d in 2050. This is closely linked to the aforementioned increase in passenger vehicles, as well as the expectation that the reliance on ICE-vehicles will remain stable and continue to dominate market share over EVs. A similar dynamic is expected for jet kerosene in the aviation sector, with expected growth of 0.6 mb/d between 2024 and 2050.
India's petrochemical sector uses naphtha as a primary feedstock; hence, this product is tightly linked to this industry, with demand set to increase from 0.4 mb/d in 2024 to 1 mb/d in 2050. However, growing petrochemical production is also set to partly support the use of

ethane/LPG, the demand for which – combined with the use of LPG in the residential sector – is expected to rise by 1 mb/d over the outlook period.
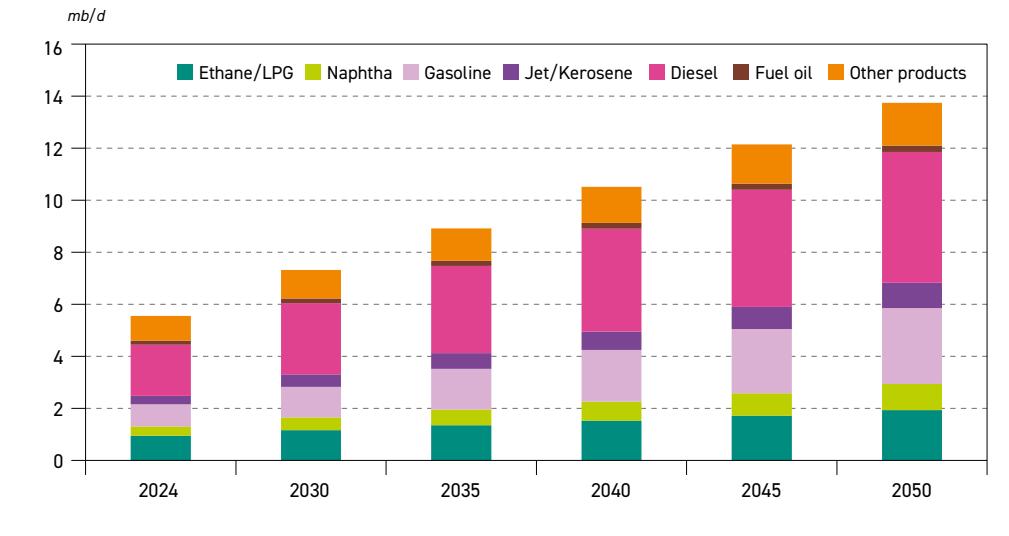
Figure 3.13 Oil demand in India by product, 2024–2050
Source: OPEC.
Compared to other regions, the Indian oil market features somewhat high demand for 'other products', which are mainly bitumen, petroleum coke, lubricants and waxes. Due to the existing relatively high refining capacity, a large part of these products serves as refinery fuels, with the remaining volumes utilized to expand road networks and generate energyintensive goods like cement, aluminium and steel. All of these sectors are set to expand in India; therefore, related oil demand is projected to expand from 1 mb/d in 2024 to 1.6 mb/d in 2050.
Residual fuel oil is the only refined product expected to witness limited growth, moving from 0.1 mb/d in 2024 to 0.2 mb/d by 2050. This is attributed to India's lack of major international bunkering hubs, while the country's electricity sector is predominantly fuelled by coal, natural gas and renewables.
China
After many years of driving global oil demand growth, the leading role of China in oil markets is gradually winding down. Of course, this does not mean a sudden change in its level of oil consumption; instead, it is a sign that the Chinese market is maturing. This is typically associated with lower and decelerating growth until a turning point is reached at some point in the years to come.
At the same time, it could be said that China's demand is becoming more predictable, with its large industrial base built over decades of high economic growth and a populous middle class, both of which will continue to support private consumption for a wide variety of products, including new vehicles, housing construction and domestic and international travel services.
This provides a solid basis for sustained oil demand in related sectors, even though economic growth is expected to decelerate over the forecast period.
One of the most critical signposts relating to demand growth in China is road transportation. As presented in Figure 3.14, road transportation is by far the most important oil consuming sector in China, accounting for around 40% of the country's total oil demand. Moreover, oil demand in this sector has increased by more than 5 mb/d since 2020, providing one of the pillars of China's past demand growth. This pattern, however, is gradually shifting on the back of the progressing substitution of ICE-based vehicles by alternative fuels. The most important contributor to this change is the rise in new EV sales, although China typically uses the broader term of 'new energy vehicles' (NEVs).
Figure 3.14 Oil demand in China by sector, 2024–2050
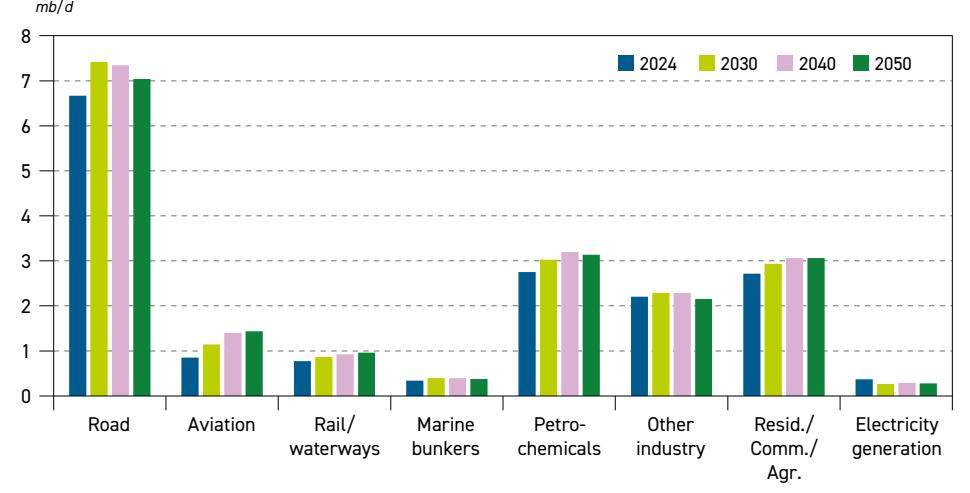
Source: OPEC.
Another important factor affecting slower oil demand growth in China is lower economic growth. In 2024, China's annual GDP growth stood at 5%. This is expected to decline gradually to 4.3% p.a. by the end of the medium term (with average growth of 4.5% p.a.) and further to around 3% in 2040 and 2% in 2050. Part of this slowdown can be attributed to a peaking and, subsequently, declining population, and a shrinking labour force. Moreover, slowing GDP growth is set to be accompanied by a shift from energy- and oil-intensive industries towards a higher share of services and advanced products with greater value-added, such as cars, electronic devices, advanced technology equipment and various appliances.
In turn, this will likely support growing demand for petrochemicals and therefore related oil demand in this sector, which is projected to increase by 0.4 mb/d between 2024 and 2040 before marginally declining for the rest of the forecast period. However, the expected shift to less oil-intensive industries will have a negative impact on 'other industry', where oil demand is set to peak much sooner. Nevertheless, overall demand changes in this sector will likely be minimal and move within a very narrow range around its current level of 2.2 mb/d.

Besides road transport and petrochemicals, China's oil demand is also projected to expand in another two important sectors: aviation and residential/agriculture. In fact, demand in the aviation sector is set to see the largest increase among all sectors, increasing from 0.9 mb/d in 2024 to 1.4 mb/d by 2050. Moreover, despite some growth deceleration in the long term, this will be one of the few sectors where demand is on an expanding trajectory over the entire forecast period, mainly due to fast-growing tourism.
Typically, international flights capture the larger portion of aviation oil demand, but China's growing domestic market is also set to play an important role and support future demand. Local tourism and the transportation of goods are other factors driving demand growth, with these specifically related to the domestic waterways sector. The planned expansion of the country's waterways network and increased traffic is expected to push oil demand higher. However, part of this increase will likely be offset by reduced oil demand in the railway sector due to increased electrification. Thus, demand in the combined waterways and railway sector is set to increase by only around 0.2 mb/d between 2024 and 2050.
Finally, moderate demand growth is also expected in the combined residential, commercial and agricultural sector. This is largely supported by steady demand growth in agriculture. Overall, incremental demand is just 0.3 mb/d between 2024 and 2050. Nevertheless, a demand level of 2 mb/d to 3 mb/d in this sector contributes to the 'baseload' of China's future oil demand.
The overall effect of these sectoral developments is that China's oil demand is expected to increase from 16.7 mb/d in 2024 to 18.4 mb/d in 2050, representing an overall demand increase of 1.8 mb/d. The largest part of this demand increase is set to materialize during the medium term, while the remaining part of the forecast period will likely be marked by demand plateauing at a level above 18 mb/d.
With respect to major refined products, diesel/gasoil demand is expected to strengthen its role as the major component in China's product slate, growing from 4.1 mb/d in 2024 to 4.8 mb/d in 2050. This increase is mainly linked to the expanding fleet of commercial vehicles and supplemented by growing demand in agriculture and domestic waterways. Driven by developments in the aviation sector, jet/kerosene demand is also set to experience corresponding growth, while naphtha demand is expected to follow expansion in the petrochemical sector, as China's petrochemical industry largely uses naphtha as a feedstock.
Other refined products are anticipated to see a temporary demand increase, primarily during the medium term, and then stable-to-marginally-declining demand in the long term. Hence, there is no major change at the end of the forecast period compared to the demand observed in 2024.
Other non-OECD regions
Outside of India and China, other developing countries in Asia will also play an important role in expanding oil demand. In the region called Other Asia , these countries comprise a current population of around 1.3 billion, which is set to increase to almost 1.6 billion by 2050. Moreover, while China's working population is expected to drop by more than 200 million between 2024 and 2050, it will likely grow by a comparable number in Other Asia. In addition to this, steady urbanization and economic growth, industrialization (including a growing
petrochemical industry) and rising needs for all transportation modes, make this region the second largest contributor to increased global oil demand over the outlook period.
This is clearly demonstrated in Figure 3.15, which shows that the region's oil demand is set to increase by more than 5 mb/d over the forecast period, with the largest demand rise in road transportation. This sector increases from 3.8 mb/d in 2024 to 6.1 mb/d in 2050. Strong growth is also expected in the aviation and petrochemicals sectors, which are projected to increase by 0.7 mb/d and 1.1 mb/d, respectively. Somewhat lower, albeit still significant growth, is expected in marine transportation due to the presence of several large bunkering ports in this region, including the world's largest bunkering port in Singapore. Expanding maritime traffic is estimated to add another 0.6 mb/d to the region's growing demand over the forecast period.
Road Aviation Marine bunkers Petrochemicals Other sectors 0 2 4 6 8 10 12 14 16 18 2024 2030 2035 2040 2045 2050 mb/d
Figure 3.15 Oil demand in 'Other Asia' by sector, 2024–2050
Source: OPEC.
A similar set of factors is set to play a role in the other two regions that have significant incremental demand during the forecast period. The overall projected demand increase in the Middle East and Africa is estimated at 4.7 mb/d and 4.2 mb/d, respectively. However, while demand growth in the Middle East is stronger during the next ten to 15 years and decelerates in the second part of the outlook period, oil demand in Africa is more backloaded, becoming much stronger towards the end of the outlook period.
Figure 3.16 details the Middle East outlook. In this case, two sectors stand out as the primary sources of growth: road transportation and petrochemicals. The fast expansion of the vehicle fleet in this region is already underway and is expected to continue in the years to come in both the passenger car and commercial vehicle segments. This will push oil demand in this sector to more than 5 mb/d in 2050 from a level of 3.2 mb/d in 2024. A comparable rate of expansion is also projected in the Middle East's petrochemical industry, which is developing into a major hub. A wave of new petrochemical projects in the region (more details provided

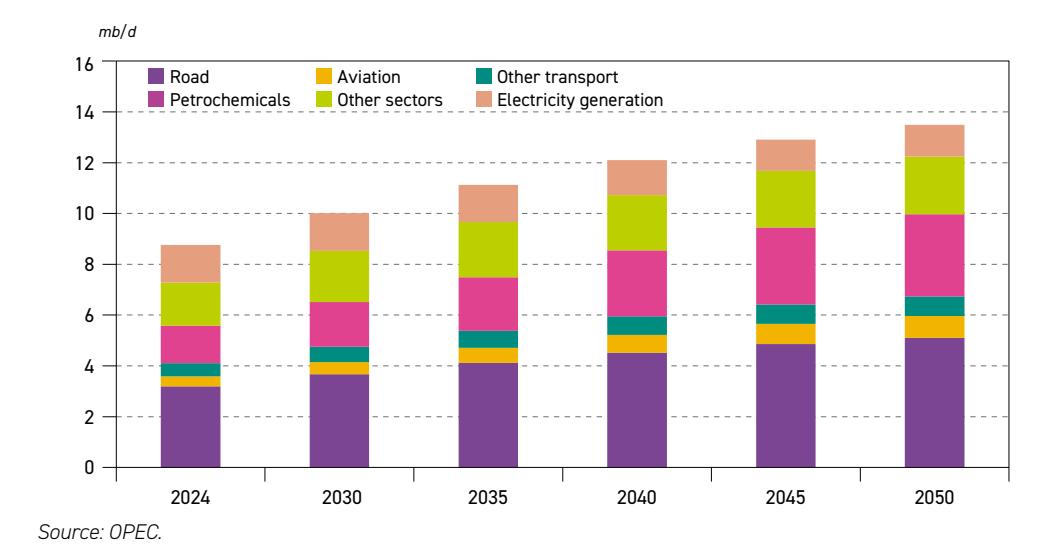
Figure 3.16 Oil demand in the Middle East by sector, 2024–2050
in Chapter 5 and section 3.2.3) and the availability of cheaper feedstock provide a competitive advantage to this industry compared to other regions and thus helps drive related oil demand higher. Middle East demand in this sector stood at 1.5 mb/d in 2024 and is projected to increase to 3.2 mb/d in 2050.
Besides road transportation, other transport modes will also require additional fuels in the form of refined products. This is especially the case for the Middle East's aviation sector, which is set to expand its role as an important transport hub between Asia, Europe and Africa. Therefore, demand in this sector is projected to increase by 0.5 mb/d over the forecast period. Moreover, growing maritime commodity trade, as well as the region's expanding importance for fuel bunkering, is expected to add another 0.3 mb/d to future oil demand.
Significant demand growth is also projected in the industrial sector, where incremental demand is expected in the range of 0.5 mb/d between 2024 and 2050. The only sector expected to witness declining oil demand in the region is electricity generation, due to substantial efforts to substitute oil used to produce electricity with other sources like natural gas, renewables and nuclear, thus making more oil available for export.
Africa's oil demand is also expected to see some important changes throughout the forecast period, with demand expanding from 4.6 mb/d in 2024 to 8.8 mb/d in 2050. The main source of this demand growth is closely linked to the development of the road transportation sector. With car ownership estimated at around 70 vehicles per 1,000 people, there is huge potential for further growth in this region. Moreover, the continued economic expansion in Africa also necessitates a large expansion of the commercial vehicle parc. This expectation is reflected in the fact that almost half of future demand growth in this region is expected to materialize in the road transportation sector (in the range of 2 mb/d between 2024 and 2050).
The residential, commercial and agricultural sector is also expected to more than double its oil demand over the forecast period, from 0.7 mb/d in 2024 to 1.6 mb/d in 2050,

mainly due to increased consumption from LPG in the residential sector and diesel oil in agriculture. The third-largest increase in African oil demand is a tie between the aviation sector and other industry, with both expected to increase by 0.4 mb/d between 2024 and 2050. In contrast to other regions where oil use for electricity generation typically declines, demand in this sector remains on a growing trajectory in Africa. This is partly due to the availability of heavier products in some regions, as well as the need for decentralized power generation in many places, especially those still lacking access to stable and reliable electricity supply.
Structurally, Latin America 's oil demand is expected to observe similar trends to those projected in Africa and the Middle East, albeit at a slower rate of expansion. Demand in this region is set to increase by close to 3 mb/d over the forecast period, up from 6.8 mb/d in 2024 to 9.7 mb/d in 2050. The largest growth is set to be in the road transportation sector, which increases by 0.9 mb/d. This is attributed to increased car ownership and the expansion of the region's road infrastructure. Following road transportation is growth in the residential, commercial and agricultural sector, which is set to increase by 0.6 mb/d. Some demand expansion is also projected in the industry sector (+0.4 mb/d), while growth in the remaining sectors is set to be in the range of 0.1 mb/d to 0.2 mb/d over the entire forecast period.
Demand growth in the remaining non-OECD regions will likely be rather constrained and even decline towards the end of the outlook period. Some growth potential exists in Other Eurasian countries, where oil demand is projected to expand from 1.3 mb/d in 2024 to 1.6 mb/d in 2050. However, demand in the other two regions, Russia and Other Europe , is expected to peak sometime around 2035 and then plateau for the rest of the outlook period. In the case of Russia, demand is expected to peak at a level slightly above 4 mb/d, while Other Europe's demand is set to remain below the 1 mb/d mark. Moreover, the overall change in demand will be minimal in both regions throughout the entire forecast period.
3.2 Oil demand outlook by sector
Having reviewed global energy demand trends from a regional perspective in section 3.1, this section provides an overview from a sectoral viewpoint. A global summary for major sectors is presented in Table 3.3. It highlights that oil consumption through various transportation modes constitutes the backbone of global oil demand throughout the forecast period. Indeed, the transportation sector accounted for more than 57% of global oil demand in 2024 and, with minor variations, is projected to retain this share over the entire forecast period. Moreover, this sector is also projected to be the largest source of incremental demand in the period to 2050 (Figure 3.17).
A significant part of global oil demand relates to the industrial sector, which accounted for around 27% of global demand in 2024, or 28.5 mb/d. The largest part of this demand serves as feedstock to the petrochemical industry and continued demand for a variety of petrochemical products will support strong growth for oil demand in this sector. Slightly lower volumes are currently used for combustion in various industrial processes, and demand here is expected to remain relatively stable, especially in the second part of the forecast period. Overall, the industrial use of oil is expected to increase its share to almost 29% by 2050.
The remaining 15% of global oil demand is spread across a variety of sectors, including residential, commercial, agriculture and electricity generation. Oil demand in these sectors

| 2024 | 2030 | 2035 | 2040 | 2045 | 2050 | Growth 2024–2050 | |
|---|---|---|---|---|---|---|---|
| Road | 46.0 | 48.9 | 50.1 | 50.6 | 51.0 | 51.3 | 5.3 |
| Aviation | 7.1 | 8.5 | 9.4 | 10.1 | 10.9 | 11.3 | 4.2 |
| Rail/waterways | 2.0 | 2.2 | 2.3 | 2.4 | 2.3 | 2.3 | 0.3 |
| Marine bunkers | 4.3 | 4.8 | 5.0 | 5.1 | 5.2 | 5.2 | 0.9 |
| Transportation | 59.4 | 64.4 | 66.8 | 68.2 | 69.4 | 70.2 | 10.8 |
| Petrochemicals | 15.5 | 17.5 | 18.5 | 19.3 | 19.9 | 20.2 | 4.7 |
| Other industry | 12.9 | 14.2 | 14.9 | 14.8 | 14.9 | 15.0 | 2.0 |
| Industry | 28.5 | 31.7 | 33.4 | 34.1 | 34.8 | 35.2 | 6.7 |
| Resid./Comm./Agr. | 11.4 | 12.6 | 13.2 | 13.3 | 13.4 | 13.6 | 2.3 Width: 135.6 mm |
| Electricity generation | 4.5 | 4.5 | 4.5 | 4.3 | 4.0 | 4.0 Height: | –0.5 65 mm |
| Other uses | 15.9 | 17.1 | 17.6 | 17.7 | 17.4 | 17.6 | 1.7 |
| World | 103.7 | 113.3 | 117.9 | 120.0 | 121.6 | 122.9 | 19.2 |
Table 3.3 Global oil demand by sector, 2024–2050
Source: OPEC.
is subject to wider variations and divergent trends due to specific regional circumstances and developments. At the aggregate level, after initial growth over the next 10 to 15 years, demand in these sectors is set to stabilize at a level above 17 mb/d. In relative terms, the share of 'other uses' is expected to decline by around 1 percentage point over the forecast period, slipping from around 15% in 2024 to 14% by 2050.
Figure 3.17 details major sectoral oil demand from an incremental point of view between 2024 and 2050. It demonstrates that the three key sectors – namely, road transportation, petrochemicals and aviation – by far outperform others in terms of additional barrels. The Figure 3.17
Figure 3.17 Global oil demand growth by sector, 2024–2050
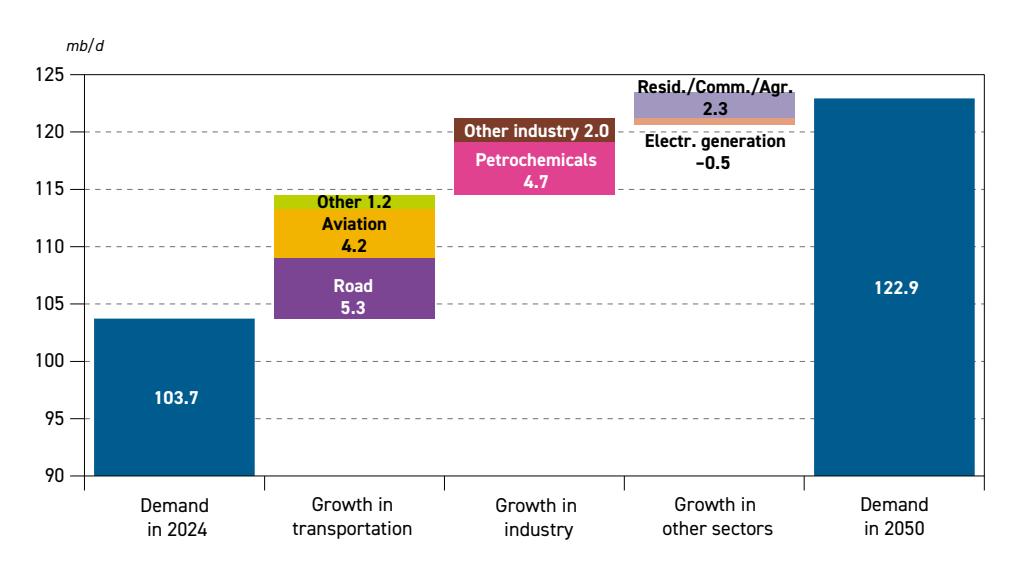
Source: OPEC.

combined demand increase is 14.3 mb/d, which represents more than 74% of the overall demand growth between 2024 and 2050. Moreover, the combined demand in these three sectors accounted for 66% of global oil demand in 2024, and is projected to marginally increase to 67% over the forecast period.
From the perspective of road transportation, demand is set to increase from 46 mb/d in 2024 to 51.3 mb/d in 2050. The addition of 5.3 mb/d comes on the back of a large expansion in the global vehicle fleet, particularly in developing countries. The passenger parc in these countries is projected to increase by more than 800 million cars between 2024 and 2050. Although a portion of these cars will be electric, the majority are expected to use gasoline and diesel. This is not anticipated to be the case in the OECD, however, where additions in the category of EVs are set to be larger than the total increase in the number of passenger cars. Nonetheless, resulting demand growth in developing countries, especially during the first half of the forecast period, will be strong enough to offset declining OECD demand related to passenger vehicles.
Much larger support to future road transportation oil demand is expected to come from the rising number of commercial vehicles. At the global level, an increase of more than 360 million vehicles is anticipated between 2024 and 2050. Moreover, contrary to passenger cars, alternative vehicles (mainly powered by electricity and natural gas) are set to account for a much smaller share in this segment. Therefore, commercial vehicles will be the primary source of expanding oil demand in this sector.
The second largest source of incremental demand is forecast for the petrochemical sector. Oil consumption in this sector is projected to increase from 15.5 mb/d in 2024 to more than 20 mb/d in 2050. This growth is needed to supply a wide range of products to other industries, including various construction materials, fertilizers, chemicals, rubbers, packaging materials, as well as plastics for cars, airplanes, windmills and PV panels. From a regional perspective, the bulk of the growth is set to be in developing Asia and the Middle East. These two regions combined are set to account for almost 90% of this sector's overall demand growth.
Oil in this sector is used in two different ways. The smaller part is used as fuel in thermal processes. For this, there is strong competition from cheaper natural gas to substitute oil. However, there are fewer technologically viable and economically affordable substitution options for the larger part, where oil is used as a feedstock. Some substitution is possible by natural gas and biomass; hence, these products will likely increase their share in this industry. However, oil-based products, in particular naphtha and LPG, are much more suitable for a wider range of requirements. Moreover, demand for petrochemicals is set to witness strong and continued growth, providing sufficient room for all feedstock types.
The next critical sector with considerable potential for additional oil demand is aviation. Despite expected efficiency improvements due to better aircraft design, improved engine efficiency and route optimizations, an expanding number of flights is set to more than offset these factors, resulting in higher oil demand. Moreover, in contrast to petrochemicals, where demand growth will be concentrated in two regions, aviation demand is set to increase in all regions, albeit at varying rates. Strong growth in this sector is expected in Asian countries, followed by OECD Americas and the Middle East. In total, aviation demand is projected to increase by 4.2 mb/d between 2024 and 2050, partly due to a limited number of substitution options.
However, oil will likely face stronger competition in the remaining demand sectors. Despite significant industrialization and urbanization in developing countries and the expanding

volumes of interregional trade, competition is the main reason why overall demand growth in 'other industry', residential/commercial and maritime transport sectors is lower. In all these sectors, oil has to compete with natural gas and electricity, not only in newly established or expanding businesses and residential areas, but also in existing ones, especially in OECD regions. This is demonstrated in Figure 3.18 and Figure 3.19, which present major sectoral changes for the OECD and non-OECD separately.
With the exception of the aviation and petrochemical sectors, OECD oil demand is set to decline in all other sectors between 2024 and 2050, primarily due to oil substitution by electricity
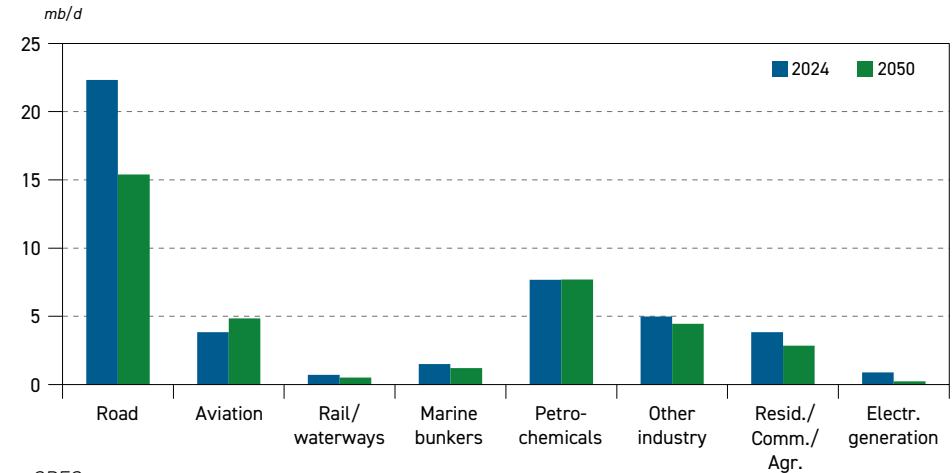
Figure 3.18 OECD oil demand by sector, 2024 and 2050
Source: OPEC.

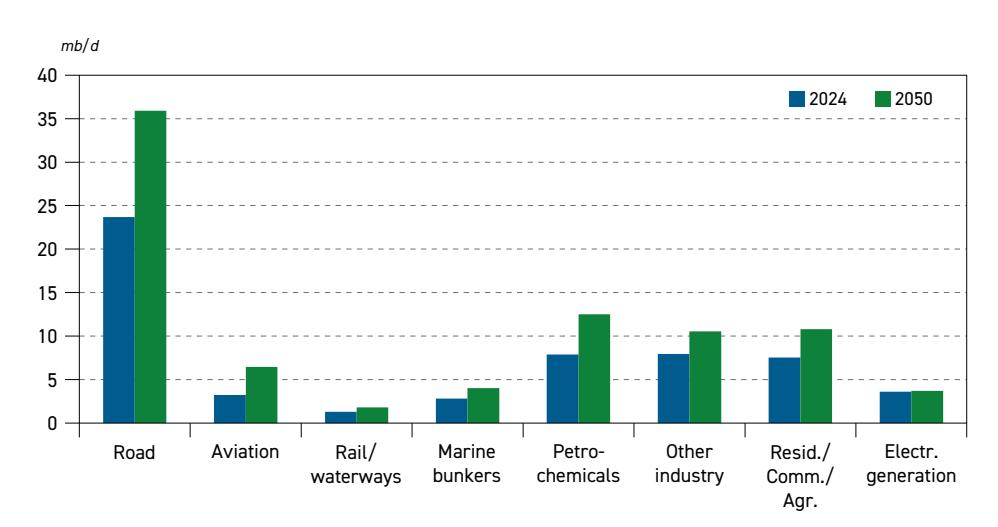
Source: OPEC.

and natural gas. This trend is already well established in the residential sector, where oilbased heating systems are being gradually replaced by heat pumps, supported by various subsidy programmes to accelerate this process. However, against the backdrop of recent policy changes in a number of OECD countries, it remains to be seen how fast this substitution will progress. Substitution in 'other industry' is set to be split between electricity and natural gas – and potentially also by hydrogen – over the second part of the forecast period. The most affected sector will likely be electricity generation, where future oil use is expected to be restricted to backup and emergency use, rather than providing baseload power.
Expectations for the non-OECD are different given the large development needs in virtually all areas and across all consumption sectors. Competition between oil products and alternative fuels will be present in most sectors and areas, but the fast-growing energy needs in developing countries will accommodate all available energy sources. Hence, any real substitution is set to be restricted to a few areas, such as rail transport, the power sector and possibly marine transport. Overall, non-OECD demand is set to increase in all major sectors over the forecast period.
3.2.1 Road transportation
Given the importance of road transportation for global oil demand (this sector accounted for 44% of global oil demand in 2024), any larger departure from established trends in this sector could have sizeable implications on regional and global oil demand in the years to come.
Thus, it is important to monitor developments affecting several critical factors steering future demand in this sector. The first one is the size of the vehicle parc. Population growth and the improving socio-economic conditions of billions of people, especially in developing countries, will drive new vehicle sales and lead to higher car ownership. Moreover, a higher level of economic activity will require a higher number of commercial vehicles too. As a result, the global vehicle fleet is set to significantly increase in size over the forecast period.
Another important parameter is the changing structure of the vehicle fleet. In this respect, the speed of electrification will play a crucial role. The biggest uncertainty lies in how fast this process will progress, and to what extent it will affect commercial vehicles. At the same time, it is important not to lose sight of other alternatives like natural gas and hydrogen.
Finally, ongoing efficiency improvements also play an important role. The key question and uncertainty in this respect is whether improvements will be more evolutionary in nature, with gradual but steady improvements taking place – similar to those observed in the past – or if technology will lead to accelerated changes, especially in growth markets in developing countries. Regardless, it is important to note that past experience has shown that some improvements are typically offset by changing consumer behaviour.
This sub-section sets out to capture the interplay of often diverging trends to assess their most likely impact on regional and global oil demand in the road transportation sector.
Vehicle stock
New vehicle registrations in all major markets increased again during 2024, reaching a level of 96 million units worldwide. Around one third of these new vehicles were registered in

China, the world's largest car market, comprising almost 28 million passenger cars and four million commercial vehicles. Moreover, China is also by far the largest market for EVs. Out of around 17 million EVs sold worldwide in 2024, more than 11 million were registered in China. These figures show the strong dynamics of China's vehicle market, both in terms of its fast expansion and its changing composition.
The second largest car market is OECD Americas, led by the US. In the US, new car sales increased to almost 16 million in 2024, representing growth of 2.6% compared to 2023. In contrast to China, however, the US market has a much higher share of larger cars and SUVs and a much lower share of EVs. In fact, new EV sales in the US reached just 1.3 million in 2024, accounting for just 8% of all new registrations.
Compared to China and the US, Europe's car market experienced much slower growth, with new car registrations increasing by just 0.8% to reach close to 11 million. Moreover, sales of EVs declined marginally compared to 2023, falling below three million in 2024. This reflects a very complex situation in the European automotive industry, which is being pushed by policymakers to shift production lines towards EVs, despite consumers still preferring (cheaper) ICE vehicles or hybrid vehicles.
In Japan, which is the largest car market in OECD Asia-Pacific, new car registrations fell by more than 7% in 2024 compared to 2023. Moreover, while a large share of hybrid vehicles makes Japan's car fleet very efficient, the share of EVs remains very low. It is expected that this market will remain gasoline-based for many years to come. Although sales declined by 5% in 2024 in Japan and South Korea, this was more than compensated for by strong growth in large developing countries, typically in the range of between 10% and 15%.
This was the case in India, for example, where new car sales surpassed five million in 2024 – an increase of almost 12% compared to the previous year. Car sales in Brazil also surged by 14% last year, reaching a level of 2.6 million. Significant growth was similarly observed in several other developing countries, such as Saudi Arabia (+8%), the Philippines (+8%) and Vietnam (+13%). Moreover, driven by sustained economic growth, these countries are set to gradually increase their share in terms of both new sales and vehicle parc size over the outlook period. This expectation is clearly visible in Table 3.4, which shows the global fleet of passenger cars expanding from around 1.4 billion in 2024 to almost 2.3 billion in 2050, an increase of almost 850 million cars.
Most of this growth is forecast to take place in non-OECD regions, with China accounting for more than 210 million cars, followed by India (190 million) and Other Asia (almost 180 million). The remaining 230 million additional cars are spread across other non-OECD regions, most of them in the Middle East and Africa.
Unlike the non-OECD, car ownership in many OECD countries is already saturated, with limited scope for further expansion (Figure 3.20). As a result, the OECD's fleet size is expected to see only modest expansion over the next decade, before stabilizing toward the end of the forecast period. Some growth potential remains in OECD Americas and OECD Europe, but this is expected to be largely offset by declines in OECD Asia-Pacific due to an ageing and declining population. In contrast, considerable potential for expansion exists in developing countries, where current car ownership is far below 100 per 1000 people in many countries.
3
| Growth | |||||||
|---|---|---|---|---|---|---|---|
| 2024 | 2030 | 2035 | 2040 | 2045 | 2050 | 2024–2050 | |
| OECD Americas | 287.2 | 300.0 | 312.7 | 322.0 | 326.2 | 327.5 | Width: 135.6 mm 40.3 |
| OECD Europe | 272.0 | 276.3 | 279.7 | 283.1 | 286.3 | Height: 289.4 | 65 mm 17.4 |
| OECD Asia-Pacific | 111.8 | 107.4 | 103.4 | 99.2 | 94.9 | 90.8 | –21.0 |
| OECD | 671.0 | 683.7 | 695.8 | 704.2 | 707.5 | 707.7 | 36.7 |
| China | 328.1 | 412.7 | 479.5 | 525.8 | 546.2 | 539.7 | 211.6 |
| India | 52.2 | 79.8 | 113.0 | 153.5 | 198.5 | 243.7 | 191.5 |
| Other Asia | 93.8 | 119.5 | 149.9 | 185.0 | 225.3 | 271.3 | 177.5 |
| Russia | 38.2 | 38.1 | 37.6 | 36.7 | 35.7 | 34.4 | –3.8 |
| Other non-OECD | 254.5 | 296.3 | 338.8 | 385.2 | 436.0 | 488.1 | 233.6 |
| Non–OECD | 766.8 | 946.4 | 1,118.7 | 1,286.2 | 1,441.7 | 1,577.3 | 810.4 |
| World | 1,437.8 | 1,630.2 | 1,814.6 | 1,990.5 | 2,149.1 | 2,284.9 | 847.1 |
Source: OPEC.
Table 3.4
Figure 3.20 Passenger vehicle ownership by region
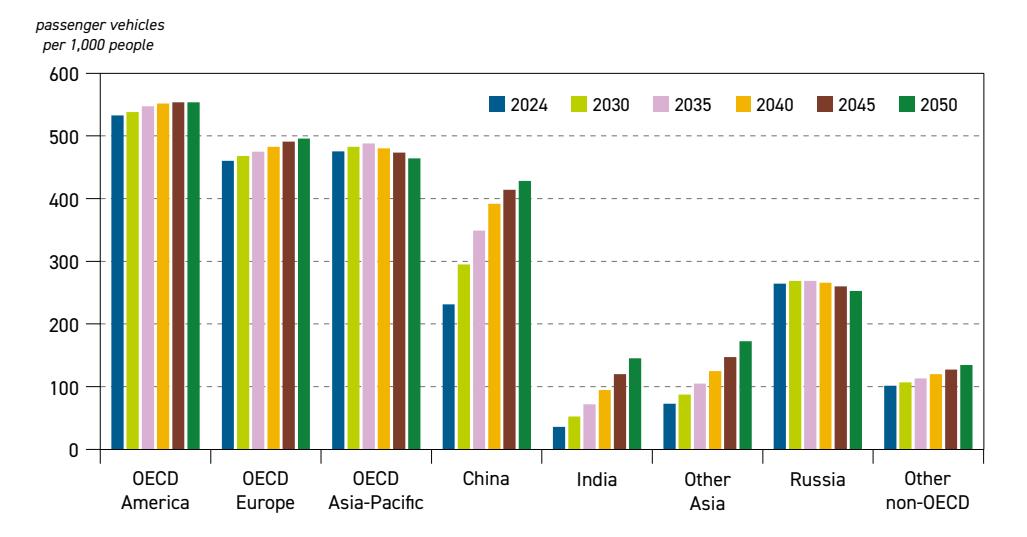
Source: OPEC.
Table 3.5 shows that the commercial fleet is set to increase from 275 million in 2024 to almost 640 million in 2050. As expected, a large part of this increase is in the non-OECD, where the commercial fleet is set to expand by more than 290 million vehicles over the forecast period.
The number of commercial vehicles in the OECD region is also projected to increase, albeit at a much slower rate than in the non-OECD. Regardless, both OECD Europe and OECD Americas are expected to add more than 30 million vehicles to their commercial fleets over the forecast

period. Elsewhere, a much lower fleet expansion – expected in the range of six million vehicles – is envisaged in OECD Asia-Pacific.
| Growth | |||||||
|---|---|---|---|---|---|---|---|
| 2024 | 2030 | 2035 | 2040 | 2045 | 2050 | 2024–2050 | |
| OECD Americas | 43.0 | 47.4 | 53.0 | 59.6 | 67.1 | 75.8 | 32.9 |
| OECD Europe | 45.4 | 51.7 | 58.1 | 64.6 | 71.3 | 78.3 | 32.9 |
| OECD Asia-Pacific | 25.5 | 26.6 | 27.7 | 28.8 | 30.0 | 31.4 | 5.9 |
| OECD | 113.9 | 125.7 | 138.8 | 153.0 | 168.5 | 185.5 | 71.6 |
| China | 33.7 | 43.7 | 54.1 | 65.0 | 75.4 | 85.4 | 51.7 |
| India | 23.5 | 33.7 | 45.3 | 60.7 | 78.3 | 97.8 | 74.3 |
| Other Asia | 32.1 | 42.1 | 51.9 | 62.0 | 72.3 | 82.2 | 50.0 |
| Russia | 5.8 | 6.0 | 6.1 | 6.3 | 6.4 | 6.6 | 0.8 |
| Other non-OECD | 65.7 | 81.5 | 99.7 | 122.8 | 150.0 | 181.5 | 115.7 |
| Non-OECD | 160.8 | 207.1 | 257.2 | 316.9 | 382.4 | 453.4 | 292.5 |
| World | 274.7 | 332.7 | 396.0 | 469.8 | 550.9 | 638.9 | 364.2 |
Table 3.5 Number of commercial vehicles by region, 2024–2050 millions
Source: OPEC.
Vehicle fleet composition
The electrification of road transportation has the most potential to significantly change the global fleet composition and, in turn, impact future oil demand. Therefore, monitoring technology developments, the investment plans of car manufacturers and consumer behaviour regarding the acceptance and cost competitiveness of EVs (including BEVs and plug-in hybrids), is a regular feature of oil demand modelling.
New EV sales surpassed 17 million globally in 2024, which meant that their share in global vehicle sales increased from around 14% in 2023 to 18% in 2024. If passenger car sales alone are considered as a base, this share increased to 20% in 2024. However, this number becomes less impressive when considering that around 65% of EVs (11 million) were sold in China and almost 40% of new EVs were plug-in hybrids that still partly use gasoline as an energy source.
This means that, except for China and a few European countries like Norway, Sweden and Netherlands, the penetration of EVs in both global and regional fleets is still very low. In most developing countries, the share is well below 1%, in OECD Americas it is slightly above 2% and in OECD Europe it is between 5% and 6%. Even in China, with its high share of EVs in new car registrations in 2024, their overall penetration was still less than 8% last year.
Against this backdrop, the two key questions to ask are: how fast could this situation change in the years to come, and can the electrification of road transportation progress to levels that might materially impact oil demand?
Considering existing policy targets – such as a ban on the sales of ICE-based vehicles in the EU, the UK, Canada, China, Chile, California, and a number of other places within the next

3
ten years, alongside tight CAFE standards in the US – the penetration of EVs should expand exponentially in these countries and regions, with spillover effects elsewhere. To date, however, necessary investments to make this a reality are not being made, and carmakers are not ramping up production capacity to the required levels. Moreover, recent EV sales are far below previous expectations. In addition, ongoing discussions among policymakers and between the automotive industry and governments increasingly point to a softening of existing regulations and a deferral of key policy targets (as already discussed in section 3.2).
Reflecting on these developments, this Outlook assumes continued growth in future EV sales, as well as a rising share in the global vehicle fleet. However, this is at a slightly lower rate than in past outlooks. As presented in Table 3.6, the global EV fleet is set for a substantial increase of almost 600 million units between 2024 and 2050, from a base of around 54 million in 2024. OECD countries and China are set to play a major role in this expansion, accounting for around 260 million and 180 million of additional EVs in 2050, respectively. In comparison, all other countries combined are expected to add around 150 million EVs over the same period. In all cases, EVs are set to grow much faster in the passenger car segment than in the commercial vehicle sector, where the penetration rate is expected to be rather limited, even by the end of the forecast period.
Table 3.6 Number of electric vehicles by region, 2024–2050 millions
| Growth | |||||||
|---|---|---|---|---|---|---|---|
| 2024 | 2030 | 2035 | 2040 | 2045 | 2050 | 2024–2050 | |
| OECD Americas | 7.3 | 26.3 | 52.2 | 80.7 | 108.2 | 124.7 | 117.4 |
| OECD Europe | 15.9 | 50.2 | 79.1 | 99.6 | 117.2 | 128.2 | 112.3 |
| OECD Asia-Pacific | 1.1 | 4.9 | 12.3 | 21.0 | 27.8 | 31.9 | 30.8 |
| OECD | 24.2 | 81.4 | 143.7 | 201.3 | 253.2 | 284.8 | 260.6 |
| China | 28.4 | 85.3 | 131.2 | 167.0 | 194.2 | 211.3 | 182.9 |
| India | 0.4 | 2.6 | 7.4 | 14.3 | 21.5 | 29.8 | 29.4 |
| Other Asia | 0.7 | 5.3 | 16.0 | 29.7 | 43.6 | 56.9 | 56.2 |
| Russia | 0.1 | 0.5 | 1.5 | 3.1 | 4.7 | 6.2 | 6.1 |
| Other non-OECD | 0.5 | 3.0 | 9.8 | 22.0 | 37.8 | 59.6 | 59.1 |
| Non-OECD | 30.0 | 96.8 | 166.0 | 236.1 | 301.8 | 363.7 | 333.7 |
| World | 54.2 | 178.2 | 309.7 | 437.4 | 555.0 | 648.5 | 594.3 |
Source: OPEC.
Compared to EVs, much slower growth is expected in two other alternative types of vehicles. The existing global fleet of NGVs is in the range of 40 million and is concentrated in several Asian and Latin American countries. This number is expected to expand, but at a far lower rate than for EVs. NGVs are set to grow to almost 130 million by 2050 (Figure 3.21). While most of this increase is in the category of passenger cars, this Outlook also assumes an increased use of natural gas in commercial vehicles, especially in China and other Asian countries. At the same time, however, this type of vehicle is likely to (almost) disappear from European roads due to lack of infrastructure and considering electrification as a preferred alternative.

Figure 3.21 Global fleet composition*, 2024–2050
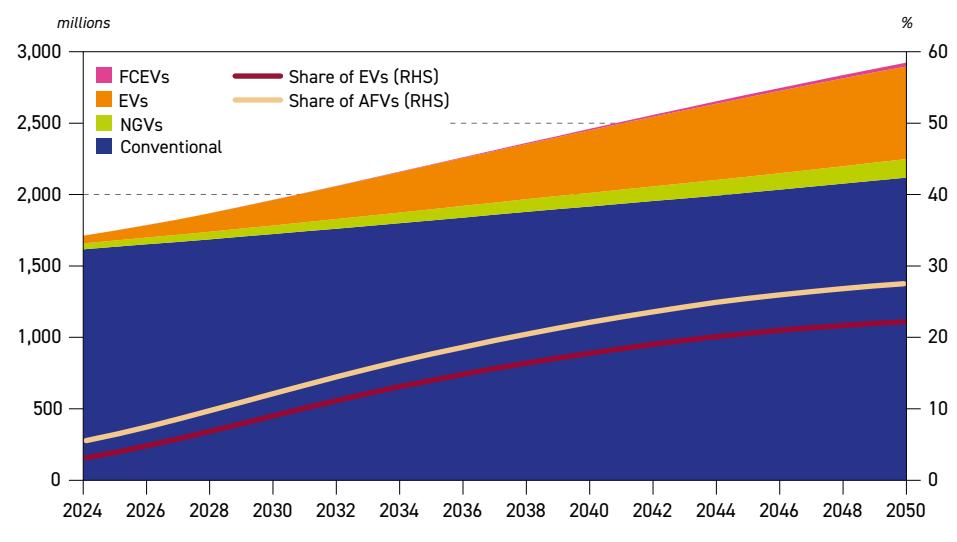
Note: *Conventional vehicles include gasoline, diesel, LPG and hybrid electric vehicles. Source: OPEC.
Finally, despite great potential for an expansion of hydrogen-based fuel cell electric vehicles (FCEV) in the long term, this Outlook foresees that this type of vehicle will remain niche over the outlook period. This is mainly due to the higher costs and limited availability of hydrogen, as well as the time needed to develop public acceptance for FCEVs and to build the required infrastructure. It is assumed that the total number of FCEVs might reach between 20 and 30 million by the end of the outlook period, with most of this growth likely occurring during the last decade.
Combining EVs, NGVs and FCEVs, Figure 3.22 implies that almost 60% of the future expansion of the global vehicle fleet will be captured by alternative vehicles, which will increase from less than 100 million in 2024 to 800 million by 2050. The number of ICE-based vehicles – including hybrids – is set to increase by 500 million, especially in developing countries, also in the segment of commercial vehicles.
Expanding from 1.6 billion vehicles in 2024 to more than 2.1 billion in 2050, ICE vehicles will continue to dominate the global vehicle fleet. They are set to still account for more than 70% at the end of the forecast period. This underlines that, due to the large existing base of ICE vehicles in the global fleet, the transition to alternative powertrains will likely take many decades, not years. Moreover, the large share of ICE vehicles in the global fleet will make oil demand in this sector resilient to any sudden change.
However, the structure of the vehicle fleet in China will differ from the global average. Indeed, new sales of passenger EVs in China surged in 2024 to reach a level of more than 11 million units, compared to around 8 million in 2023. In terms of market share, passenger EVs reached an almost 50% share of new sales in 2024. It should be noted, however, that more than 80% of these EVs are in the category of plug-in hybrids and thus do not fully replace corresponding

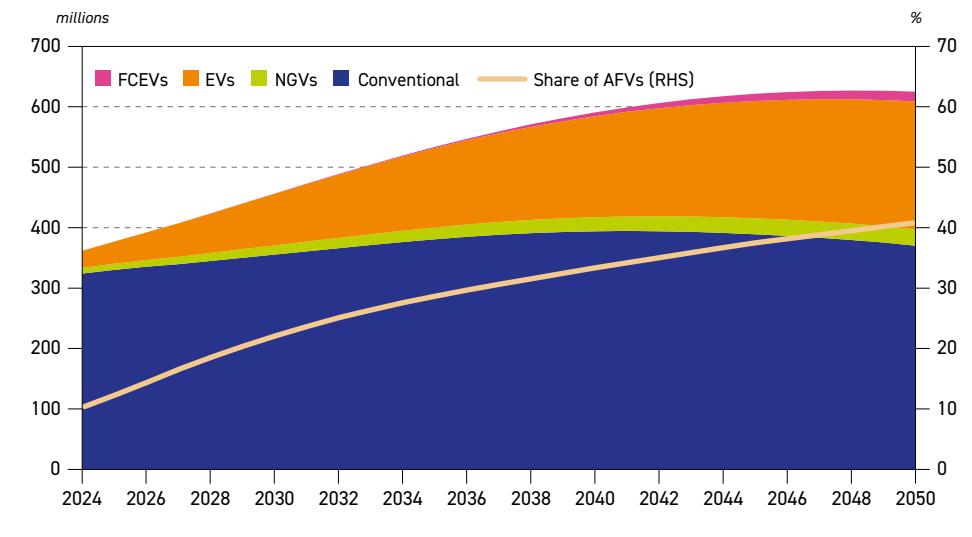
Figure 3.22 China fleet composition*, 2024–2050
Note: *Conventional vehicles include gasoline, diesel, LPG and hybrid electric vehicles. Source: OPEC.
gasoline demand (assuming these cars were ICE vehicles). Moreover, the share of EVs in China is much lower when it comes to commercial vehicles – around 20% – and even lower when it comes to heavy duty vehicles.
While EV sales in China seem impressive, they must be considered in the context of the country's broader car market conditions, especially the fact that China remains a fastgrowing car market with relatively low car ownership. Indeed, as noted in Figure 3.20, newly registered vehicles are mostly an addition to the expanding vehicle fleet rather than a replacement for older ICE vehicles. In other words, the fleet of ICE vehicles in China is expected to continue growing over the current and following decades, despite the fast penetration of EVs.
Adding to the complexity of estimating future oil demand in this sector is the fact that, within the group of 'conventional' vehicles, the share of commercial vehicles (with their higher demand per vehicle) is set to slightly increase, while the fuel efficiency of the passenger vehicle parc is expected to improve, and the average mileage driven per vehicle is expected to slightly decline. Moreover, some diesel substitution by natural gas in the segment of commercial vehicles will also play a role, though its long-term impact is anticipated to be rather limited.
The changes in the size and structure of the vehicle fleet in China will obviously have large implications on the country's future oil demand. The overall vehicle fleet in China is projected to increase from an estimated 362 million vehicles in 2024 to 625 million in 2050. While the majority of this expansion is expected to be captured by EVs, the number of 'conventional' vehicles is also set to continue growing until around 2040, before witnessing a moderate decline over the last decade of the outlook period.

Table 3.7
Outlook for oil demand in road transportation
Considering all critical parameters affecting oil demand in road transportation, including the already discussed changes in the size and structure of the vehicle fleet, consumer driving habits and assumed fuel efficiency changes, Table 3.7 provides a summary of projected regional demand in this sector.
| Oil demand in the road transportation sector by region, 2024–2050 | mb/d | ||||||
|---|---|---|---|---|---|---|---|
| Growth | |||||||
| 2024 | 2030 | 2035 | 2040 | 2045 | 2050 | 2024–2050 | |
| OECD Americas | 13.6 | 13.1 | 12.6 | 11.9 | 11.3 | 10.7 | –2.8 |
| OECD Europe | 6.2 | 6.0 | 5.4 | 4.7 | 3.9 | 3.5 | –2.8 |
| OECD Asia-Pacific | 2.4 | 2.3 | 2.0 | 1.7 | 1.4 | 1.2 | –1.3 |
| OECD | 22.3 | 21.5 | 20.0 | 18.3 | 16.7 | 15.4 | –6.9 |
| China | 6.7 | 7.4 | 7.4 | 7.3 | 7.2 | 7.0 | 0.4 |
| India | 2.3 | 3.3 | 4.2 | 5.1 | 6.1 | 6.9 | 4.6 |
| Other Asia | 3.8 | 4.6 | 5.1 | 5.5 | 5.9 | 6.1 | 2.3 |
| Latin America | 3.4 | 3.6 | 3.9 | 4.1 | 4.3 | 4.3 | 1.0 |
| Middle East | 3.2 | 3.7 | 4.1 | 4.5 | 4.9 | 5.1 | 1.9 |
| Africa | 2.1 | 2.4 | 2.8 | 3.2 | 3.6 | 4.1 | 1.9 |
| Russia | 1.2 | 1.3 | 1.3 | 1.2 | 1.2 | 1.1 | –0.1 |
| Other Eurasia | 0.6 | 0.7 | 0.7 | 0.8 | 0.8 | 0.8 | 0.2 |
| Other Europe | 0.4 | 0.4 | 0.5 | 0.5 | 0.4 | 0.4 | 0.0 |
| Non-OECD | 23.7 | 27.4 | 30.1 | 32.3 | 34.3 | 35.9 | 12.2 |
| World | 46.0 | 48.9 | 50.1 | 50.6 | 51.0 | 51.3 | 5.3 |
Source: OPEC.
At the global level, the road transportation sector is projected to experience the largest demand increase among all major sectors, adding 5.3 mb/d between 2024 and 2050. It is important to note, however, that a large part of this demand growth is expected to materialize in the period to 2035, when many of the additional vehicles – especially in developing countries (the exception being China) – are set to be conventional ICE vehicles. During the second part of the forecast period, the growing fleet of EVs, improved fuel efficiency of ICE vehicles and a much higher share of hybrids, will largely offset the potential demand increase resulting from an expanding vehicle fleet. During this period, oil demand growth in the road transportation sector will significantly decelerate and remain around 51 mb/d.
Another important aspect of the sector's demand outlook is the divergence in regional demand patterns. Differences range from demand tripling in India, plateauing in China and significantly declining in OECD Europe. Starting with India, oil demand for road transportation is set to increase by a huge 4.6 mb/d, from 2.3 mb/d in 2024 to almost 7 mb/d in 2050. This is supported by a large increase in the number of both passenger cars and commercial vehicles, and a relatively slow penetration of alternative vehicles. Due to sustained high GDP growth, commercial vehicles in particular constitute a solid base for the extended use of diesel.

Besides India, significant demand growth is also projected for Other Asia, Africa and the Middle East, each adding around 2 mb/d to their demand between 2024 and 2050. However, while the growth in Other Asia and Africa shows almost no signs of deceleration over the entire outlook period, growth in the Middle East is set to slow quite significantly towards the end of the period.
China's oil demand for road transportation is expected to follow a distinct trajectory. Demand is set to grow by 0.7 mb/d over the medium term, representing the third largest demand increment after India and Other Asia. However, the rapid adoption of EVs will likely curb further growth, and demand is set to peak between 2030 and 2035. After that, the offsetting effects of the continued penetration of EVs and the still-growing number of commercial vehicles will likely result in a slow but steady oil demand decline. Despite this shift, China is expected to remain the largest Asian oil consumer in road transportation throughout the forecast period, and the second largest globally, behind only OECD Americas.
In other non-OECD regions, demand growth is anticipated to be more modest. Latin America's road transportation sector is expected to see a 1 mb/d increase between 2024 and 2050, while Other Eurasia is set to add 0.2 mb/d. Meanwhile, demand in Russia and Other Europe is projected to stay relatively stable.
The strong demand growth in developing Asia, Africa and the Middle East is set to drive an overall increase of 12.2 mb/d in non-OECD road transportation demand, pushing total consumption to almost 36 mb/d by 2050.
Finally, OECD demand in this sector is set to drop over the forecast period primarily due to the rising EV fleet – expected to reach 285 million by 2050 – and improvements in ICE efficiencies. These factors contribute to a demand drop of almost 7 mb/d over the forecast period. On a volume basis, while the largest demand decline is projected for OECD Americas, the most dramatic changes will actually take place in OECD Asia-Pacific and OECD Europe. Oil demand in these two regions is set to broadly halve by the end of the forecast period, compared to demand levels in 2024.
3.2.2 Aviation
In June 2024, the IATA declared that the airline industry had 'fully recovered' from the impact of the COVID-19 crisis. During 2024, aviation revenue passenger kilometres (RPK) increased by more than 10% compared to 2023, and stood at almost 4% above pre-pandemic levels in 2019. At the same time, the overall load factor increased to more than 83% – the highest level ever recorded for a full year – indicating that related oil demand did not increase at the same rate as RPK. Moreover, the recovery has been uneven across different regions and sectors. While strong growth was generally achieved in most Asian countries and in Africa, China's major airlines continued to face challenges.
A positive outlook for the industry is also expected in 2025 and beyond. The IATA expects that the industry's revenue will surpass $1 trillion for the first time in 2025 and continue growing over the long term. The ICAO forecasts average annual growth of 4.3% in air transport demand over the next two decades, which will require a significant increase in the global aircraft fleet and related infrastructure. While a number of challenges remain, oil demand is set to increase over the entire forecast period, in line with the expectations outlined.

It should be noted, however, that growth is expected to slow moderately over time due to improved fuel efficiency, high load factors and optimized operations. Aviation oil demand is expected to rise from 7.1 mb/d in 2024 to 11.3 mb/d by 2050, making this sector the thirdlargest contributor to future incremental demand (Table 3.8).
| Oil demand in the aviation sector by region, 2024–2050 | mb/d | ||||||
|---|---|---|---|---|---|---|---|
| Growth | |||||||
| 2024 | 2030 | 2035 | 2040 | 2045 | 2050 | 2024–2050 | |
| OECD Americas | 1.9 | 2.1 | 2.3 | 2.4 | 2.5 | 2.5 | 0.6 |
| OECD Europe | 1.4 | 1.5 | 1.6 | 1.6 | 1.6 | 1.6 | 0.2 |
| OECD Asia-Pacific | 0.5 | 0.6 | 0.7 | 0.7 | 0.8 | 0.7 | 0.2 |
| OECD | 3.8 | 4.3 | 4.5 | 4.6 | 4.8 | 4.9 | 1.0 |
| China | 0.8 | 1.1 | 1.3 | 1.4 | 1.4 | 1.4 | 0.6 |
| India | 0.2 | 0.3 | 0.5 | 0.6 | 0.7 | 0.9 | 0.6 |
| Other Asia | 0.8 | 1.1 | 1.2 | 1.3 | 1.4 | 1.5 | 0.7 |
| Latin America | 0.3 | 0.4 | 0.5 | 0.6 | 0.6 | 0.7 | 0.4 |
| Middle East | 0.4 | 0.5 | 0.6 | 0.7 | 0.8 | 0.9 | 0.5 |
| Africa | 0.3 | 0.4 | 0.4 | 0.5 | 0.6 | 0.7 | 0.4 |
| Russia | 0.2 | 0.3 | 0.3 | 0.3 | 0.3 | 0.3 | 0.0 |
| Other Eurasia | 0.0 | 0.1 | 0.1 | 0.1 | 0.1 | 0.1 | 0.0 |
| Other Europe | 0.0 | 0.0 | 0.0 | 0.0 | 0.0 | 0.0 | 0.0 |
| Non-OECD | 3.2 | 4.2 | 4.9 | 5.5 | 6.1 | 6.5 | 3.2 |
| World | 7.1 | 8.5 | 9.4 | 10.1 | 10.9 | 11.3 | 4.2 |
Table 3.8
Source: OPEC.
In terms of regional growth, all major regions in this Outlook see higher demand by 2050 compared to 2024. The largest incremental demand is expected to come from Other Asia, followed by India, China and OECD Americas, each in the range of 0.6 mb/d to 0.7 mb/d. Noticeable additions are also projected for the Middle East, Africa and Latin America, each adding 0.4 mb/d to 0.5 mb/d. In contrast, only marginal demand additions are expected in the remaining regions, including OECD Europe and OECD Asia-Pacific. Moreover, demand in these regions is set to not only decelerate in the second part of the outlook period, but also to start marginally declining towards the end. Further expansion is expected to be constrained by infrastructure capacity and declining population growth.
It should be noted, however, that these projections are associated with a large uncertainty regarding how future policies driving developments affecting this sector will evolve. In recent years, both the ICAO and IATA have adopted several initiatives aimed at achieving net-zero CO2 emissions from aviation by 2050. This overarching target is included in the Long-Term Aspirational Goal (LTAG) of the ICAO, while specific steps to achieve this vision were outlined in 'The Net Zero Roadmap' by the IATA.
This 'Roadmap' considers the substitution of jet kerosene by SAF, electricity and hydrogen as the main strategy to reach the net-zero target. The replacement of jet kerosene is supposed to eliminate 65% of future emissions, with this measure supplemented by improved efficiency and the recapturing of all remaining CO2 that could not be avoided. Given recent changes on the policy side, widely discussed throughout this Outlook,
questions arise as to whether these industry targets will remain in place or be altered or deferred over time.
A second question relates to the feasibility of these strategies. While small electric aircraft could start entering the market in the current decade, it is unlikely they will play a significant role in displacing future oil demand in the period to 2050. Even less optimism can be placed on the assumption that SAF use will expand fast enough to replace more than half of the aviation sector's oil demand. Despite policy support for SAF, especially in Europe, the IATA has estimated that less than 0.5% of global aviation fuel consumption was provided by SAF in 2024. This was mainly due to limited SAF availability and its cost. Beginning in January 2025, fuel suppliers at UK and EU airports are required to incorporate at least 2% SAF. It remains to be seen how this plays out in terms of both cost and compliance with the target.
3.2.3 Petrochemicals
The petrochemical sector accounts for the second-largest share of oil demand growth over the outlook period, with almost one quarter of total incremental oil demand globally. Currently, more than 14% of total oil demand is driven by petrochemicals, and this share is expected to increase to over 16% by 2050. Demand in the petrochemical sector is ultimately driven by the increasing need for end-use products, including plastics, vinyl, textiles, synthetic materials, electronics and chemicals. These end-use products create demand for basic petrochemicals, which themselves create demand for petrochemical feedstocks.
The largest use of basic petrochemicals is in the production of polymers, such as plastic resins and synthetic fibres. However, aromatics also constitute a significant portion of demand. They are used in several applications, such as solvents, coatings, paints, adhesives and pharmaceuticals, and are combined with olefin derivatives to create polymers, such as polystyrene and polyethylene terephthalate (PET), which is used to make disposable drinking bottles. Benzene, toluene and xylenes (commonly called BTX) are the most important base aromatic chemicals.
The oil demand outlook in the petrochemical industry is set to be shaped by several key trends and challenges in the period to 2050. Supportive of demand growth is an expected substantial demand increase for petrochemical products on the back of expected GDP growth, rising population and income levels, as well as a broadening of the industries and technologies that use these products. This includes renewables (such as wind turbine materials and photovoltaic panels), EVs and the construction sector.
It is assumed, however, that this growth potential will be partly constrained by regulations and actions linked to environmental concerns. These relate to commitments to reduce the sector's carbon footprint, the push to increase recycling, restrictions on single-use plastics, implementing 'Extended Producer Responsibility' schemes, an increasing penetration of bioplastics and improved circularity of petrochemical products. Moreover, the failure of the Intergovernmental Negotiating Committee (INC) to reach a final agreement, as initially scheduled, along with the extension of talks to a sixth session in August 2025, adds another significant layer of uncertainty.
Another element of uncertainty relates to the evolution of US trade tariffs and any subsequent retaliation measures from other countries. At the time of completing this Outlook, many petrochemicals – such as polyethylene, polypropylene, polyethylene terephthalate, phenols and ethylene – were exempted from additional tariffs. However, many of the products made

from these materials, including vehicles, clothing, electronics, household appliances and toys would be subject to tariffs. Consequently, it remains to be seen to what extent the petrochemicals sector will be impacted by these measures.
Despite these challenges, technological developments and innovative approaches could also sustain the use of oil-based feedstock in this sector over the long term. A myriad of technologies could lead the way towards a more sustainable future, playing a vital role in helping to overcome challenges related to environment pollution. These include the successful start-up and operation of the demonstration unit for the destruction of perfluoroalkyl and polyfluoroalkyl substances (PFAS), developed by Lummus Technology.
Efficiency and innovative technologies tailored to downstream activities play a role in every aspect of the sector. For example, medium-temperature heat pumps and waste heat recovery technologies in refineries reduce the amount of base energy required for distillation. Electrification, such as the electrically heated steam-cracker developed by BASF, Sabic and Linde could have a significant impact in reducing the industry's carbon footprint.
By leveraging digital twins, ubiquitous sensors, AI and machine learning technologies, the downstream sector can further reduce emissions while balancing the need to remain competitive and ensure workforce competency.
In addition, operators can also investigate the possibility of integrating new energy sources for internal facility use. Refinery and petrochemical heaters, typically designed to run on heavy fuels, can be adapted to burn low carbon hydrogen, thereby reducing emissions and managing NOx output. Integrating renewables into refinery premises provides a direct supply of low-carbon electricity for operations, reducing the reliance on the power grid and lowering overall emissions. Converting surplus renewable energy into synthetic fuels and materials through power-to-X technologies enables the storage and utilization of this energy in various process operations.
Taking into account these countervailing trends and uncertainties, Table 3.9 presents global and regional oil demand outlooks in this sector. At the global level, oil demand is projected to increase by 4.7 mb/d, rising from 15.5 mb/d in 2024 to 20.2 mb/d in 2050. Virtually all of this growth is expected to materialize in the non-OECD, particularly in developing Asia and the Middle East. In contrast, OECD demand in this sector is set to increase through 2035, before peaking and then gradually declining to below 8 mb/d by 2050. This is a similar demand level to that observed in 2024.
Demand additions of 1.1 mb/d, 0.9 mb/d and 0.4 mb/d are anticipated in Other Asia, India and China, respectively. In the medium term, China and Other Asia are set to be the engines of growth; however, India is set to take the leading role in the long term. This growth will be driven by economic and population expansion and supported by the region's well-established processing and manufacturing industries.
These regions are marked by strong demand prospects in the next ten years, on the back of a large number of significant projects that are currently at different stages of development. China alone is developing more than 30 steam crackers and 25 propane dehydrogenation (PDH) projects that are expected to be commissioned during that period. In total, more than 30 million tonnes (mt) and 25 mt of new oil-based capacity in ethylene and propylene, respectively, are likely to be added by 2035. The country is also supported by projects

| Growth | |||||||
|---|---|---|---|---|---|---|---|
| 2024 | 2030 | 2035 | 2040 | 2045 | 2050 | 2024–2050 | |
| OECD Americas | 3.8 | 4.3 | 4.4 | 4.3 | 4.2 | 4.0 | 0.2 |
| OECD Europe | 1.9 | 1.9 | 1.9 | 1.7 | 1.6 | 1.5 | –0.4 |
| OECD Asia-Pacific | 2.0 | 2.1 | 2.2 | 2.2 | 2.2 | 2.2 | 0.2 |
| OECD | 2.7 | 3.0 | 3.1 | 3.2 | 3.2 | 3.1 | 0.4 |
| China | 0.5 | 0.7 | 0.9 | 1.0 | 1.2 | 1.4 | 0.9 |
| India | 1.4 | 1.8 | 2.0 | 2.2 | 2.4 | 2.5 | 1.1 |
| Other Asia | 0.4 | 0.4 | 0.5 | 0.5 | 0.5 | 0.5 | 0.2 |
| Latin America | 1.5 | 1.8 | 2.1 | 2.6 | 3.0 | 3.2 | 1.8 |
| Middle East | 0.2 | 0.2 | 0.2 | 0.3 | 0.3 | 0.4 | 0.1 |
| Africa | 1.1 | 1.2 | 1.2 | 1.2 | 1.2 | 1.2 | 0.1 |
| Russia | 0.0 | 0.0 | 0.0 | 0.0 | 0.0 | 0.0 | 0.0 |
| Other Eurasia | 0.0 | 0.0 | 0.0 | 0.0 | 0.0 | 0.0 | 0.0 |
| Other Europe | 7.9 | 9.2 | 10.1 | 11.1 | 11.9 | 12.5 | 4.6 |
| Non-OECD | 15.5 | 17.5 | 18.5 | 19.3 | 19.9 | 20.2 | 4.7 |
| World | 15.5 | 17.5 | 18.5 | 19.3 | 19.9 | 20.2 | 4.7 |
Table 3.9 Oil demand in the petrochemical sector by region, 2024–2050
Source: OPEC.
integrated into refining facilities, aimed at capturing more value from streams like naphtha, LPG and dry gas that result from refining processes.
Major projects include a joint venture between SABIC and the Fujian Energy and Petrochemical Group that started construction of the SABIC Fujian Petrochemical Complex in February 2024. With an expected ethylene capacity of 1.8 mt per annum (mtpa), the project is scheduled to be commissioned in 2026. More recently, CSPC, a joint venture between CNOOC and Shell, approved the construction of a third ethylene cracker at its Daya Bay site in Huizhou, Guangdong Province. This new cracker is set to add 1.6 mtpa of ethylene capacity, increasing the site's total to 3.8 mtpa. In early 2025, ExxonMobil initiated test runs at its petrochemical complex in Dayawan Petrochemical Industrial Park, also in Huizhou, Guangdong Province. The $10 billion facility includes a 1.6 mtpa steam cracker and several other units.
Other countries like India, Indonesia, Brunei and Taiwan are also expanding their olefins and aromatics capacities to reduce their dependence on derivative imports. Against this backdrop, the petrochemical industry in developing Asia is anticipated to grow rapidly over the medium term, supported by strong GDP growth.
The Middle East is set to be the single largest contributor to global oil demand in the petrochemical sector, estimated at a huge 1.8 mb/d increase over the outlook period. The region continues to attract significant petrochemical capacity investment, leveraging available feedstocks like ethane, LPG, naphtha and refinery dry gas at competitive price levels.
Several regional projects are at various stages of development. For example, in February 2024, QatarEnergy and Chevron Phillips Chemical started a $6 billion project in Ras Laffan

mb/d
Industrial City, Qatar. This will include the region's largest ethane cracker, with an ethylene production capacity of 2.1 mtpa. Another significant project, Borouge 4 – with a capacity of 1.4 mtpa and developed by ADNOC and Borealis – is currently under development in the UAE and is expected to be completed by the end of 2025.
In Saudi Arabia, Aramco and TotalEnergies awarded engineering, procurement and construction contracts worth $11 billion to seven firms for the construction of a giant petrochemical complex in Jubail, Saudi Arabia, in June 2023. The project is expected to be operational by 2027 and reach full capacity in 2028. Additionally, Aramco and Sabic are proceeding with the first crude oil-to-chemicals petrochemical plant in Yanbu, Saudi Arabia, which will be integrated with an existing refinery. Major investments in new propylene capacity are also expected to materialize in the country, including PDH units in Jubail and Yanbu, and a mixed-feed cracker in Jubail.
A number of other petrochemical projects are also expected in other non-OECD regions over the medium term. However, many of these are low-to-medium capacity additions when compared to those under development in Asia and the Middle East. Russia and other Eurasia are leading the way, especially for ethylene and propylene, and are expected to see their total oil demand in this sector increasing by more than 0.2 mb/d – reaching 1.3 mb/d in 2050. Demand in Latin America and Africa is set to reach 0.5 mb/d and almost 0.4 mb/d in 2050, up from 0.4 mb/d and 0.2 mb/d in 2024, respectively.
In the OECD, the strongest growth is expected in OECD Americas (mostly the US), where oil demand in this sector is already expected to increase by around 0.5 mb/d over the medium term, supported by a number of large-scale projects under construction. Given the ample supply of ethane at competitive prices, several large ethane-based steam cracker projects are under construction in the US, with most expected to materialize in the near term. After this, however, it is unlikely that additional expansion projects will be commissioned, as the growth of cheap feedstock is anticipated to end. In turn, this will likely enable the resurgence of more competitive naphtha cracking, driven by integration at refining facilities. Overall, however, oil demand in the OECD Americas petrochemical sector is expected to drop by 0.4 mb/d between 2035 and 2050.
With the exception of the S-Oil Shaheen naphtha cracker in Ulsan, South Korea, which is expected to be operational in 2027, there are no other major projects in the OECD Asia-Pacific. Therefore, oil demand for the petrochemicals sector in this region is projected to experience a slight increase in the medium term, followed by a prolonged plateau, ultimately reaching 2.2 mb/d by 2050.
In contrast to the two regions above, OECD Europe is set to see a minor increase in oil demand in the medium term, due to capacity expansions. However, part of this will be offset by some rationalization and closures that will affect both ethylene and propylene capacity. Thereafter, a gradual oil demand decline is anticipated to the end of the forecast period, reaching 1.5 mb/d, down from 1.9 mb/d in 2024. The main reasons for this decline include relatively low economic growth, rising production costs, as well as stricter recycling rules and emission policies leading to industry rationalization.
Figure 3.23 summarizes these developments from the perspective of major petrochemical feedstocks. It is clear that the structure of petrochemical feedstock demand differs across regions. Petrochemical demand in the OECD Americas and the Middle East is dominated by
Height: 65 mm ethane, while all Asian regions primarily use naphtha. These regional disparities are primarily due to the feedstocks' cost advantages in each region.
At the global level, in 2024, naphtha accounted for the largest share of total demand in this industry at 45%, followed by ethane (27%) and LPG (18%). At the same, naphtha is expected to also provide the largest incremental demand throughout the outlook period, at almost 2.7 mb/d, given the large increases in Asian countries. As a result, naphtha is set to increase its share to 48% in 2050.
Driven by developments in the Middle East and OECD Americas, where the majority of petrochemical feedstock is ethane, demand for this product is set to increase by more than 2.1 mb/d. The share of ethane is anticipated to increase to 32% in 2050. This will be at the expense of LPG and other products, which are set to experience gradual declines.
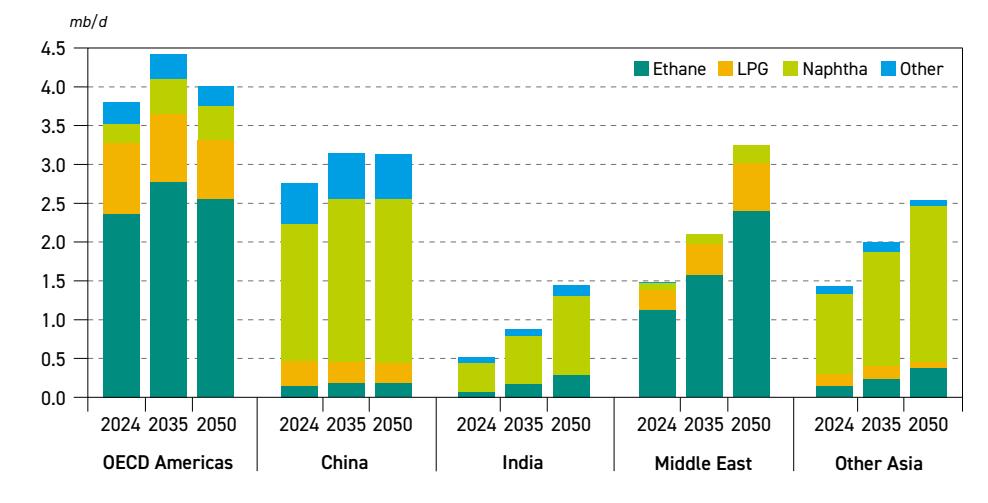
Figure 3.23 Regional demand in the petrochemical sector by product, 2024–2050 mboe/d
Source: OPEC.
3.2.4 Other sectors
Oil consumption in the combined residential, commercial, and agricultural sector is expected to undergo a profound shift during the outlook period. In OECD economies, policies aimed at reducing emissions and enhancing energy efficiency are reshaping demand in these sectors. The key trend is the electrification of households, which is being largely subsidized by various governmental programmes. This trend will likely continue in the years to come, despite some modifications or even cancellations to some initiatives and regulations, such as phasing out oil-based heating systems and promoting low-emission agricultural practices. Despite this trend, it is expected that diesel will remain necessary in agriculture and in rural and offgrid areas. As a result of these developments, OECD oil demand in this sector is expected to increase slightly over the current decade, before declining below 3 mb/d by 2050. This is around 1 mb/d lower than in 2024.
In contrast, non-OECD economies – particularly India, Africa and Latin America – continue to see rising oil demand across this sector, largely due to infrastructure constraints for

natural gas and electricity, and ongoing energy access challenges. In India, government-led initiatives to improve access to LPG are set to result in increasing residential demand for this product, although growing city gas networks in urban areas will likely shift part of this consumption towards natural gas.
Agriculture is expected to continue supporting oil consumption, with mechanization expanding across all developing areas. Diesel-powered irrigation, tractors and food transportation networks are essential for agricultural productivity, reinforcing the role of refined products in these regions. Furthermore, in Sub-Saharan Africa, where modern energy access remains scarce, LPG and kerosene remain key household fuels, while diesel generators supply offgrid electricity.
These trends are evident in Table 3.10, which underscores the growing gap in oil demand between the OECD and non-OECD regions in this sector. While OECD demand is expected to gradually decline, non-OECD demand is set to rise from 7.6 mb/d in 2024 to 10.8 mb/d by 2050. The overall demand change will be in the range of 2.3 mb/d over the forecast period. Most of this growth is expected to come in the form of residential LPG, with an estimated increase of 1.8 mb/d between 2024 and 2050. Significant incremental demand of 0.5 mb/d is also expected for diesel, driven by its use in agriculture and for off-grid electricity generation.
As international trade and global shipping continue to expand on the back of global economic growth, the marine bunkering sector will also evolve accordingly. Oil is projected to retain its central role in this sector, supported by existing widespread infrastructure, high energy density and proven reliability in long-distance maritime transport. At the same time, the fuel
| Growth | |||||||
|---|---|---|---|---|---|---|---|
| 2024 | 2030 | 2035 | 2040 | 2045 | 2050 | 2024–2050 | |
| OECD Americas | 1.5 | 1.8 | 1.9 | 1.8 | 1.4 | 1.2 | –0.3 |
| OECD Europe | 1.5 | 1.6 | 1.4 | 1.2 | 1.2 | 1.2 | –0.4 |
| OECD Asia-Pacific | 0.8 | 0.8 | 0.7 | 0.6 | 0.5 | 0.5 | –0.3 |
| OECD | 3.8 | 4.2 | 4.0 | 3.6 | 3.1 | 2.8 | –1.0 |
| China | 2.7 | 2.9 | 3.0 | 3.1 | 3.1 | 3.1 | 0.3 |
| India | 1.2 | 1.4 | 1.7 | 1.9 | 2.1 | 2.3 | 1.1 |
| Other Asia | 0.8 | 0.9 | 0.9 | 0.9 | 1.0 | 1.0 | 0.2 |
| Latin America | 0.9 | 1.1 | 1.2 | 1.3 | 1.4 | 1.5 | 0.6 |
| Middle East | 0.5 | 0.6 | 0.6 | 0.6 | 0.6 | 0.6 | 0.1 |
| Africa | 0.7 | 0.8 | 0.9 | 1.1 | 1.3 | 1.6 | 0.9 |
| Russia | 0.4 | 0.4 | 0.4 | 0.4 | 0.4 | 0.4 | 0.0 |
| Other Eurasia | 0.2 | 0.2 | 0.2 | 0.2 | 0.2 | 0.2 | 0.0 |
| Other Europe | 0.1 | 0.1 | 0.1 | 0.1 | 0.1 | 0.1 | 0.0 |
| Non-OECD | 7.6 | 8.4 | 9.1 | 9.7 | 10.3 | 10.8 | 3.2 |
| World | 11.4 | 12.6 | 13.2 | 13.3 | 13.4 | 13.6 | 2.3 |
Table 3.10
Oil demand in the residential/commercial/agricultural sector by region, 2024–2050 mb/d
Source: OPEC.

mix used in this sector is becoming more varied, with nearly half of all new vessel orders now LNG-compatible or equipped with dual-fuel engines. This trend is supported by regulatory measures, such as the IMO's 'Strategy on Reduction of GHG Emissions from Ships' and by regional policies in several regions, such as the EU's 'FuelEU Maritime Regulation', both of which promote the use of fuels with lower emissions in international shipping.
A step forward in this direction was achieved at the 83rd Meeting of the MEPC of the IMO, held in April 2025, which approved the draft text for the "IMO Net-Zero Framework" detailing new fuel standards and a pricing mechanism for shipowners, both aiming to reduce future emissions. An important element of this framework is onboard carbon capture and storage (OCCS), which is being considered as a way for shipowners to reduce emissions while continuing to use conventional fuels. In parallel, the expansion of power infrastructure at major ports is expected to reduce auxiliary fuel use during berthing. This may delay the need for the widespread adoption of alternative fuels across all vessel classes.
Among the available fuel options, LNG currently offers the most likely alternative to oil. The growing use of LNG is supported by an expanding global bunkering network and the increasing availability of dual-fuel engines, making it a feasible option for operators seeking to meet regulatory standards without compromising vessel performance. In fact, the expected increase in LNG use is the main reason why oil demand growth in maritime transportation is well below the rate of global trade expansion. However, the relatively long lifetime of vessels will make this process rather gradual. It is expected to take decades rather than years for the penetration of LNG vessels to be large enough to substitute for part of oil demand.
Moreover, it will likely take even longer for other alternative fuels to significantly penetrate the bunkering sector. Often considered options include biofuels, ammonia, hydrogen and its derivatives, such as e-ammonia, e-methanol and e-methane. All these options, however, face several challenges. These include limited availability, high production costs, safety concerns and a lack of infrastructure. Ammonia, for example, raises toxicity and handling concerns, while its low energy content limits its suitability for long-distance voyages. While hydrogen produces no emissions at the point of use, it is energy-intensive to produce, difficult to store and lacks the required infrastructure for broad application in the shipping sector. Similarly, biofuels such as biodiesel and ethanol have not yet found a significant role in marine fuel consumption, as reflected in the data.
Accounting for all these factors, as presented in Table 3.11, global oil demand for marine bunkers is projected to increase from 4.3 mb/d in 2024 to 5.2 mb/d by 2050. Most of this growth is expected to occur during the medium term. Afterward, demand is likely to stabilize in the long term, supported by operational efficiency improvements and the gradual uptake of LNG and, to a lesser extent, other alternative fuels.
Most of the incremental demand is projected to come from non-OECD countries. Other Asia is expected to see the highest increase, reaching approximately 1.8 mb/d by 2050, up from 1.2 mb/d in 2024. This is driven by growth in trade and maritime activity through key regional ports in Singapore, Indonesia and Malaysia. The Middle East is also projected to experience steady growth, reflecting its strategic position as a global bunkering hub. Somewhat smaller, but steady growth is expected in Latin America, Africa and India. China's demand is forecast to remain relatively stable, supported by its broad and well-established trade network.

| Growth | |||||||
|---|---|---|---|---|---|---|---|
| 2024 | 2030 | 2035 | 2040 | 2045 | 2050 | 2024–2050 | |
| OECD Americas | 0.5 | 0.5 | 0.5 | 0.5 | 0.5 | 0.4 | 0.0 |
| OECD Europe | 0.8 | 0.8 | 0.8 | 0.7 | 0.6 | 0.6 | –0.2 |
| OECD Asia-Pacific | 0.2 | 0.2 | 0.2 | 0.2 | 0.2 | 0.2 | –0.1 |
| OECD | 1.5 | 1.6 | 1.5 | 1.4 | 1.3 | 1.2 | –0.3 |
| China | 0.3 | 0.4 | 0.4 | 0.4 | 0.4 | 0.4 | 0.0 |
| India | 0.0 | 0.0 | 0.1 | 0.1 | 0.1 | 0.1 | 0.0 |
| Other Asia | 1.2 | 1.4 | 1.6 | 1.7 | 1.8 | 1.8 | 0.6 |
| Latin America | 0.3 | 0.4 | 0.4 | 0.5 | 0.5 | 0.5 | 0.2 |
| Middle East | 0.5 | 0.5 | 0.6 | 0.6 | 0.7 | 0.7 | 0.2 |
| Africa | 0.2 | 0.2 | 0.2 | 0.2 | 0.2 | 0.3 | 0.1 |
| Russia | 0.2 | 0.2 | 0.2 | 0.2 | 0.1 | 0.1 | 0.0 |
| Other Eurasia | 0.1 | 0.1 | 0.1 | 0.1 | 0.1 | 0.1 | 0.0 |
| Other Europe | 0.1 | 0.1 | 0.1 | 0.1 | 0.1 | 0.1 | 0.0 |
| Non-OECD | 2.8 | 3.3 | 3.5 | 3.7 | 3.9 | 4.0 | 1.2 |
| World | 4.3 | 4.8 | 5.0 | 5.1 | 5.2 | 5.2 | 0.9 |
Table 3.11 Oil demand in the marine bunkers sector by region, 2024–2050
Source: OPEC.
In contrast, OECD countries are expected to follow a different trajectory. Oil demand for maritime transport in these economies is likely to see marginal growth in the medium term, followed by a gradual decline in the long term due to increasing use of LNG, improved operational efficiencies and policies aiming to reduce reliance on conventional fuels. However, the overall OECD demand drop is not large – around 0.3 mb/d between 2024 and 2050.
Much like other sectors, 'other industry' (industry excluding petrochemicals) is also expected to maintain its substantial reliance on oil-based products. This is primarily due to the role that these products, including diesel, residual fuel oil and LPG, play in energy-intensive industries, such as cement, steel and manufacturing.
Projections for oil demand in this sector (including a refinery's own use) is shown in Table 3.12. Global demand is set to rise from almost 13 mb/d in 2024 to 15 mb/d by 2050, though regional trends vary considerably.
In the OECD, a combination of technological progress, energy efficiency improvements and fuel substitution is expected to slow oil demand growth momentum in the sector. This is particularly evident in OECD America, where natural gas, especially in the US, remains a cost-effective alternative in many industrial applications. This leads to declining oil demand in the long term.
Consequently, OECD oil demand in 'other industry' is projected to rise modestly over the medium term, from 5 mb/d in 2024 to 5.3 mb/d in 2030, followed by a gradual decline to 4.5 mb/d by 2050. The most notable drop is expected in OECD America, where overall demand falls by 0.3 mb/d, while OECD Europe and OECD Asia-Pacific see more moderate reductions. Residual fuel demand will largely remain concentrated in hard-to-abate industry segments, where commercially viable alternatives to oil are limited.
mb/d
153
| Growth | |||||||
|---|---|---|---|---|---|---|---|
| 2024 | 2030 | 2035 | 2040 | 2045 | 2050 | 2024–2050 | |
| OECD Americas | 2.8 | 3.1 | 3.2 | 2.9 | 2.7 | 2.5 | –0.3 |
| OECD Europe | 1.4 | 1.4 | 1.4 | 1.4 | 1.4 | 1.3 | 0.0 |
| OECD Asia-Pacific | 0.8 | 0.8 | 0.7 | 0.6 | 0.6 | 0.6 | –0.2 |
| OECD | 5.0 | 5.3 | 5.3 | 4.9 | 4.7 | 4.5 | –0.5 |
| China | 2.2 | 2.3 | 2.3 | 2.3 | 2.2 | 2.2 | 0.0 |
| India | 1.1 | 1.2 | 1.4 | 1.5 | 1.7 | 1.8 | 0.7 |
| Other Asia | 1.0 | 1.1 | 1.2 | 1.3 | 1.3 | 1.4 | 0.4 |
| Latin America | 1.0 | 1.2 | 1.3 | 1.3 | 1.4 | 1.4 | 0.4 |
| Middle East | 1.2 | 1.4 | 1.6 | 1.6 | 1.6 | 1.6 | 0.4 |
| Africa | 0.6 | 0.7 | 0.8 | 0.8 | 0.9 | 1.0 | 0.4 |
| Russia | 0.6 | 0.6 | 0.6 | 0.6 | 0.6 | 0.6 | 0.1 |
| Other Eurasia | 0.2 | 0.3 | 0.3 | 0.3 | 0.3 | 0.3 | 0.1 |
| Other Europe | 0.2 | 0.2 | 0.2 | 0.2 | 0.2 | 0.2 | 0.0 |
| Non-OECD | 8.0 | 8.9 | 9.6 | 9.9 | 10.2 | 10.5 | 2.6 |
| World | 12.9 | 14.2 | 14.9 | 14.8 | 14.9 | 15.0 | 2.0 |
Table 3.12 Oil demand in the 'other industry' sector by region, 2024–2050
Source: OPEC.
In contrast, non-OECD economies are expected to experience significant demand growth over the outlook period. Driven by ongoing industrialization, infrastructure development and urbanization, demand in these regions is projected to increase from 8.0 mb/d in 2024 to 10.5 mb/d by 2050.
India is projected to lead this expansion, contributing 0.7 mb/d to the incremental demand, supported by rapid industrial growth. Africa, Latin America and the Middle East are expected to add 0.4 mb/d each. In China, despite continued efforts to expand the use of electricity and natural gas and implement efficiency improvements, industrial oil demand is expected to remain relatively stable throughout the outlook period.
From the perspective of rail and domestic waterways, this segment constitutes the smallest portion of the transportation sector, with current oil demand in the range of 2 mb/d. The majority of this is concentrated in just two countries, China and the US, which combined account for around 60% of the global demand.
In the case of China, the bulk of the demand in this sector – currently around 0.7 mb/d out of a total of 0.8 mb/d – is linked to the world's largest inland waterway network that has over 110,000 km of navigable rivers, lakes and canals. Moreover, there are several ongoing projects to expand this network and enhance the capacity of existing ones. This includes the Yangtze River Economic Belt Development, which involves deepening channels and expanding ports on the Yangtze River, revitalizing the Beijing-Hangzhou Grand Canal and expanding the Pearl River system, among others.
Expanding the waterways system is set to intensify traffic and lead to an increase in related oil demand. While part of this growth will be offset by railway electrification, most of China's railways have been electrified already. The net effect of these diverging trends is incremental demand growth of 0.2 mb/d between 2024 and 2050 (Table 3.13).

In addition to China, some minor demand expansion is also projected in the remaining non-OECD regions, such as Other Asia, Latin America and the Middle East. In these regions, however, the expected demand increase is primarily linked to the use of railway systems rather than domestic waterways. Other Asia and Latin America will likely continue to depend
| 2024 | 2030 | 2035 | 2040 | 2045 | 2050 | Growth 2024–2050 | |
|---|---|---|---|---|---|---|---|
| OECD Americas | 0.5 | 0.5 | 0.5 | 0.5 | 0.4 | 0.4 | –0.1 |
| OECD Europe | 0.1 | 0.1 | 0.1 | 0.1 | 0.1 | 0.1 | 0.0 |
| OECD Asia-Pacific | 0.1 | 0.1 | 0.1 | 0.1 | 0.1 | 0.1 | 0.0 |
| OECD | 0.7 | 0.7 | 0.7 | 0.7 | 0.6 | 0.5 | –0.2 |
| China | 0.8 | 0.9 | 0.9 | 0.9 | 0.9 | 1.0 | 0.2 |
| India | 0.1 | 0.1 | 0.1 | 0.1 | 0.1 | 0.1 | 0.0 |
| Other Asia | 0.1 | 0.2 | 0.2 | 0.2 | 0.2 | 0.2 | 0.1 |
| Latin America | 0.1 | 0.2 | 0.2 | 0.2 | 0.2 | 0.2 | 0.1 |
| Middle East | 0.1 | 0.1 | 0.1 | 0.1 | 0.1 | 0.1 | 0.1 |
| Africa | 0.0 | 0.0 | 0.0 | 0.0 | 0.0 | 0.0 | 0.0 |
| Russia | 0.1 | 0.1 | 0.1 | 0.1 | 0.2 | 0.2 | 0.1 |
| Other Eurasia | 0.0 | 0.0 | 0.0 | 0.0 | 0.0 | 0.0 | 0.0 |
| Other Europe | 0.0 | 0.0 | 0.0 | 0.0 | 0.0 | 0.0 | 0.0 |
| Non-OECD | 1.3 | 1.5 | 1.6 | 1.7 | 1.7 | 1.8 | 0.5 |
| World | 2.0 | 2.2 | 2.3 | 2.4 | 2.3 | 2.3 | 0.3 |
Table 3.13 Oil demand in the rail and domestic waterways sector by region, 2024–2050
mb/d
Source: OPEC.
on diesel-powered freight rail, while Russia is also set to maintain a high reliance on oil across its vast rail network, particularly in remote areas where electrification remains challenging. These regional dynamics contribute to an overall non-OECD demand increase of 0.5 mb/d between 2024 and 2050.
Demand in this sector in OECD Americas is more equally split between rail transportation and waterways. From a current demand of 0.5 mb/d, railways account for 0.3 mb/d and waterways 0.2 mb/d. In the railway segment, most development projects focus on electrification and modernization, allowing for higher speeds and improved safety, rather than network expansion. Therefore, future oil demand in this segment will be mostly affected by improved engine efficiency and the substitution of oil with electricity.
A similar outlook applies to the segment of domestic waterways. While there are some projects to enhance the capacity of existing waterways, it is also becoming evident in the US that LNG is expanding as an important fuel source for domestic inland waterway vessels, particularly on major US rivers like the Mississippi, Ohio and Illinois. The combined effect in both segments is that OECD Americas oil demand is set to decline by around 0.1 mb/d between 2024 and 2050. With little change is expected in the remaining two OECD regions, overall OECD demand in this sector is expected to decline by 0.2 mb/d over the forecast period.
3
mb/d
Finally, the oil demand outlook for the electricity generation sector is presented in Table 3.14. Projections indicate that global oil demand in this sector is set to decline by 0.5 mb/d over the forecast period, falling from 4.5 mb/d in 2024 to 4 mb/d in 2050. The primary reason for this decline is the almost complete elimination of oil used for electricity generation in the OECD. Indeed, oil demand in each of the OECD regions is expected to be below 0.1 mb/d at the end of the forecast period. This indicates that its use will likely be restricted to power generation within a few refineries, the use of diesel generators in remote places and for emergency back-up purposes. By then, virtually no oil is anticipated to be used in large power plants.
In contrast, oil is set to remain important for grid stability, rural electrification and backup power in most non-OECD countries, although its role is expected to decline and be marginal
| Growth | |||||||
|---|---|---|---|---|---|---|---|
| 2024 | 2030 | 2035 | 2040 | 2045 | 2050 | 2024–2050 | |
| OECD Americas | 0.3 | 0.2 | 0.1 | 0.1 | 0.1 | 0.1 | –0.3 |
| OECD Europe | 0.2 | 0.1 | 0.1 | 0.2 | 0.1 | 0.1 | 0.0 |
| OECD Asia-Pacific | 0.4 | 0.4 | 0.3 | 0.2 | 0.1 | 0.1 | –0.3 |
| OECD | 0.9 | 0.7 | 0.6 | 0.5 | 0.4 | 0.2 | –0.7 |
| China | 0.4 | 0.3 | 0.3 | 0.3 | 0.3 | 0.3 | –0.1 |
| India | 0.1 | 0.2 | 0.2 | 0.2 | 0.2 | 0.3 | 0.2 |
| Other Asia | 0.4 | 0.4 | 0.4 | 0.4 | 0.3 | 0.4 | –0.1 |
| Latin America | 0.5 | 0.6 | 0.6 | 0.6 | 0.6 | 0.6 | 0.1 |
| Middle East | 1.5 | 1.5 | 1.5 | 1.4 | 1.2 | 1.3 | –0.2 |
| Africa | 0.5 | 0.6 | 0.7 | 0.8 | 0.8 | 0.8 | 0.3 |
| Russia | 0.2 | 0.2 | 0.2 | 0.2 | 0.1 | 0.1 | 0.0 |
| Other Eurasia | 0.0 | 0.0 | 0.0 | 0.0 | 0.0 | 0.0 | 0.0 |
| Other Europe | 0.0 | 0.0 | 0.0 | 0.0 | 0.0 | 0.0 | 0.0 |
| Non-OECD | 3.6 | 3.8 | 3.9 | 3.8 | 3.6 | 3.7 | 0.1 |
| World | 4.5 | 4.5 | 4.5 | 4.3 | 4.0 | 4.0 | –0.5 |
Table 3.14 Oil demand in the electricity generation sector by region, 2024–2050
Source: OPEC.
in some regions. The Middle East, in particular, is expected to reduce oil demand for power generation as this region increasingly shifts toward gas-fired power plants and finds greater economic value in exporting oil rather than using it domestically for electricity production. Marginal demand declines are also expected in China and Other Asia, given that they face competition from fast growing investments in renewables and nuclear.
Elsewhere, Africa stands out as the largest growth market for oil-fired power, with demand projected to rise by 0.3 mb/d between 2024 and 2050. This increase is driven by persistent electricity shortages and a continued reliance on diesel generators across many parts of the continent. For similar reasons, some demand growth is projected in India and Latin America, although the range of expansion is lower.

3.3 Oil demand outlook by product
Reflecting the regional and sectoral future oil demand trends already outlined, this section provides a detailed analysis from the perspective of refined product categories. From 2024 to 2050, total oil demand is expected to increase by 19.2 mb/d. Table 3.15 highlights this growth across products, which underscores that expansion is not unform across the various categories. Light and middle distillates are expected to drive most of the increase, while heavy refined products are set to witness only modest changes due to regulatory constraints and ongoing oil substitution by alternative energy sources.
| Growth | |||||||
|---|---|---|---|---|---|---|---|
| 2024 | 2030 | 2035 | 2040 | 2045 | 2050 | 2024–2050 | |
| Ethane/LPG | 14.7 | 16.3 | 17. | 17.5 | 17.9 | 18.3 | 3.6 |
| Naphtha | 6.9 | 8.0 | 8.6 | 9.0 | 9.4 | 9.6 | 2.7 |
| Gasoline | 27.2 | 28.9 | 29.6 | 29.9 | 30.1 | 30.3 | 3.1 |
| Light products | 48.8 | 53.2 | 55.1 | 56.5 | 57.4 | 58.2 | 9.4 |
| Jet/kero | 7.8 | 9.3 | 10.2 | 10.8 | 11.6 | 11.9 | 4.1 |
| Gasoil/diesel | 28.7 | 31.0 | 32.3 | 32.6 | 32.7 | 33.1 | 4.4 |
| Middle distillates | 36.5 | 40.3 | 42.4 | 43.4 | 44.3 | 45.1 | 8.6 |
| Residual fuel | 6.9 | 7.6 | 7.8 | 7.7 | 7.5 | 7.4 | 0.6 |
| Other products | 11.6 | 12.2 | 12.6 | 12.4 | 12.3 | 12.3 | 0.7 |
| Heavy products | 18.4 | 19.8 | 20.3 | 20.1 | 19.8 | 19.7 | 1.3 |
| World | 103.7 | 113.3 | 117.9 | 120.0 | 121.6 | 122.9 | 19.2 |
Table 3.15 Global oil demand by product, 2024–2050
Source: OPEC.
Among light products, ethane and LPG are expected to record the most significant increase, largely due to their expanding importance in the petrochemical sector. Ethane demand is set to be concentrated in OECD Americas, the Middle East and China, where it serves as a feedstock for the ethylene production that is essential for manufacturing plastics and synthetic materials. In contrast, LPG demand is set to be more geographically dispersed, supporting both industrial and residential use. This is particularly the case in its replacement of coal and biomass in households across India, Africa and Latin America. However, ethane/LPG expansion in OECD Europe and OECD Asia-Pacific is expected to remain limited due to increasing electrification and efficiency improvements. The overall contribution of ethane/LPG to future demand growth is anticipated to be around 3.6 mb/d between 2024 and 2050 (Figure 3.24).
Alongside the strong outlook for ethane and LPG, naphtha demand is also projected to grow consistently over the outlook period, primarily to support ongoing industrialization and the expansion of the petrochemical sector in China, India and Other Asia. As the production of plastics, synthetic rubber and chemicals accelerates globally, requirements for naphtha will remain strong. Against this backdrop, naphtha demand is expected to increase by 2.7 mb/d over the forecast period, reaching a level of close to 10 mb/d by 2050.
Mobility-related fuels are expected to follow divergent regional trajectories. Gasoline demand is projected to rise from 27.2 mb/d to 30.3 mb/d, supported by increasing car ownership in

mb/d
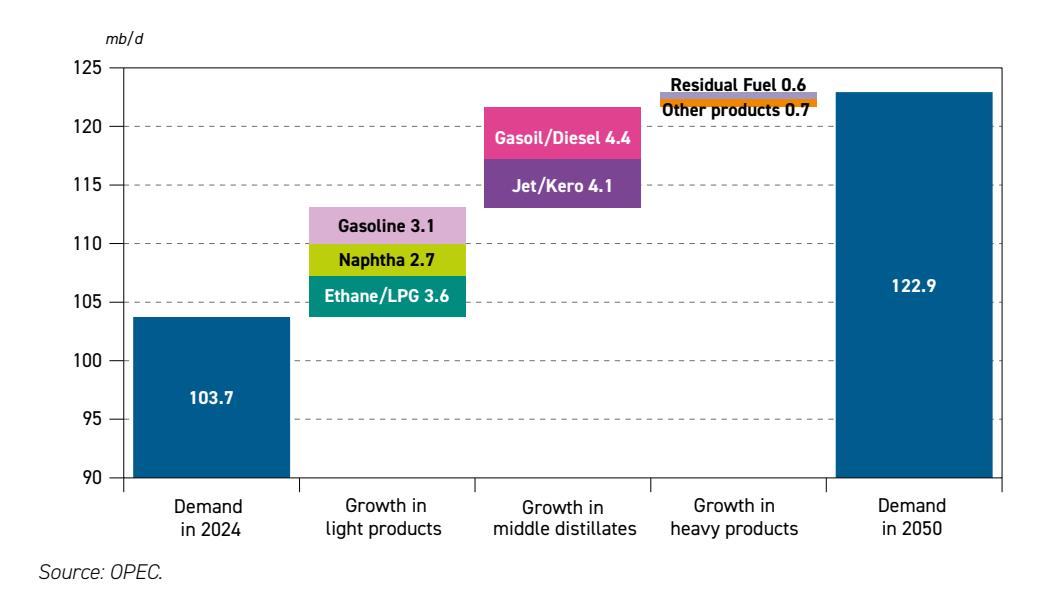
Figure 3.24 Demand growth by product category between 2024 and 2050
regions such as India, Other Asia, Africa and Latin America, where EV adoption remains constrained by high costs and limited infrastructure. In these markets, ICE-based vehicles are set to continue to dominate, which in turn will sustain gasoline consumption. That said, this growth trend is expected to moderate over time, as EV penetration accelerates, and fuel efficiency standards tighten. These trends are already being observed in OECD Americas, OECD Europe and China, in particular. In these economies, policy-driven transitions and technological advancements are anticipated to reduce gasoline demand in the longer term.
Middle distillates, including jet/kerosene and gasoil/diesel, are expected to see steady growth over the outlook period. Jet/kerosene demand is projected to increase by 4.1 mb/d, reaching 11.9 mb/d by 2050, driven by rising air travel in China, Other Asia and the Middle East. This growth is supported by the expansion of low-cost carriers and increasing air passenger volumes, underscoring aviation's growing role in developing economies.
Although SAF is anticipated to gain some market share in OECD countries, particularly after 2030, its high production costs and limited availability are likely to constrain its widespread adoption, preserving the dominance of conventional jet fuel. In contrast, domestic kerosene use in OECD regions is expected to decline steadily as households transition to electric heating, partly offsetting the above-mentioned growth in jet/kerosene.
Diesel/gasoil demand is projected to rise from 28.7 mb/d to 33.1 mb/d, representing the largest absolute increase among all refined products, a gain of 4.4 mb/d over the outlook period. This growth reflects diesel's essential role in commercial transport and industrial activity, supplemented by its use in other sectors, such as agriculture and residential etc. The strongest expansion is expected before 2030, fuelled by freight transport in various modes and industrial output.

Demand growth for this product, however, is likely to slow in the following decades, as emissions regulations tighten and alternative fuel technologies gradually play a more important role. While diesel use is expected to decline in OECD Europe and OECD Americas, it will remain vital in non-OECD regions, notably India, Africa, Latin America and Other Asia, where economic and infrastructural barriers continue to hinder the widespread adoption of alternative energy sources. Height: 65 mm
Figure 3.25 highlights these evolving dynamics, showing a slowdown in gasoline and diesel growth after 2030, while products like ethane/LPG, naphtha and jet fuel continue to expand.
Finally, heavy refined products are projected to see relatively stable demand over the outlook period, with residual fuel oil continuing to serve as a critical input for industrial operations and maritime transport. However, its use in power generation is expected to decline steadily, driven by tightening environmental regulations and cost-competitive alternatives. Figure 3.25
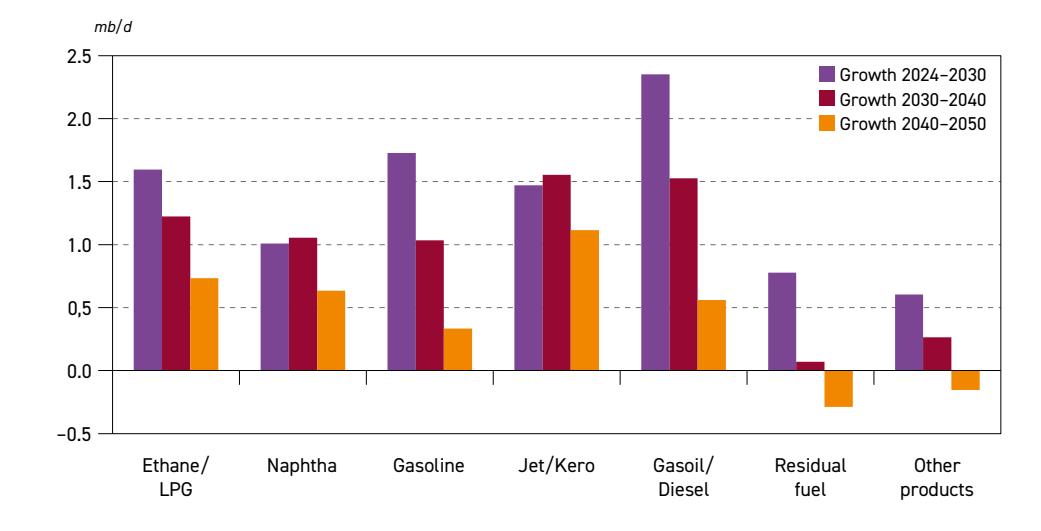
Figure 3.25 Growth in global oil demand by product
Source: OPEC.
Demand for residual fuel oil is forecast to peak at 7.8 mb/d around 2035, before gradually dropping to 7.4 mb/d by 2050, reflecting the impact of IMO regulations and its substitution in the power sector. This trend is especially evident in OECD countries, where renewables and natural gas are gaining market share. In contrast, demand growth is set to continue in non-OECD regions, particularly Other Asia, India, the Middle East and Africa, where economic conditions and logistical constraints sustain its use in marine bunkering and industrial processes.
Other refined products, including bitumen, petroleum coke, lubricants and waxes, are expected to see a minor demand increase, primarily supported by infrastructure development and industrial expansion in developing economies. In particular, bitumen consumption is expected to remain robust as governments in Asia and Africa continue to prioritize road and
transportation projects. At the same time, lubricants are anticipated to retain their importance in industrial machinery and automotive applications, with the strongest growth occurring in non-OECD markets, where manufacturing and vehicle production are on the rise. Overall, demand for these heavy products is set to increase from 18.4 mb/d in 2024 to 19.7 mb/d by 2050, a net gain of 1.3 mb/d.

Liquids supply
Key takeaways
- • In the medium term, non-DoC liquids supply is set to increase by 5.7 mb/d from 53.3 mb/d in 2024 to 59 mb/d in 2030. The US is expected to drive this growth, contributing 1.4 mb/d, or around 25%, followed by Brazil (+1.1 mb/d), Qatar and Canada (each +0.5 mb/d), Argentina (+0.3 mb/d) and others.
- • Tight oil remains the key element supporting rising US production, with volumes increasing from 14.7 mb/d in 2024 to 16.5 mb/d in 2030. Thereafter, however, due to gradual resource depletion, output is projected to plateau around those levels for most of the 2030s, and subsequently decline again to 14.8 mb/d by 2050. Given its size, US tight oil makes up over 25% of non-DoC liquids, even by 2050.
- • US liquids production is also set to peak in 2030, while total non-DoC liquids are now projected to hit a peak of just under 60 mb/d in the mid-2030s, and then remain at a plateau just below that level until 2050.
- • Beyond 2030, long-term non-DoC liquids supply growth only takes place in Canada, Brazil and Argentina, as well as a handful of other smaller increases, and is offset by declines in other mature producing regions. Viewing the entire 2024–2050 period, non-DoC liquids nonetheless increase by 5.6 mb/d, or from 53.3 mb/d in 2024 to 58.9 mb/d in 2050.
- • Non-crude liquids play an increasingly important role in non-DoC liquids supply growth. While, in the medium term, crude production makes up half of the net growth, non-DoC crude production goes into decline in the early 2030s. Over the long-term horizon, natural gas liquids (NGLs), biofuels and other liquids, including Canadian oil sands and synthetic fuels, expand by 2.3 mb/d, 2.1 mb/d and 2.6 mb/d, respectively, in addition to an increase of 1 mb/d in global refinery processing gains.
- • As a result of non-DoC liquids supply plateauing from the 2030s, continued demand growth means that DoC liquids are projected to keep growing. From 49.1 mb/d in 2024, it increases to 64.1 mb/d in 2050, or by 15 mb/d. As a result, the DoC producers' share of the global liquids supply market increases from 48% in 2024 to 52% in 2050.
- • To reliably supply markets, against the backdrop of rising demand, as well as to offset natural decline in mature fields, global cumulative investments of $18.2 trillion are required over the 2025–2050 period (all in US$2025).
- • The bulk of the required investment, $14.9 trillion, or $574 billion per annum (p.a.) on average, is for the upstream sector. The downstream and midstream sectors require another $2 trillion and $1.3 trillion, respectively. The challenge of meeting these investment requirements is huge, and any shortfall in meeting these needs risks market stability and energy security.
This chapter describes the outlook for liquids supply from 2024–2050. As in previous WOOs, the medium-term projections for 2024–2030 and the longer-term outlook are discussed separately, due to the different methodologies employed. The medium-term view relies on a bottom-up approach, identifying upstream project start-ups, their progress and the underlying decline in mature fields, while the long-term outlook is based on an assessment of the available resource base and other factors.
4.1 Global liquids supply outlook
Despite current economic and political uncertainty, global oil supply continues to expand to meet rising oil demand. Market fundamentals remain supportive, as OPEC and its partners in the DoC continue to work tirelessly to maintain market stability for the benefit of all stakeholders. This is despite uncertainty surrounding the macroeconomic outlook, lingering inflation concerns, ongoing interest rate adjustments, elections in 2024 resulting in a number of new governments and ongoing geopolitical turmoil.
At the same time, demand for oil remains healthy compared to the historical average and investment in future oil supplies continues, albeit with concerns as to whether sufficient levels of capital expenditure can be sustained. Looking at the bigger picture, however, it is evident that a consensus is emerging around OPEC's long-held view that the world's future energy needs must be met by an all-of-the-above approach. Thus, a more balanced approach is emerging among policymakers, investors, analysts and consumers alike, acknowledging the oil industry's crucial role in ensuring energy security and economic stability.
From the perspective of future supply growth, it should be noted that while supply growth from non-DoC producers is expected to remain robust in the short and medium term, it is clearly decelerating. This is partly due to the US's slowing contribution to global supply growth, as premium acreage in the country's shale patch becomes rarer and oil companies focus on prioritizing capital discipline over growth (Figure 4.1).

Figure 4.1 Long-term non-DoC liquids supply outlook
Source: OPEC.

LIQUIDS SUPPLY
Other non-DoC producers, including Brazil, Canada, Qatar, Argentina and a handful of new producers in Africa and Latin America, are set to provide some growth in the short to medium term. However, due to its relative size, the projected peak and plateau in total US liquids supply in the early 2030s will ultimately result in a long, gentle plateau for non-DoC overall supply at around 60 mb/d throughout the 2030s and 2040s (Table 4.1).
Table 4.1
Long-term global liquids supply outlook mb/d
| 2024 | 2030 | 2035 | 2040 | 2045 | 2050 | Change 2024–2050 | |
|---|---|---|---|---|---|---|---|
| US | 21.8 | 23.1 | 22.3 | 21.3 | 20.4 | 19.6 | –2.2 |
| of which: tight oil | 14.7 | 16.5 | 16.4 | 16.0 | 15.4 | 14.8 | 0.1 |
| Canada | 5.9 | 6.4 | 6.5 | 6.8 | 7.2 | 7.7 | 1.8 |
| of which: oil sands | 3.4 | 3.6 | 3.8 | 4.1 | 4.5 | 5.1 | 1.7 |
| OECD Americas | 27.7 | 29.6 | 28.9 | 28.2 | 27.6 | 27.3 | –0.4 |
| OECD Europe | 3.5 | 3.6 | 3.7 | 3.7 | 3.8 | 3.9 | 0.4 |
| OECD Asia Pacific | 0.4 | 0.4 | 0.4 | 0.4 | 0.5 | 0.5 | 0.0 |
| Latin America | 7.3 | 9.6 | 10.7 | 11.3 | 11.4 | 11.3 | 4.0 |
| Middle East | 2.0 | 2.6 | 2.6 | 2.6 | 2.6 | 2.7 | 0.7 |
| Africa | 2.3 | 2.9 | 3.1 | 3.1 | 2.9 | 2.8 | 0.5 |
| China | 4.6 | 4.6 | 4.5 | 4.5 | 4.5 | 4.5 | –0.1 |
| India | 0.8 | 0.9 | 0.9 | 0.9 | 0.8 | 0.8 | 0.0 |
| Other Asia | 1.6 | 1.6 | 1.5 | 1.4 | 1.4 | 1.3 | –0.3 |
| Other Eurasia | 0.4 | 0.4 | 0.3 | 0.3 | 0.3 | 0.3 | –0.1 |
| Other Europe | 0.1 | 0.1 | 0.1 | 0.1 | 0.1 | 0.1 | 0.0 |
| Processing gains | 2.5 | 2.9 | 3.1 | 3.2 | 3.4 | 3.5 | 1.0 |
| Non-DoC liquids | 53.3 | 59.0 | 59.8 | 59.7 | 59.3 | 58.9 | 5.6 |
| DoC liquids | 49.1 | 54.7 | 58.2 | 60.4 | 62.3 | 64.1 | 15.0 |
| World | 102.4 | 113.6 | 118.0 | 120.1 | 121.6 | 123.0 | 20.6 |
Source: OPEC.
As a result, and with global demand for oil projected to continue growing over the longterm horizon, the relative importance of DoC liquids increases as it will provide most of the required supply growth in the latter part of the outlook. In absolute terms, DoC liquids supply is projected to rise from 49.1 mb/d in 2024 to 64.1 mb/d by 2050, or by 15 mb/d (Figure 4.2), and is expected to increase its share of the global market from 48% to 52% over this timeframe. Figure 4.2
Figure 4.2
Composition of global liquids supply growth, 2024–2050
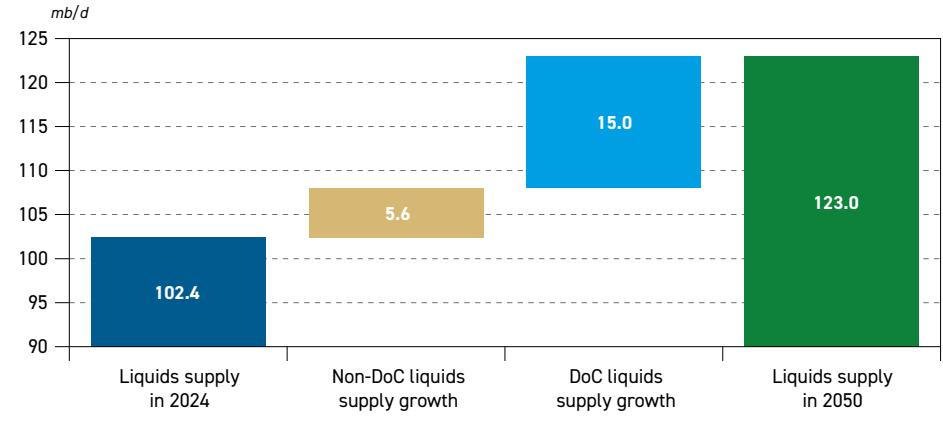
Source: OPEC.
4.2 Drivers of medium-term and long-term liquids supply
Global liquids supply growth in the medium term remains dominated by US liquids production, particularly by the ongoing rise in tight oil. Continued efficiency gains in production techniques there, as well as sustained investment, are set to result in continued, albeit slowing, liquids production.
Several established producers, including Canada, Qatar and Norway, are also expected to contribute additional medium-term supplies (Figure 4.3), alongside newer 'frontier' areas, including Brazilian ultra-deepwater and Argentinian tight oil. Additionally, barrels are also anticipated from newcomers Senegal, Suriname, Uganda and Namibia. Non-crude liquids, including NGLs and biofuels, are also set to add to global liquids volumes.
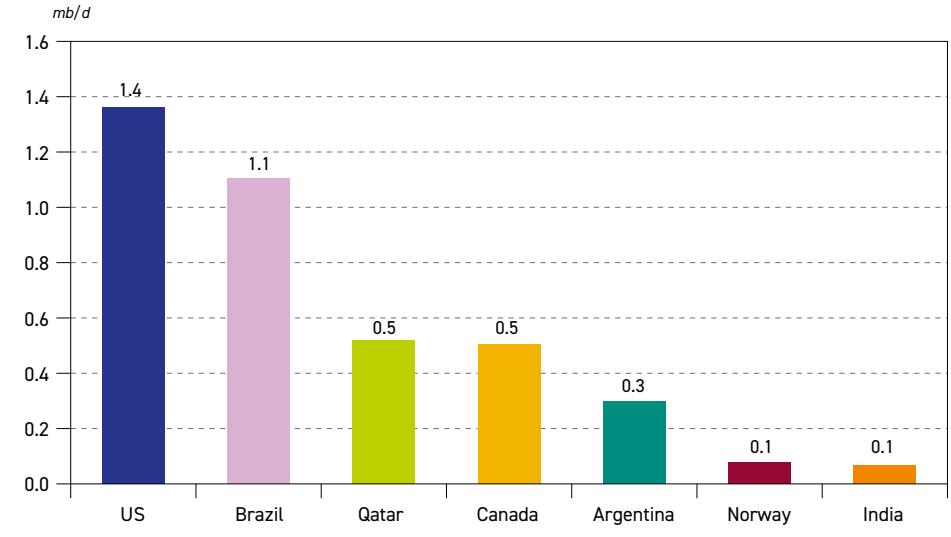
Figure 4.3 Major contributors to non-DoC total liquids growth, 2024–2030
Source: OPEC.
Overall, global liquids supply is projected to expand from 102.4 mb/d in 2024 to 113.6 mb/d in 2030, or by 11.3 mb/d. Of this, incremental non-DoC liquids supply should make up for 5.7 mb/d, or just over 50%, with DoC liquids contributing about 5.5 mb/d. In the long term, global liquids supply is expected to increase further to 123 mb/d in 2050, or by 20.6 mb/d, compared to 2024. This is in line with the global oil demand outlook in this WOO's Reference Case. With non-DoC liquids supply expected to plateau from the 2030s, its contribution over the entire forecast period is 5.6 mb/d, or nearly 30%, while DoC liquids supply is projected to add 15 mb/d, or around 70%.
4.3 Breakdown of liquids supply outlook by main regions
Regionally, in the medium term, two areas dominate liquids supply growth. OECD Americas is by far the largest producing area in this Outlook's regional breakdown. It is projected to see production increase by 1.9 mb/d from 2024 to 2030. Latin America is on course for liquids production to rise by 2.3 mb/d over the same period. Elsewhere, with the exception of non-DoC Middle East and Africa – where liquids production is projected to rise by 0.6 mb/d and
0.5 mb/d, respectively, from 2024 to 2030 – all other non-DoC regions see production remaining largely flat.
In the long term, Latin America stands out as the major source of liquids supply growth, with total output rising by 4 mb/d from 2024 to 2050 (Figure 4.4). The Middle East, Africa and OECD Europe are also projected to experience increases in production, by 0.7 mb/d, 0.5 mb/d and 0.4 mb/d, respectively. OECD Americas, however, due to the peak and plateauing of US production, sees total liquids supply dropping by 0.4 mb/d from 2024 to 2050, as does Other Asia (non-DoC Asia, excluding China and India). Other regions are projected to maintain a largely flat liquids supply profile over the long term.
Other Eurasia Other Europe Processing gains Latin America OECD Americas China OECD Europe Middle East Africa Other Asia Other Asia-Pacific India 0 5 10 15 20 25 30 35 mb/d 2024 2030 2050
Figure 4.4 Non-DoC liquids supply outlook by region
Source: OPEC.
US
US total liquids production continues to grow. It increased by a sizeable 0.8 mb/d in 2024 to average 21.8 mb/d, a new record high. Driven mainly by increases in tight oil (including both tight crude and unconventional NGLs), US liquids production is projected to expand by 1.4 mb/d in the medium term, rising to 23.1 mb/d by 2030 (Figure 4.5). While signs of slowing growth are apparent, US shale expansion has not yet run out of steam. Following a phase of consolidation marked by a flurry of merger and acquisition (M&A) deals, the sector is now seemingly set on a steady path of more restrained investment and growth, while ensuring profitability and shareholder returns. Nonetheless, increments in the medium term add up to net tight oil growth of 1.8 mb/d by 2030 to reach 16.5 mb/d, of which around half each is from tight crude and unconventional NGLs, respectively (Table 4.2).
At the same time, US tight oil is not the only source of liquids growth. Federal offshore production in the US Gulf of Mexico is projected to increase from 1.8 mb/d in 2024 to 2 mb/d by 2030. Notably, upstream projects expected to start production in 2025 include Ballymore, Salamanca, Shenandoah and Whale, with respective capacities of 75 thousand barrels per

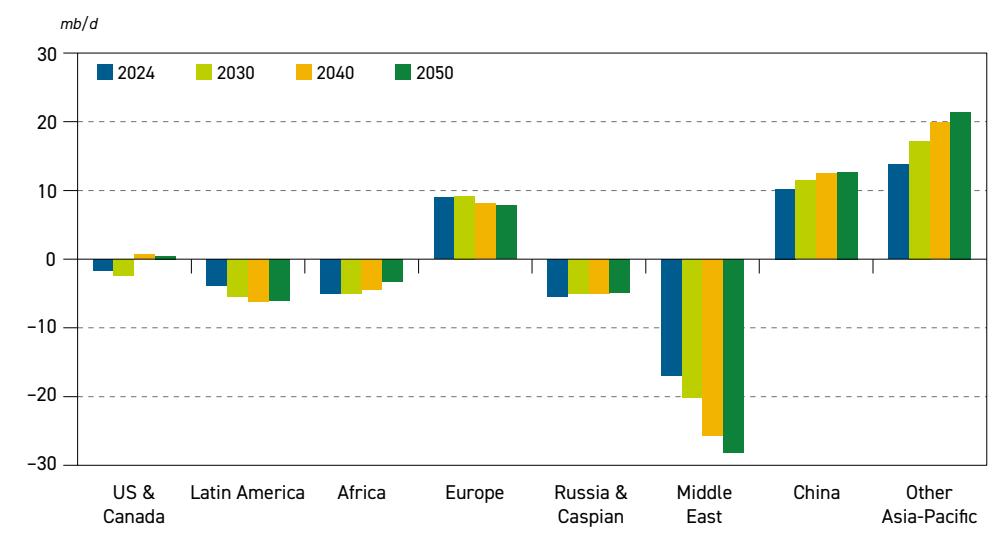
Figure 4.5 US total liquids production outlook by source
Source: OPEC.
Table 4.2 US total liquids production outlook
| 2024 | 2030 | 2035 | 2040 | 2045 | 2050 | Change 2024–2050 | |
|---|---|---|---|---|---|---|---|
| US tight oil | 14.7 | 16.5 | 16.4 | 16.0 | 15.4 | 14.8 | 0.1 |
| of which: tight crude | 8.9 | 9.7 | 9.4 | 9.0 | 8.4 | 7.8 | –1.1 |
| of which: unconventional NGLs | 5.8 | 6.8 | 7.0 | 7.0 | 7.0 | 7.0 | 1.3 |
| US Gulf of Mexico crude | 1.8 | 2.0 | 1.7 | 1.5 | 1.3 | 1.2 | –0.6 |
| US Alaska crude | 0.4 | 0.5 | 0.4 | 0.3 | 0.2 | 0.1 | –0.3 |
| US other crude | 2.1 | 1.4 | 0.9 | 0.6 | 0.4 | 0.3 | –1.9 |
| US other NGLs | 1.2 | 1.0 | 1.0 | 1.0 | 1.0 | 1.0 | –0.2 |
| US biofuels | 1.4 | 1.5 | 1.6 | 1.7 | 1.7 | 1.8 | 0.4 |
| US other liquids | 0.2 | 0.2 | 0.2 | 0.3 | 0.3 | 0.4 | 0.2 |
| Memo item: US total crude | 13.2 | 13.6 | 12.5 | 11.3 | 10.3 | 9.4 | –3.9 |
| Memo item: US total NGLs | 6.9 | 7.8 | 8.0 | 8.0 | 8.0 | 8.0 | 1.1 |
| Total US liquids production | 21.8 | 23.1 | 22.3 | 21.3 | 20.4 | 19.6 | –2.2 |
Source: OPEC.
day (tb/d), 60 tb/d, 40 tb/d and 80 tb/d. BP's Kaskida is projected to add 100 tb/d from 2028, while Shell's Sparta is set to contribute another 80 tb/d in the same year. In 2029, the 80 tb/d Tiber field should start operating.
In Alaska, liquids production is also on track to grow modestly, from 0.4 mb/d in 2024 to 0.5 mb/d in 2030. Here, a number of key oil fields are due to come online in the medium term. This includes Narwhal, a tie-back into the Alpine field, due to add 25 tb/d in 2026. In the same year, Pikka should start operations, with 80 tb/d capacity, which could possibly be expanded to 120 tb/d at a later stage. The Liberty field is due to start up in 2028, with

mb/d
40 tb/d capacity, while the huge Willow field is projected to come onstream in 2029, with 180 tb/d.
The growth highlighted is offset by crude production declines in other areas. Here the focus is on continuing steady declines in legacy conventional onshore production in the Lower-48, which is set to fall from 2.1 mb/d in 2024 to 1.4 mb/d in 2030. Conventional NGLs are also expected to decline modestly, from 1.2 mb/d in 2024 to 1.0 mb/d in 2030. Biofuels production will likely increase somewhat, from 1.4 mb/d in 2024 to 1.5 mb/d in 2030, while other liquids, which include small volumes of methyl tertiary-butyl ether (MTBE), kerogen and others, is set to stay steady at 0.2 mb/d to 2030.
However, with tight oil hitting a plateau after 2030, total US liquids is projected to decline in the years following, albeit slowly. From 23.1 mb/d in 2030, output gradually drops to 19.6 mb/d by 2050. Tight oil production maintains a plateau over 16 mb/d for most of the 2030s, while unconventional NGLs output still sees a modest increase for some of that time. After that, natural decline in tight crude sees overall tight oil production drop, although it still averages 14.8 mb/d by 2050. The US total liquids production is expected to decline to 19.6 mb/d by 2050.
At the time of writing, the extent to which several energy-related executive orders and other policy shifts put in place by the new US administration would have an impact on the outlook for US liquids supply was still unclear.
Canada
Canada is projected to be the third-largest source of medium-term liquids supply growth, after the US and Brazil, as well as the most important long-term supply growth driver within the non-DoC grouping. Total Canadian liquids production is set to expand from 5.9 mb/d in 2024 to 6.4 mb/d in 2030, mostly driven by an increase in oil sands production of around 0.2 mb/d, alongside a smaller increment in conventional NGLs output of 0.1 mb/d (Figure 4.6).
Figure 4.6

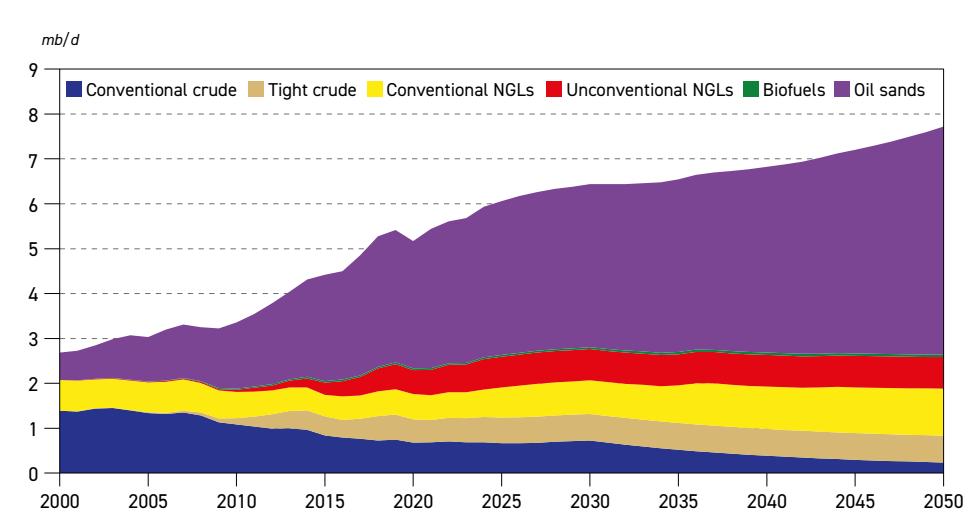
Source: OPEC.

In the medium term, major conventional offshore fields on Canada's East Coast are set to boost output. In 2026, the West White Rose field is set to start up, operated by Cenovus, adding 75 tb/d to the larger White Rose complex that has been in production since the 1980s. From 2028, the even larger Bay du Nord field is projected to come onstream, with a capacity of 180 tb/d.
Meanwhile, oil sands production, as well as NGLs production, continue to expand. In the medium term, the Trump administration's threats of tariffs, including on the 4 mb/d of crude that the US imports from Canada and which make up a sizeable chunk of the US Midwest refinery industry's diet, are casting a cloud over future upstream expansion plans. In 2024, the long-awaited Trans Mountain crude pipeline expansion was finally inaugurated, boosting capacity to ship Albertan production to the West Coast from around 300 tb/d to just under 900 tb/d. However, the dispute with the US (at the time of writing) has reawakened discussions about other, shelved, pipeline expansion plans to the east and west coasts, as at least some of these volumes are essentially landlocked or captive. For instance, the Northern Gateway pipeline, which would carry a proposed 525 tb/d from Alberta to the British Columbia coast, is being discussed again, as is the Energy East line, an existing gas pipeline that would be repurposed to carry 1.1 mb/d from Alberta to the Atlantic Coast in New Brunswick. Even the much-criticized Keystone XL pipeline, which was ultimately aborted by the Biden administration, and which would have expanded capacity to pump crude from Alberta to the US Midwest, has been discussed again. Meanwhile, capacity on the Trans Mountain pipeline could reportedly be expanded by a further 300 tb/d by using drag-reducing agents and more pumping stations.
In the longer term, however, Canadian liquids production is projected to increase, as output from the country's oil sands continues to rise gradually. Production (including both raw bitumen, as well as upgraded 'synthetic' crude) is expected to increase from 3.4 mb/d in 2024 to 3.6 mb/d in 2030, and further to 5.1 mb/d by 2050. This outlook is based on a steady cost base, existing infrastructure, lower above-ground and below-ground risks than in other producing areas and the enormous resource base.
Tight crude production is projected to remain steady at 0.6 mb/d, while conventional crude, after a medium-term boost, is expected to decline from a high point of 0.7 mb/d in 2030 to 0.2 mb/d by 2050. Total NGLs, including both conventional and unconventional, are set to keep expanding, growing from 1.3 mb/d in 2024 to 1.4 mb/d in 2030, and further to 1.7 mb/d in the long term. With very modest growth in biofuels too, Canadian total liquids production is projected to increase from 5.9 mb/d in 2024 to 6.4 mb/d in 2030, and further to 7.7 mb/d by 2050, consolidating Canada's position as one of the world's major oil producers.
Norway
From a low of 1.7 mb/d in 2019, a flurry of investment following a temporary tax respite window set up during the COVID-19 pandemic led to around five years of growth in liquids production, reaching an average of 2 mb/d in 2024. Going forward, however, the outlook for Norway's liquids production is more modest, with total liquids production projected to rise to 2.1 mb/d by 2030. The last major fields currently scheduled to come onstream in this period are the 200 tb/d Johan Castberg project, which started up in March 2025, and the Yggdrasil field, with 80 tb/d capacity, which is set to start pumping in 2027. Much of the output gains in recent years have come from the super-giant Johan Sverdrup field, which, after several expansions, now has a capacity of around 750 tb/d. The field may yet see further drilling, at a minimum to support

continued plateau production. Various other projects have been mooted, including in Norway's Barents Sea, such as Wisting, but remain on the drawing board for now.
Regarding the longer-term outlook, companies active in Norway's waters have been investing more in exploration, not least because of energy security concerns in Europe, and nearby countries' desire to source more energy from their neighbour. Still, absent further large-scale upstream projects, Norway's liquids production is set to plateau at just over 2 mb/d for the first half of the 2030s, before a decline sets in, with output ultimately dropping to average 1.6 mb/d by 2050 (Figure 4.7).

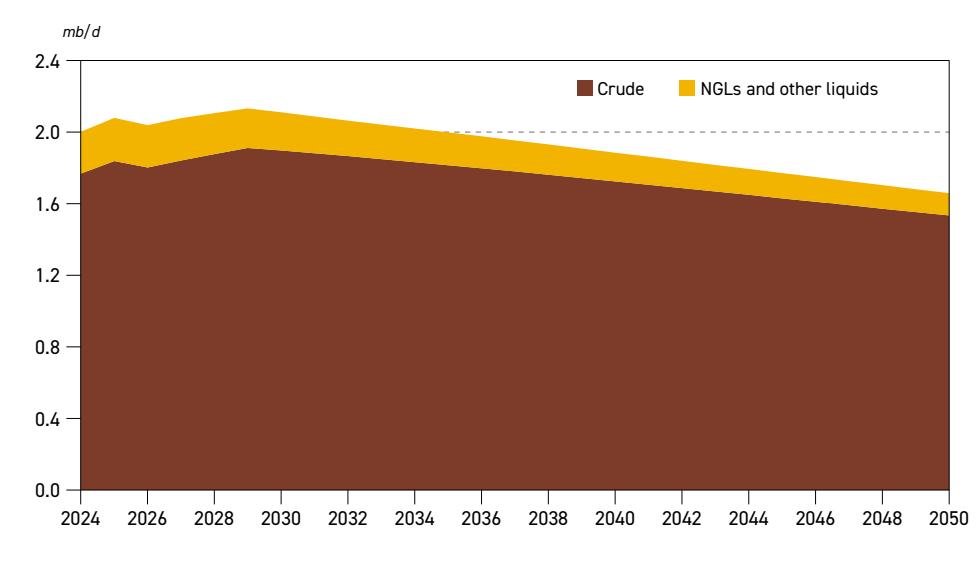
Norway total liquids production outlook by source
Source: OPEC.
UK
In the UK, the liquids supply outlook points to modest but inevitable decline, continuing the downward trend observed since its peak late in the late 1990s. The new government has kept in place a windfall tax regime established by the previous Conservative government and maintained allowances for capital investments that can be offset against taxes, confirming that no further changes to the scheme will take place.
Having said it would issue 'no new licences to explore new oil and gas fields', most analysts' interpretation is that the government could wave through specific projects, citing energy security, and possibly allow tiebacks to existing fields, but the signals have been mixed.
In the absence of a meaningful upstream project list, crude output is set to continue its decline from 0.6 mb/d in 2024 to 0.5 mb/d in 2030. This is set to be offset by a modest increase in biofuels and other liquids, meaning that total liquids stay steady at 0.7 mb/d in this period. Nonetheless, UK liquids production is considered to remain in terminal decline, and despite further increases in biofuels and SAF (both biojet and the synthetic variant), volumes are projected to fall further, to average just below 0.6 mb/d by 2050 (Figure 4.8).

4
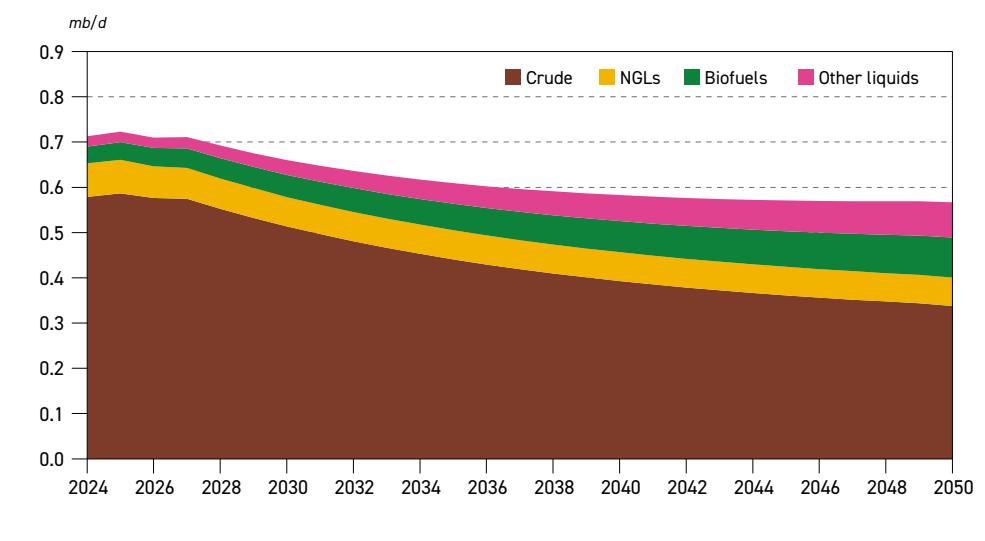
Figure 4.8 UK total liquids production outlook by source
Source: OPEC.
Brazil
Brazil remains one of the main drivers of non-DoC liquids supply growth. In the medium term, Brazil is only second after the US, with projected production growth of 1.1 mb/d, from 4.2 mb/d in 2024 to 5.3 mb/d in 2030. Brazil has a rich list of major upstream projects in the pipeline, with some 17 major floating production, storage and offloading vessels set to come onstream in the coming years, adding a total gross capacity of 2.9 mb/d.
Even beyond the medium-term horizon, Brazil is expected to see total liquids production continue to expand, albeit at a more modest pace. Assuming continued activity in the deepwater, pre-salt basins, the possible opening up of other frontiers, as well as a modest increase in fuel ethanol production, Brazil's total liquids production is expected to grow to a peak of around 5.8 mb/d in the latter 2030s and still average 5.7 mb/d by 2050.
Brazil's energy outlook will be discussed in more depth in Chapter 8 of this Outlook.
Argentina
Argentina remains a rising star in non-DoC liquids production, as tight oil output in the key Vaca Muerta basin keeps expanding steadily. In the medium term, Argentina's liquids supply is projected to rise from 0.9 mb/d to 1.2 mb/d by 2030 and keep growing thereafter. Having attained a certain critical mass, further investment, infrastructural expansions and government support have been forthcoming, resulting in steady growth. In December 2024, construction started on the $3 billion Vaca Muerta South pipeline, with a 550 tb/d capacity to pump crude to the Atlantic Coast and with a Very Large Crude Carrier (VLCC) terminal for exports. The pipeline, which can later be expanded to 700 tb/d, is likely to be commissioned in 2026 or 2027. Additionally, Argentina's government has put in place tax breaks and other regulatory measures that are helping the continued boom and optimism around Vaca Muerta.

Beyond 2030, tight crude production is projected to keep growing, driving total crude production to 1.4 mb/d by 2050. Combined with an expected modest increase in NGLs and biofuels, total liquids production is expected to reach 1.8 mb/d (Figure 4.9).
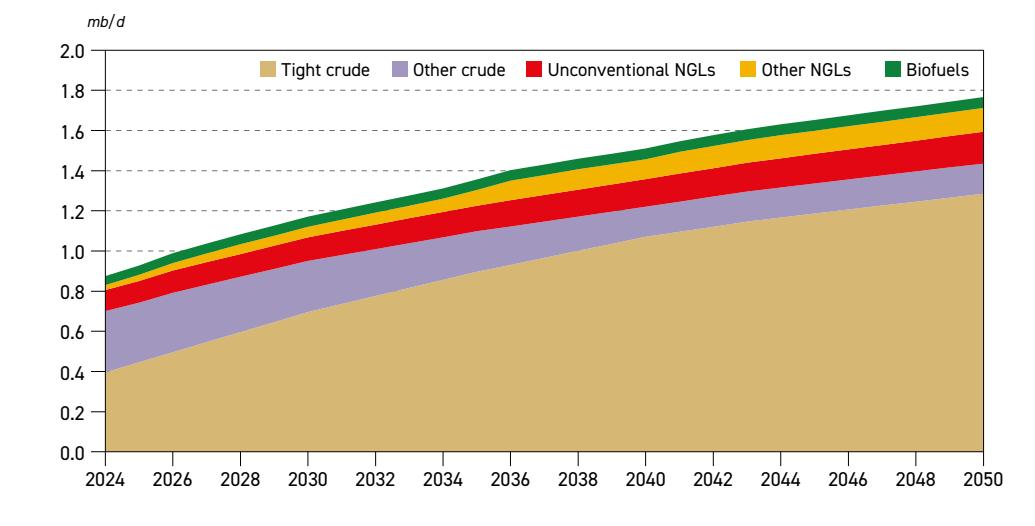
Figure 4.9 Argentina total liquids production outlook by source
Source: OPEC.
Suriname
Following the success of offshore production in neighbouring regions, such as Brazil, Suriname is set to become the continent's newest oil producer. In late 2024, TotalEnergies took a final investment decision (FID) on the Gran Morgu project, which is due to come onstream from 2028 with an initial production capacity of 220 tb/d. This will incorporate the Sapakara South and Krabdagu fields and will likely see more capacity added in the late 2020s. As such, Suriname's production should rise to around 270 tb/d by the end of the decade.
There are high hopes that Suriname's offshore waters will ultimately prove as prolific as some adjacent fields, and there is much exploration interest in the country. TotalEnergies, Shell and Chevron together plan to drill some ten new exploratory wells between 2025 and 2027, and some other potential field developments, including Keskesi and Sapakara West, have to some extent already been delineated for potential future production. This means the country's production could grow further in the 2030s and beyond.
Qatar
Total liquids production in Qatar is projected to rise from 1.9 mb/d in 2024 to 2.4 mb/d in 2030, thus providing the third-largest source of non-DoC supply growth in the medium term. The planned expansion in gas output at the country's huge North Field is set to result in an increase in associated NGLs from 1.1 mb/d to 1.6 mb/d by 2030. Crude oil output meanwhile is expected to stay flat at 0.6 mb/d in the medium term. After 2030, a small further uptick in NGLs production volumes is expected, meaning total liquids increases up to average

2.5 mb/d by 2050. While there are currently no further planned expansions at the North Field, projections of strong growth in global natural gas demand (and LNG flows) provide significant upside potential for Qatari liquids production (Figure 4.10).
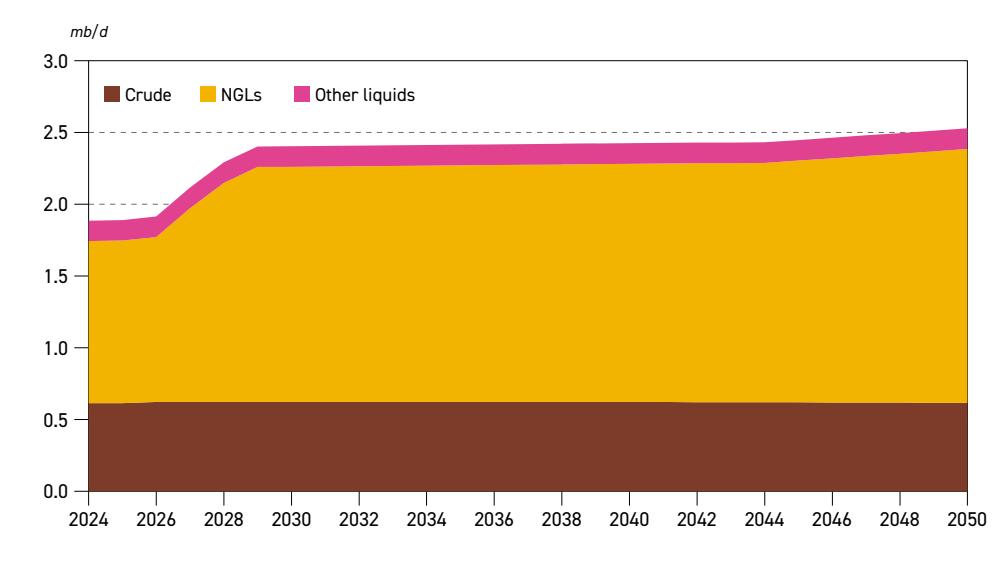
Figure 4.10 Qatar total liquids production outlook by source
Source: OPEC.
Africa
In sub-Saharan Africa, a number of countries are experiencing, or are set to experience, a surge in liquids production growth (Figure 4.11). In Senegal, historically a very small producer, the large offshore Sangomar phase 1 field started operations in 2024, with a total capacity of 100 tb/d. Subsequent phases may add more capacity. In the Ivory Coast, after the Eni-led phase 2


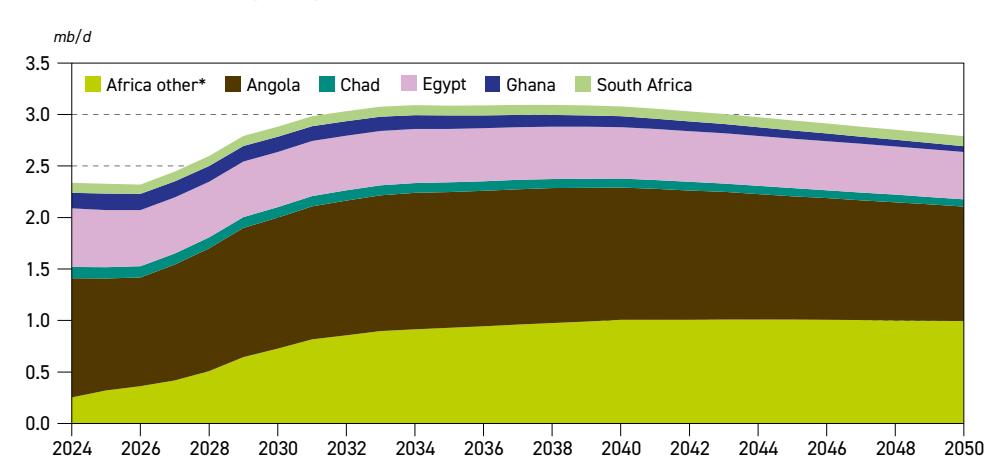
* Africa other includes Cameroon, the Ivory Coast, Namibia, Niger, Senegal, Uganda and smaller producers, and excludes African DoC producers.
Source: OPEC.

of the major Baleine field started pumping in 2024, adding another 40 tb/d, Baleine 3 is now on course to come onstream in 2028, boosting capacity by another 90 tb/d. This will put total field capacity at a sizeable 150 tb/d. In Angola, the Begonia field is set to add 30 tb/d during 2025, while, from 2028, the Kaminho project, which comprises the Cameia and Golfinho fields, is set to bring another 70 tb/d onstream. In Uganda, stage 1 of the large Lake Albert project is well underway. Furthermore, the Tilenga oil field is due to start up in 2026 with a capacity of 190 tb/d, while the Kingfisher field is set to follow in 2027, adding 40 tb/d.
Lastly, perhaps the country receiving the most coverage remains Namibia. Despite news reports about Shell having to write off its 2022 Graff discovery, and Chevron also reporting an exploratory well that disappointed, TotalEnergies reportedly remains on track to take a final investment decision (FID) on its large Venus project, probably in 2026. Once developed, the first phase of Venus is expected to have a production capacity of 150 tb/d, which may possibly be followed by further stages of development. The Galp-led Mopane field, with a probable 120 tb/d capacity, is likely next in line to be developed, adding barrels from early next decade. Several other discoveries remain on the drawing board, some of which can be assumed to be likely developed.
India
India is projected to see a modest increase in total liquids supply over the medium term, with output rising from 0.8 mb/d in 2024 to 0.9 mb/d in 2030. In part, this stems from a slight rise in crude production, with increased drilling, including at the major Mumbai High field offshore India's west coast. In part, however, it is also due to an increase in biofuels production, predominantly fuel ethanol, but also the emergence of some biodiesel production. Ethanol is supported by a government target of 20% in gasoline to be reached by 2025–2026. There is the possibility this percentage could be higher in future. As such, total biofuels production is due to rise from 110 tb/d in 2024 to 140 tb/d by 2030.
While biofuels production is projected to keep expanding beyond 2030, albeit slowly, crude output is expected to plateau around current levels in the 2030s, and then decline. This is despite major efforts by the government to create incentives for major Indian national oil companies to develop major drilling programmes, especially offshore. However, given the maturity of the current production base, and in the absence of major discoveries, total Indian liquids production is projected to slip again modestly in the 2040s, to average 0.8 mb/d by 2050 (Figure 4.12).
Figure 4.12 India total liquids production outlook by source
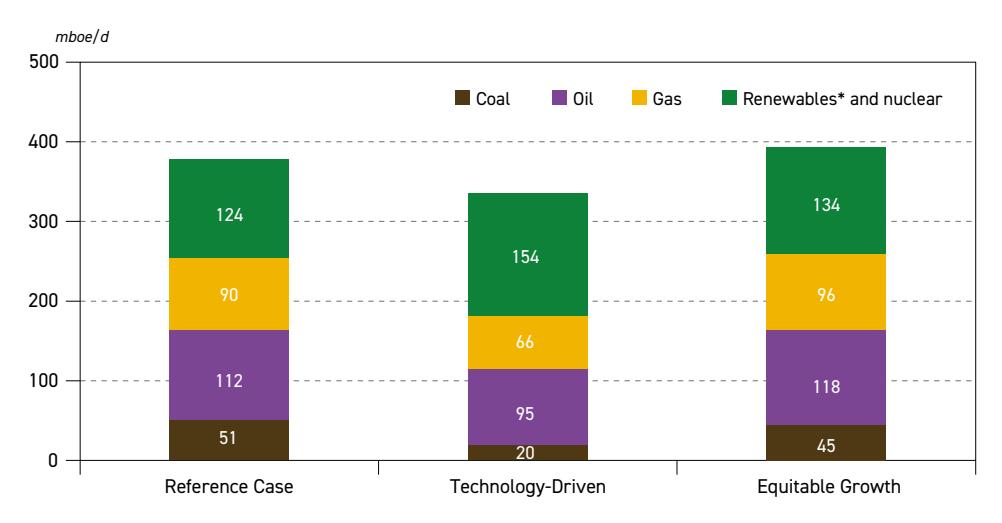
Source: OPEC.

China
China's outlook for liquids supply exhibits a steady trend, with total liquids production flat in the medium term, averaging 4.6 mb/d, and then decreasing very modestly over the remainder of the outlook period. Looking below the surface, however, the aggregate number hides diverging trends among different types of liquids. Crude oil production is set to decline from a recent mini-peak, falling from 4.2 mb/d in 2024 to 4 mb/d in 2030 and ultimately to 3.6 mb/d by 2050 (Figure 4.13). Maturity in a number of key large old fields, as well as the relative dearth of major new start-ups, are the main drivers behind this trend. This is despite huge efforts from Chinese majors to increase recovery rates, with large drilling campaigns and the use of enhanced oil recovery (EOR) techniques.
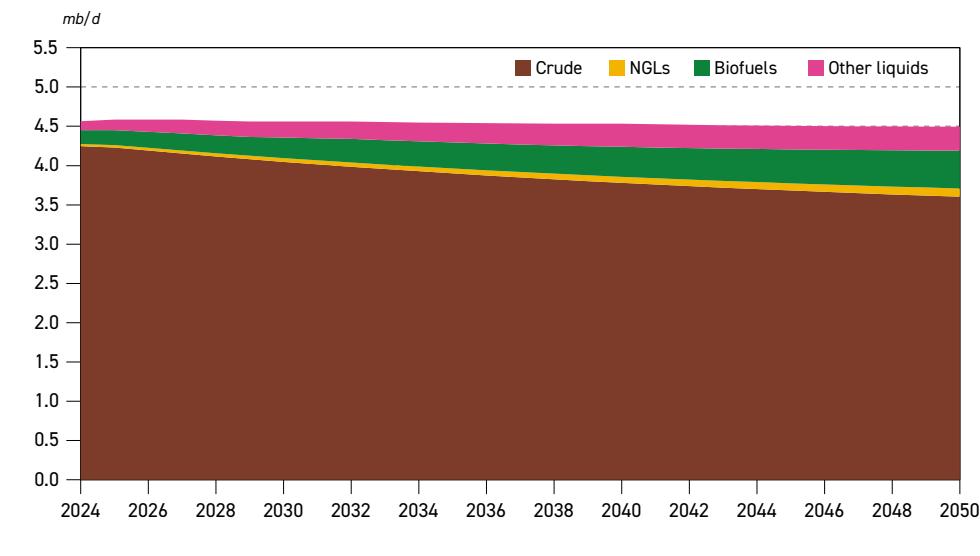
Figure 4.13 China total liquids production outlook by source
Source: OPEC.
On the flip side, tight crude volumes, while still modest compared to the US or Canada, are expected to continue to rise, from 290 tb/d in 2024 to 320 tb/d in 2030 and further beyond. Also offsetting the expected crude oil production decline is a steady increase in biofuels, including fuel ethanol, biodiesel and modest volumes of biojet. Total biofuels production is projected to rise from 0.1 mb/d in 2024 to 0.3 mb/d in 2050, with further potential to the upside. Lastly, higher other liquids production also serves to offset crude oil's decline, including a modest increase in CTLs, which ultimately rises to 0.3 mb/d by 2050, as well as SAF, which increases to 0.2 mb/d by 2050.
4.4 Breakdown of liquids supply by type
While crude oil provides half of the 5.7 mb/d growth projected for non-DoC liquids supply in the medium term, followed by expected growth in NGLs (+1.6 mb/d), biofuels (+0.6 mb/d), other liquids (+0.4 mb/d) and refinery processing gains (+0.3 mb/d), this dynamic is reversed in the period beyond 2030.
LIQUIDS SUPPLY
mb/d
Over the 2024–2050 period, non-DoC liquids supply is projected to see total growth of 5.6 mb/d. Gains in NGLs, other liquids, biofuels and refinery processing gains more than offset the projected crude production decline of 2.4 mb/d (Table 4.3).
| 2024 | 2030 | 2035 | 2040 | 2045 | 2050 | Change 2024–2050 | |
|---|---|---|---|---|---|---|---|
| Crude | 32.1 | 34.9 | 34.3 | 32.9 | 31.4 | 29.8 | –2.4 |
| NGLs | 11.1 | 12.8 | 13.1 | 13.3 | 13.3 | 13.4 | 2.3 |
| Biofuels | 3.2 | 3.8 | 4.3 | 4.8 | 5.1 | 5.4 | 2.1 |
| Other liquids | 4.2 | 4.6 | 5.0 | 5.5 | 6.1 | 6.9 | 2.6 |
| Global refinery processing gains | 2.5 | 2.9 | 3.1 | 3.2 | 3.4 | 3.5 | 1.0 |
| Total non-DoC | 53.3 | 59.0 | 59.8 | 59.7 | 59.3 | 58.9 | 5.6 |
Table 4.3 Non-DoC liquids supply outlook by type
Source: OPEC.
Tight oil
The US remains the dominant force in tight oil, with output making up nearly 90% of non-DoC tight oil, and over 25% of total non-DoC supply in 2024. While US volumes are set to expand by 1.8 mb/d in the medium term to 16.5 mb/d, they are then expected to decline to 14.8 mb/d by 2050, thus only increasing marginally over the entire long-term forecast period.
Currently, Canada is the second-largest non-DoC tight oil producer (tight crude and unconventional NGLs combined), with production averaging 1.2 mb/d in 2024, and projections for a small increase ahead. The growth story is similar for China, albeit at lower overall levels, with tight oil output rising from 0.3 mb/d to 0.5 mb/d by 2050. The rising star is clearly Argentina, where volumes are projected to continue expanding strongly, growing from 0.5 mb/d in 2024 to 1.4 mb/d by 2050. By then, Argentina is expected to have overtaken Canada as the non-DoC's second-largest tight oil producer (Table 4.4).
2024 2030 2035 2040 2045 2050 Change 2024–2050 US 14.7 16.5 16.4 16.0 15.4 14.8 0.1 Canada 1.2 1.3 1.3 1.3 1.3 1.3 0.1 Argentina 0.5 0.8 1.0 1.2 1.3 1.4 0.9 China 0.3 0.3 0.4 0.4 0.4 0.5 0.2 Total tight oil 16.7 19.0 19.2 18.9 18.5 18.1 1.3
Table 4.4 Non-DoC tight oil production outlook
Source: OPEC.
US tight oil production is projected to keep growing, albeit at a slower pace. From 14.7 mb/d in 2024 (tight crude and unconventional NGLs combined), production is set to grow to a peak of 16.5 mb/d in 2030. Afterwards, it is expected to slowly decline, averaging 14.8 mb/d in 2050 – still

mb/d
slightly higher than in 2024 (Figure 4.14). Ultimately, peak production will occur due to a depletion of prime or so-called 'tier 1' acreage; in other words, high-quality areas where attractive returns and resource availability incentivize continued investment and activity beyond what is required to maintain steady production, and hence, cash flow.
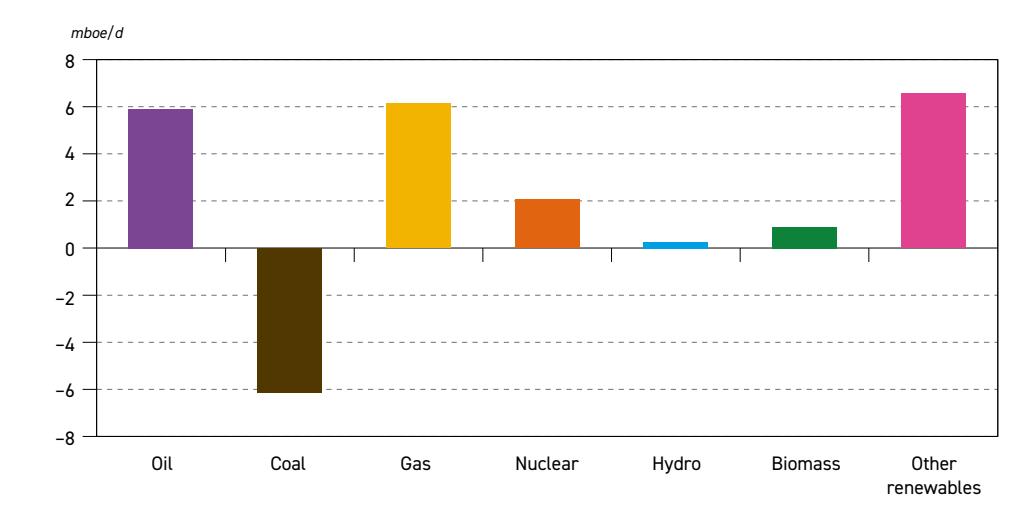
Figure 4.14 Composition of US tight oil production by play
Source: OPEC.
Based on the planned and announced activity of producers, as well as this Outlook's Reference Case assumption of favourable fundamentals being sustained, investment will likely continue for a while, even as companies retain a tight grip on so-called 'capital discipline'. At the same time, efficiency gains of various kinds continue to be made. For example, this is evident in the simple measure of production continuing to rise despite rig counts remaining flat and having declined considerably since late 2022 (Figure 4.15).
Besides their ability to drill more wells with fewer rigs, a number of other improvements and developments are enabling producers to eke out more oil, while cutting costs. This includes the speed at which wells can be drilled, well lengths, laterals lengths, advances in fracking, refracking, consolidation and M&A that leads to advantageous, continuous acreage, as well as advances in digitalization, machine learning, AI and computing power. According to an industry source, "over the past six years, rig efficiency has increased by 65%, while completion efficiency has risen by 90% compared to 2018 levels" – and these trends are expected to continue into the 2030s.
Against this backdrop, there is much debate over the possible impact of the new US administration's declaration of a 'national energy emergency' on its first day in office and its efforts to stimulate domestic oil and gas production as part of its 'energy dominance' policy.
One key element of the new administration's plan is to expedite permitting, though the largescale opening-up of offshore acreage and lands in Alaska is essentially irrelevant for tight oil.

Figure 4.15 US oil rig count and crude production
Faster and greater access to federal lands onshore may be helpful, though 4Q2024 saw the highest number of permits given on federal land, notably in New Mexico, indicating that a lack of permitting may not per se have been holding back tight oil's growth.
In principle, however, cutting red tape should bring down costs – notably, for example, the new administration's decision to eliminate the planned methane fee should reduce breakeven levels. At the same time, it remains a matter of debate as to which price level or threshold will see producers commit to more drilling and hence, production. According to a recent muchquoted Kansas City Fed survey, producers considered an average (WTI) crude oil price of $84/b to be the average price that would trigger a substantial increase in drilling. Another survey, by the Dallas Fed in March 2025, reflected respondents' view that a WTI price of approximately $65 on average would be needed just to break even on a new well.
Tariffs on trade represent another key uncertainty. At the time of writing, it was too early to estimate the precise outcome of this multi-faceted and complex issue. However, the imposition of tariffs for some time – for example, on steel – could increase costs for the US domestic oil and gas industry, as could a wider resurgence in inflation.
Other non-crude liquids supply
NGLs provide an important driver of long-term non-DoC liquids supply growth, rising from 11.1 mb/d in 2024 to 13.4 mb/d in 2050. This means that their share in total non-DoC liquids rises from 21% to 23% by 2050. The US makes up the bulk of overall supply, with around a 60% share, and drives much of the supply increase in the medium term, although production flattens out in the 2030s. Other major contributors to growth are Qatar and Canada (Figure 4.16).
Biofuels and 'other liquids' also provide meaningful increments in non-DoC supply growth, at 2.1 mb/d and 2.6 mb/d, respectively, over the long term. Biofuels, including fuel ethanol and biodiesel, remain largely driven by mandates, with ongoing attempts to substitute fossil-based

Source: Baker Hughes, EIA.
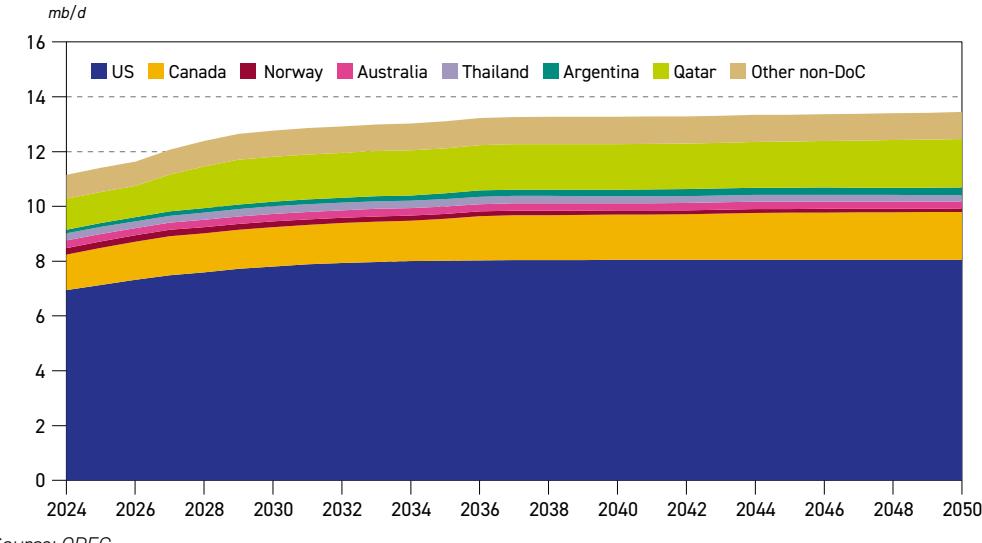
Figure 4.16 Non-DoC NGLs production outlook by country
Source: OPEC.
fuels with crop-, agricultural- or food-based waste. Fuel ethanol production is projected to expand from 2 mb/d to 3 mb/d between 2024 and 2050, dominated by the leading producers of Brazil and the US, albeit with output additions from other countries with a large agricultural base, and an incentive to diversify away from oil to some extent, such as India.
Biodiesel is expected to double from 1.2 mb/d in 2024 to 2.4 mb/d in 2050, driven by agricultural heavyweights such as Indonesia and some smaller countries in Europe focusing on waste recycling.
In terms of synthetic aviation fuel – non-biological-origin fuel made from hydrogen and CO2 – current production volumes are expected to increase to around 1 mb/d by 2050. The alternative aviation fuel is driven by mandates and the aviation sector's relative lack of alternatives to decarbonize, unlike the power, industrial and road transport sectors.
The synthetic aviation fuel made from non-biological origin is included in the 'other liquids' category rather than the biofuels category. Nonetheless, combined, total alternative, or 'sustainable' aviation fuel rises from around 10 tb/d in 2024 to 1.1 mb/d by 2050. Despite some ambitious mandates, much hype and impressive-sounding claims by airlines and aircraft producers, the reality is that both types of alternatives remain expensive to produce – with estimates averaging around three and 10 times higher than conventional fossil-based jet aviation fuel for biojet and synthetic fuels, respectively. Nonetheless, the EU and the UK, for example, have mandates in place that require the share of non-fossil-based aviation fuel consumed in their respective territories/airspaces to make up 10% by 2030, and 70% and 22%, respectively, by 2050.
To some extent, the situation remains something of a 'chicken and egg' situation. Airlines do not want to pay more for fuels (and charge customers more), but at the same time are being mandated to consume more of these barrels. Oil companies and other producers are at the same time reluctant to ramp up production in the absence of clear demand perspectives and some lingering uncertainty around mandates (for example, in the US).

For the other components of 'other liquids', the main driver remains Canadian oil sands, production of which is projected to grow slowly but steadily from 3.4 mb/d in 2024 to 5.1 mb/d in 2050. Meanwhile, volumes of GTLs and CTLs are projected to see virtually no growth, given the growing range of alternative fuels and technologies now available (Table 4.5).
| Long-term non-DoC biofuels and other liquids production outlook | ||||||||||
|---|---|---|---|---|---|---|---|---|---|---|
| 2024 | 2030 | 2035 | 2040 | 2045 | 2050 | Change 2024–2050 | ||||
| Fuel ethanol | 2.0 | 2.3 | 2.6 | 2.8 | 2.9 | 3.0 | 0.9 | |||
| Biodiesel | 1.2 | 1.5 | 1.8 | 2.1 | 2.2 | 2.4 | 1.2 | |||
| Global biofuels | 3.3 | 3.9 | 4.3 | 4.8 | 5.1 | 5.4 | 2.1 | |||
| Canadian oil sands | 3.4 | 3.6 | 3.8 | 4.1 | 4.5 | 5.1 | 1.7 | |||
| Gas-to-liquids (GTL) | 0.2 | 0.2 | 0.2 | 0.2 | 0.2 | 0.2 | 0.0 | |||
| Coal-to-liquids (CTL) | 0.2 | 0.3 | 0.3 | 0.3 | 0.3 | 0.3 | 0.1 | |||
| Synthetic aviation fuel | 0.0 | 0.1 | 0.3 | 0.5 | 0.7 | 1.0 | 1.0 | |||
| Other* | 0.4 | 0.4 | 0.3 | 0.3 | 0.3 | 0.3 | –0.1 | |||
| Total 'Other liquids' | 4.3 | 4.6 | 5.0 | 5.5 | 6.1 | 6.9 | 2.6 | |||
| Non-DoC total | 7.5 | 8.5 | 9.4 | 10.3 | 11.2 | 12.3 | 4.8 | |||
Table 4.5 Long-term non-DoC biofuels and other liquids production outlook
* Including kerogen, extra-heavy crude, MTBE and other refinery additives. Source: OPEC.
4.5 DoC liquids
Total DoC liquids supply, which averaged 49.1 mb/d in 2024, is set to rise by a substantial 5.5 mb/d over the medium term, increasing to 54.7 mb/d. Thereafter, while global oil demand is projected to keep expanding, non-DoC liquids supply growth will slow and ultimately plateau in the 2030s and beyond. As a result, the onus is on DoC liquids supply to keep expanding. Based on this Outlook's balances, DoC total liquids supply is set to rise further to 64.1 mb/d by 2050, or overall growth of 15 mb/d over the entire 2024–2050 period (Figure 4.17). This means that the DoC's share of global supply rises from 48% in 2024 to 52% in 2050.
Figure 4.17 DoC total liquids supply
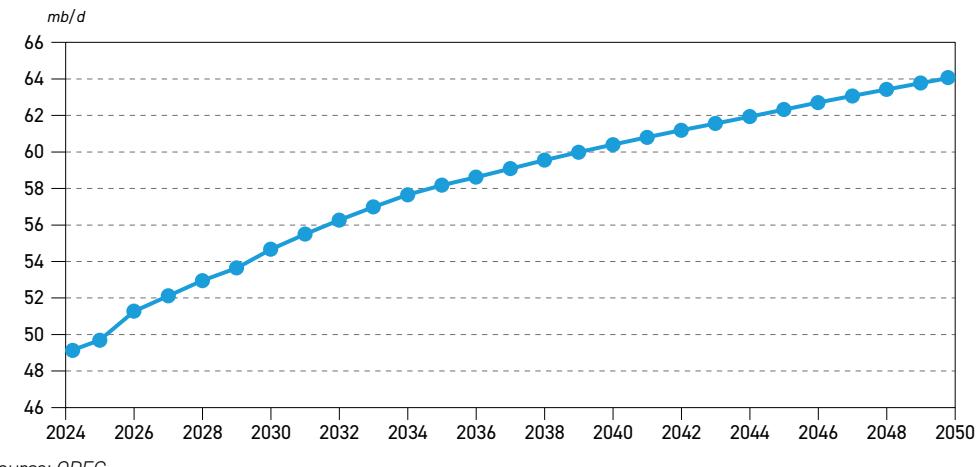
Source: OPEC.

4.6 Upstream investment requirements
Cumulative oil-related investment requirements to meet projected demand are assessed at $18.2 trillion (US$2025) over the period between 2025 and 2050. This is marginally higher than projected in the WOO 2024, as despite the outlook period being one year shorter, this Outlook has also seen long-term oil demand revised upwards, and liquids supply has followed. Total upstream investment requirements make up the bulk of the needed capital expenditure, now projected at $14.9 trillion, or $574 billion p.a. Downstream and midstream investment requirements are projected at $2 trillion and $1.3 trillion, respectively (Figure 4.18).
Figure 4.18
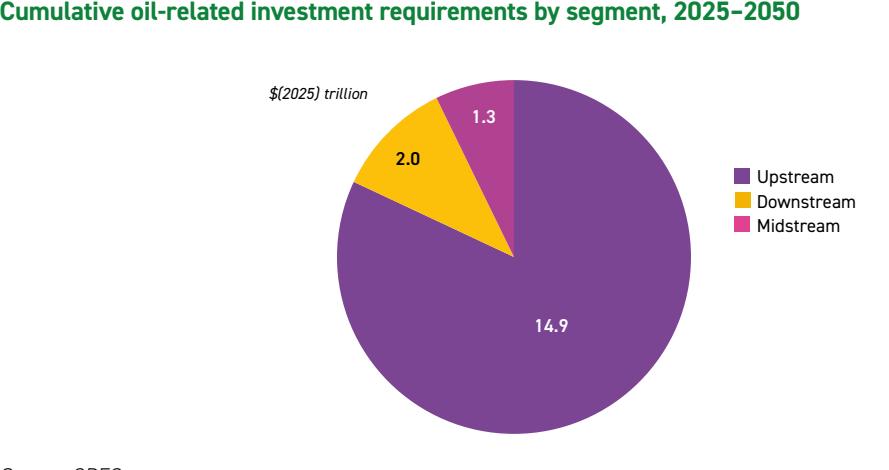
Source: OPEC.
Regionally, the bulk of upstream-related investment requirements are concentrated in the US & Canada, reflecting their relative size and significance in boosting liquids supply in the medium term and beyond (Figure 4.19). Even after the expected peak in US liquids


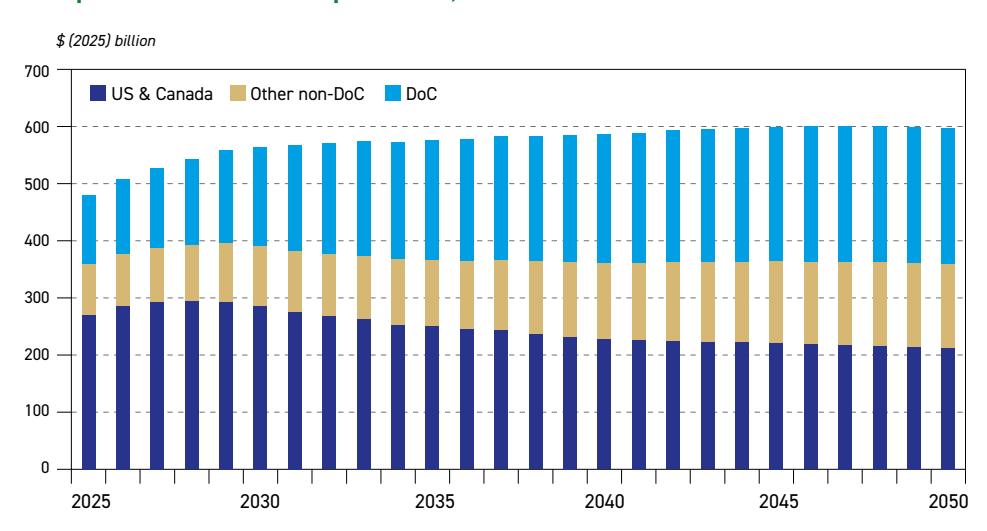
Source: OPEC.

supply in the early 2030s, according to this Outlook, its relative share of global liquids supply remains significant. In addition, US and Canadian barrels remain among the more expensive ones to develop. In absolute terms, the US & Canada are expected to need to invest just under $250 billion p.a. on average in order to generate the required liquids supply capacity.
Over time, however, after the US and non-DoC liquids supply peaks, and the onus on DoC producers to meet growing global oil demand intensifies, investment requirements in the DoC group also expand.
From a 25% share of global spending in 2025, the DoC's contribution rises to 40% by the end of the outlook period, increasing from $120 billion p.a. in 2025 to nearly $240 billion p.a. by 2050. Other non-DoC producers' share of spending requirements (outside of the US and Canada) are more modest in absolute terms, but still rise from $90 billion p.a. in 2025 to just under $150 billion p.a. by 2050, as their share in required capex rises from 19% to 25%.
Refining outlook
Key takeaways
- • The global refining system is projected to see the addition of around 5.8 mb/d of capacity in the medium term. The vast majority of new refining capacity additions are expected in developing countries in the Asia-Pacific (3.2 mb/d), the Middle East (1 mb/d) and Africa (1.2 mb/d). Only minor expansions are projected for other regions over the period to 2030.
- • In the long term (2025–2050), global required refining capacity additions are projected at 19.5 mb/d, including debottlenecking expansion. Almost 85% of capacity additions will materialize before 2040, which is in line with global oil demand trends.
- • Similar to medium-term trends, the majority of required long-term additions will be located in developing countries. The Asia-Pacific alone will account for almost 60% of capacity additions, followed by Africa (16%) and the Middle East (11%).
- • The global downstream market is likely to remain in balance in the first two years of the medium term, driven by the significant capacity additions set to come online. From 2027 to 2030, the downstream market may get tighter relative to 2024. The deficit between required and potential refining capacity is set to steadily rise from almost 0.5 mb/d in 2027 to 1.6 mb/d by 2030. This is due to strong oil demand growth, which is significantly higher compared to refining capacity additions in the same period, especially in the Asia-Pacific.
- • Global refinery utilization rates are expected to rise from around 80.4% in 2024 to 83.3% in 2030, supported by rising oil demand and expected medium-term refinery closures.
- • Long-term refinery throughputs are expected to increase from 82.4 mb/d in 2024 to 89.6 mb/d in 2030. Growth will be somewhat slower thereafter, with global refinery runs climbing to 94.7 mb/d in 2040 and almost 96 mb/d in 2050. Global runs are a combination of regional trends, with the US & Canada, Europe, and developed countries in the Asia-Pacific seeing declines, which are more than offset by strong increases in all developing regions, including the Asia-Pacific, Africa, Latin America and the Middle East.
- • Just above 1 mb/d of refining capacity could be closed during the medium term. Beyond 2030, further closures of up to 4 mb/d will be required globally – mostly in developed regions – if refinery utilization rates are to be kept at sustainable levels.
- • Secondary capacity additions over the outlook period are significant, with 20.4 mb/d of desulphurization, 11.2 mb/d of conversion capacities and 6.3 mb/d of octane units.
- • Total required downstream sector investments are projected at almost $2 trillion. More than $600 billion will be required for refinery capacity expansions, while the remainder will be needed for continuous maintenance and the replacement of existing capacity throughout the outlook period.
5
This chapter presents the downstream oil outlook for the period 2024–2050. It is fully consistent with the Reference Case assumptions, including projections on oil demand (Chapter 3) and liquids supply (Chapter 4). It examines various market drivers and factors that may influence the future global refining sector, highlighting challenges, uncertainties and opportunities. Similar to chapters 3 and 4, the analysis is conducted in two different time frames, namely the medium term (2024–2030) and long term (2030–2050).
This chapter initially focuses on recent developments in the downstream sector. This is followed by an updated assessment of the current 'base' capacity by major region that is the basis for all medium- and long-term projections. It is important to note that these projections are conducted according to two different methodologies.
Firstly, in the medium term, refining capacity additions are assessed based on a thorough review of refinery projects and their progress by major downstream region. Based on this, the medium-term global and regional outlook for both primary and secondary capacity is produced. Secondly, based on global and regional oil demand and supply trends, long-term refining capacity additions (i.e. requirements for additions) are projected.
Moreover, the analysis in this chapter shows how the downstream market balance is anticipated to evolve in the medium and long term. This provides insights into regional market balances and respective utilization rates.
There are also discussions and forecasts for recent and near-term refinery closures. In the medium term, projections are based on announcements (firm closures) and an assessment of potential closures by 2030. Beyond 2030, the Reference Case makes no explicit forecasts on closures. However, it does provide an indication of required refinery closures based on market balances and projected utilization rates.
Additionally, this chapter examines medium- and long-term secondary capacity additions. This includes projections for fluid catalytic cracking (FCC), coking and hydrocracking, desulphurization capacity and octane units. Based on these secondary capacity additions, and the projected demand by product, the potential medium-term market balance is highlighted.
Finally, this chapter provides an outlook for global and regional investment requirements related to medium- and long-term capacity additions to the year 2050, as well as investments for continuous maintenance and replacement.
5.1 Existing refinery capacity
Recent developments in the downstream sector
After a strong performance in 2022 and 2023, the downstream sector stabilized during 2024. It nevertheless remained strong, with refinery margins still above pre-pandemic levels in most regions. The market was supported by continuous oil demand growth, a relatively slow ramp-up of new refining capacities in several developing countries, recent refinery closures, as well as geopolitics. In 2024, refining capacity of 330 tb/d was put out of service, mostly in Europe and Japan. However, these closures were more than offset by refining capacity additions of around 1 mb/d in the Middle East, Asia-Pacific and Africa in the same year. Global refinery throughput increased by almost 0.6 mb/d in 2024, mostly in the Middle East but also

in Africa and Latin America, mainly linked to the start-up of new refining capacities in these regions. The global downstream market is likely to remain fairly balanced in the short term, with new refining capacity additions being broadly in line with expected demand growth. In the longer term, demand will continue increasing, which will require additional capacity expansion, especially in developing regions. Another challenge for the refining sector is linked to the evolving composition of refined product demand. This requires transformative processes within the sector, reflected in yield adjustments and related secondary capacity investments.
The global refining sector is a large system, which – despite its size – has already managed to undergo a gradual transformation over time. The evolving product demand mix, the growing diversity of crude oil feedstocks, as well as environmental considerations and related regulations have forced refineries to modify their configurations and adjust their strategies. Today, new refinery projects are mostly highly complex facilities that are capable of processing various types of crude and producing high quality products. In addition, they are often integrated plants, which include petrochemical facilities. A good indicator of the transformation undergone to date can be seen in the refinery complexity level, which is expressed in the ratio between secondary capacity and atmospheric distillation capacity.
Figure 5.1 presents the evolution of global secondary capacity in relation to distillation capacity by major categories between 2015 and 2024. Over the last decade, the ratio of upgrading/ conversion, octane units and desulphurization capacities relative to distillation capacity has
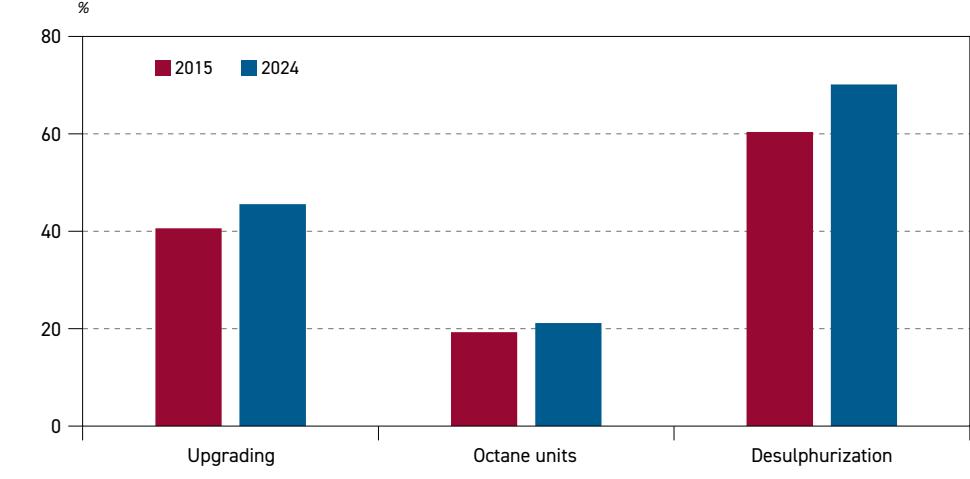
Figure 5.1 Secondary capacity relative to distillation capacity by major categories, 2015 and 2024
Source: OPEC.
increased. These improvements were underpinned by several factors. Firstly, they were supported by the addition of modern, state-of-the-art refineries in developing regions, mostly in the Middle East and Asia-Pacific. Secondly, they were supported by the modernization and upgrading of existing plants in developed and developing regions, aimed at improving refinery yields. Finally, closures of old and simple refineries have also contributed to improving ratios

of secondary capacities since 2015. The latter was especially the case for developed regions, including Europe, the US, and developed countries in the Asia-Pacific, which saw a large number of closures since 2020.
The global ratio of upgrading capacity relative to distillation capacity increased from 41% in 2015 to 46% in 2024. This shift was driven mostly by growth in FCC and hydrocracking capacities. These two efficient processes can convert heavier fractions into lighter and more valuable products, including diesel and gasoline. The ability to produce high-octane gasoline and light olefins like propylene from FCC, as well as high-quality naphtha from hydrocracking to feed petrochemical industries, is another supportive factor – given the increasing demand for petrochemicals. In addition, integrating these processes within refineries enhances operational flexibility and economic efficiency. From a regional perspective, the growth in FCC capacity primarily came from China and Other Asia-Pacific, and to a lesser extent from the Middle East and Russia & Caspian. Expansion in hydrocracking capacity was driven mostly by China, Russia & Caspian and the US & Canada.
The ratio of octane unit capacity to distillation capacity increased from 19% in 2015 to 21% in 2024. This increase was particularly driven by new investments in catalytic reforming. This technology not only provides a high-octane number stream for the gasoline pool, it is also a key component in the production of aromatics such as benzene and paraxylene. The growth was driven almost exclusively by China, Other Asia-Pacific and the Middle East between 2015 and 2024. For instance, the octane unit to distillation capacity ratio in China increased from 11% in 2015 to 18% in 2024, driven by strong growth in demand for gasoline and petrochemical feedstocks.
Finally, desulphurization capacity growth was driven by stringent regulations on sulphur content, particularly for diesel and gasoline. This includes national regulations related to sulphur content in road transportation fuels, as well as supranational regulatory frameworks such as the IMO cap on sulphur content in bunker fuels. The latter was imposed by the IMO in 2020 and has pushed refiners to invest heavily in heavy oil and residual fuel desulphurization. Consequently, the ratio of desulphurization relative to distillation capacity increased from 60% in 2015 to 70% in 2024. This increase was visible in all regions, particularly in China and the Middle East, which saw increases of 18 pp and 15 pp between 2015 and 2024, respectively.
This transformation process will continue in the future as well. The largest share of oil demand growth is related to high quality products, including petrochemical feedstocks, as well as Ultra-Low Sulphur (ULS) transportation fuels. At the same time, the average crude barrel is likely to become heavier and contain a higher sulphur content. This is why the complexity levels of refining capacity additions are set to be significantly higher than current levels, and will also help increase average ratios between secondary and primary capacity – especially in developing countries – where most of the new capacity will be located.
Base refinery capacity
This section provides a detailed update on base capacity assessments – distillation and secondary capacity, including condensate splitters – of refineries worldwide. It includes additions and expansions to existing refineries, new refineries that have come on stream, as well as closures that occurred in 2024.
Refineries, unless officially closed, are included in the database of 'nameplate' capacity, although effective capacity may be identified as being well below the nameplate level. Overall, it should be noted that no single data source for global and regional refinery capacities can be relied upon entirely. The quality and availability of capacity reporting varies by refinery, so there is always an element of determining a 'best estimate' for base capacity. This applies to primary capacity, secondary capacity, as well as new projects and closures.
Table 5.1 provides details on global base refining capacity by major downstream region, as well as refining process. The total distillation capacity was assessed at 102.5 mb/d as of January 2025. This includes capacity additions and closures that occurred in 2024, as well as any necessary adjustments to the refining database. Around 1 mb/d of new refining capacity came online in 2024. This was due to the start-up of new refineries, as well as some capacity expansions. The non-OECD region accounts for more than 80% of these additions, including the commissioning of the first phase of the Dangote refinery in Nigeria and the Yulong refinery in China, as well as the expansion of the Visakhapatnam refinery in India.
| Other | |||||||||
|---|---|---|---|---|---|---|---|---|---|
| US & | Latin | Russia & | Middle | Asia | |||||
| Canada | America | Africa | Europe | Caspian | East | China | Pacific | World | |
| Distillation | |||||||||
| Crude oil (atmospheric) | 19.6 | 8.0 | 3.9 | 14.8 | 7.9 | 11.5 | 17.8 | 18.9 | 102.5 |
| Vacuum | 9.3 | 3.5 | 1.0 | 6.3 | 3.2 | 3.3 | 7.6 | 5.8 | 39.9 |
| Upgrading | |||||||||
| Coking | 3.0 | 0.9 | 0.1 | 0.8 | 0.6 | 0.5 | 2.4 | 1.1 | 9.4 |
| Catalytic cracking | 6.0 | 1.6 | 0.3 | 2.2 | 0.9 | 1.1 | 4.5 | 3.5 | 20.1 |
| Hydro cracking | 2.6 | 0.2 | 0.3 | 2.4 | 0.9 | 1.2 | 2.6 | 1.8 | 11.9 |
| Visbreaking | 0.1 | 0.4 | 0.1 | 1.4 | 0.7 | 0.6 | 0.2 | 0.6 | 4.0 |
| Solvent deasphalting | 0.5 | 0.1 | 0.0 | 0.2 | 0.0 | 0.2 | 0.1 | 0.2 | 1.3 |
| Octane units | |||||||||
| Reforming | 4.0 | 0.7 | 0.5 | 2.4 | 0.8 | 1.4 | 2.4 | 2.9 | 15.2 |
| Isomerization | 0.8 | 0.2 | 0.1 | 0.6 | 0.3 | 0.5 | 0.2 | 0.4 | 3.1 |
| Alkylation | 1.4 | 0.2 | 0.0 | 0.2 | 0.1 | 0.1 | 0.2 | 0.4 | 2.7 |
| Polymerization | 0.1 | 0.0 | 0.0 | 0.1 | 0.0 | 0.0 | 0.0 | 0.0 | 0.1 |
| MTBE/ETBE | 0.0 | 0.0 | 0.0 | 0.1 | 0.0 | 0.0 | 0.3 | 0.1 | 0.6 |
| Desulphurization | |||||||||
| Naphtha | 5.1 | 0.9 | 0.6 | 2.9 | 1.0 | 2.1 | 2.5 | 3.0 | 18.0 |
| Gasoline | 3.2 | 0.5 | 0.1 | 0.7 | 0.3 | 0.4 | 1.6 | 1.4 | 8.2 |
| Middle distillates | 7.4 | 2.6 | 0.8 | 5.7 | 2.5 | 3.7 | 4.9 | 6.8 | 34.4 |
| Heavy oil/Residual fuel | 3.5 | 0.4 | 0.0 | 1.8 | 0.4 | 0.9 | 1.2 | 3.1 | 11.2 |
| Sulphur (short tons/day) | 44,276 | 7,877 | 3,994 | 20,091 | 8,701 | 16,787 | 24,536 | 39,687 | 165,950 |
| Hydrogen (million scf/d) | 6,263 | 1,266 | 442 | 5,047 | 2,182 | 3,670 | 7,039 | 6,643 | 32,551 |
Table 5.1 Global base refining capacity as of January 2025
Source: OPEC.
mb/d
5
Furthermore, some smaller additions were recorded in Iraq, Angola, and Ghana. Finally, the first phase of the Dos Bocas refinery in Mexico – the only major addition in the OECD region – was also commissioned.
When it comes to refinery capacity closures, capacities that were taken offline during 2024 are estimated at about 0.33 mb/d. These closures include the Yamaguchi refinery in Japan, Eni's refinery in Livorno (Italy), and a part of the Dalian refinery in China. Of note, this was well below the average annual closures of around 1.2 mb/d that occurred between 2020 and 2023, underlining that the wave of refinery shutdowns triggered by the COVID-19 pandemic has come to an end.
Secondary capacity
Refining capacity additions are not limited to primary distillation capacity (i.e. distillation capacity); they also often include various secondary processing units. Recent refinery capacity additions and new refinery projects projected to come online in the medium term are increasingly complex, including significant secondary capacity. This is driven by the growing demand for high-quality clean products, aligned with stricter fuel quality regulations. Furthermore, this also reflects increasing competition in the downstream sector, which is why refiners have been investing in increasing the complexity of their respective plants. For example, new refineries are increasingly designed to maximize petrochemical feedstocks, and an increasing number of existing refineries are directing their production towards the output of these materials.
Figure 5.2 depicts existing secondary capacity in relation to distillation capacity as of January 2025. It highlights the complexity level of the refining sector at the global level and the variation between major regions. At the global level, vacuum distillation capacity averaged 39% of crude (atmospheric) distillation capacity, while upgrading capacity stood at around 46%, gasoline octane units at 21% and desulphurization at 70%. There is a steady increase in
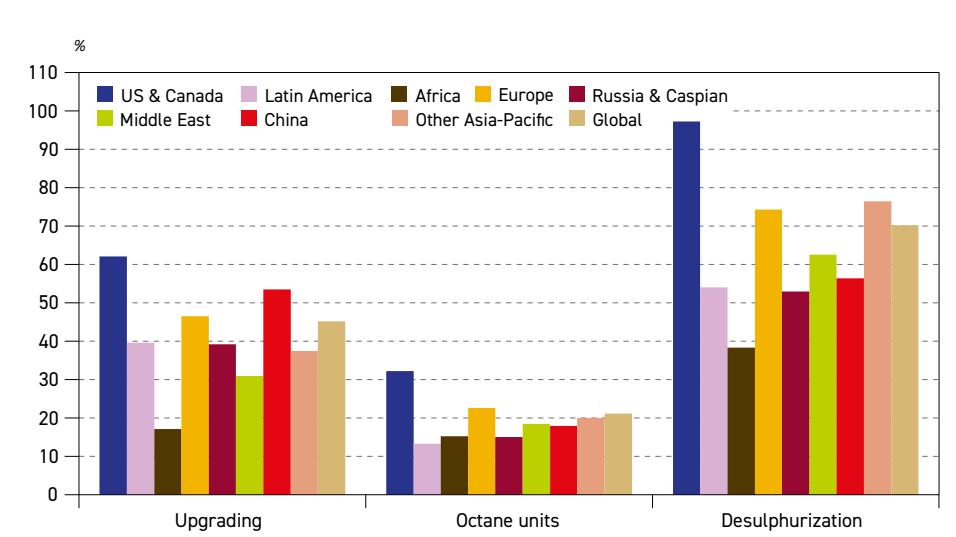
Figure 5.2 Secondary capacity relative to distillation capacity, January 2025

Source: OPEC.
the complexity of the global refining system, which is reflected in the year-over-year increase in the proportion of secondary capacity relative to primary distillation capacity.
At the regional level, the US & Canada continues to lead in terms of refining system complexity. This is especially the case with regard to upgrading capacity, gasoline octane units, and desulphurization capacities. The US, in particular, has developed one of the most advanced refining systems globally, continually enhanced over the decades, driven in part by the increasing availability of heavy crudes from Latin America and Canada.
However, in recent years, several other regions have been approaching the complexity levels seen in the US & Canada. New large refining additions, often including integrated petrochemical facilities, have emerged in the Middle East, China and Other Asia-Pacific (including India). Some of these projects are state-of-the-art refineries that have helped to increase the ratio of secondary to distillation capacity in these regions, significantly narrowing the gap with US & Canada levels.
In terms of the upgrading-to-distillation ratio, the US & Canada shows by far the highest level at 62%. China follows with 55%, reflecting the continued modernization of its refinery fleet. The ratio in Europe is also high, reaching almost 47%. Other regions have significantly lower upgrading ratios, however, with Latin America, Russia & Caspian, Other Asia-Pacific and the Middle East in the 30–40% range. Although improving in recent years, the upgradingto-distillation ratio in Africa still lags behind other regions and was assessed at around 17%.
In more detail, an analysis of the structure of the global refining capacities reveals distinct regional preferences and technological deployments. Figure 5.3 shows upgrading capacity by technology relative to total upgrading capacity as of January 2025. For instance, catalytic cracking remains the most widespread upgrading technology worldwide, representing around 43% of global upgrading capacity. This dominance is due to its flexibility and efficiency in converting heavy fractions into high-value light products, such as gasoline and diesel.
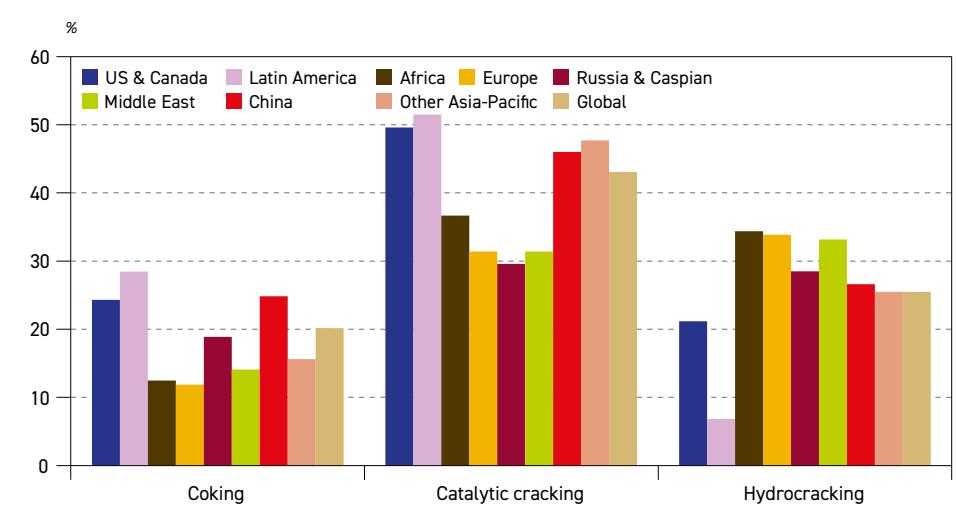
Figure 5.3 Upgrading capacity by technology relative to total upgrading capacity, January 2025
Source: OPEC.
World Oil Outlook 2025 Organization of the Petroleum Exporting Countries
5
189
Regionally, Latin America, the US & Canada, and Other Asia-Pacific each have about 50% of their respective upgrading capacity devoted to this technology, followed by China with 46%. Except for Africa, with a 37% ratio of catalytic cracking to the region's upgrading capacity, the remaining regions stand at a level of around 30%. This distribution also reflects historical investment choices and the specificities of locally available crudes.
The situation is different for hydrocracking, which is the second most widely used technology. As of January 2025, hydrocracking accounted for around 25% of the global upgrading capacity. Hydrocracking is a sophisticated technology used to produce clean fuels from heavier and high-sulphur crudes. In Africa, the share of hydrocracking capacity is highest at 34%, which is partly due to recent additions in Nigeria and overall low levels of upgrading capacity on this continent. Europe and the Middle East have the highest shares of hydrocracking in their upgrading capacity, standing at around 33%. These figures are linked to strict fuel quality regulations in Europe, as well as massive investments in the Middle East to modernize and diversify their refineries, particularly to target export markets requiring ultra-low sulphur fuels. Other regions, such as Russia & Caspian, China, Other Asia-Pacific and the US & Canada, are between 21% and 28%. Latin America lags behind, accounting for just 7%. This is due to the region's crude oil characteristics, which are less suitable for hydrocracking, combined with less developed infrastructure and lower demand for this type of refined product.
When it comes to coking, however, Latin America has the highest levels in the upgrading mix, standing at 28%. The share of coking is also high in China, standing at 25%, and the US & Canada, standing at 24%. The relatively high share in these three regions is attributed to the relatively high availability of extra heavy crude. Together, these regions account for around 67% of global coking capacity.
For octane units, the US & Canada stands out, having a ratio of more than 32% relative to the distillation capacity. This mirrors the region's exceptionally high gasoline demand. In Europe, the ratio of octane units relative to distillation capacity is somewhat high at around 23%, which is linked to the presence of installed gasoline production capacities that existed before the dieselization of the car fleet. The ratio of octane units to distillation capacity in the Middle East, China and Other Asia-Pacific is in the range of 18% to 20%. Latin America, Russia & Caspian and Africa have lower ratios, lying between 14% and 16%. From a technological perspective, reforming is by far the most common technology used for gasoline production, accounting for around 70% of total octane unit capacity, followed by isomerization (14%) and alkylation (12%).
For desulphurization capacity and associated sulphur recovery, levels vary considerably by region and largely depend on fuel standards and the quality of processed crudes. The US & Canada has by far the highest ratio of desulphurization relative to distillation capacity, at around 97%. This reflects very stringent environmental regulations, as well as an ability to process large quantities of heavy and medium-sour crudes from Latin America, the Middle East, and domestic Canadian barrels.
Other Asia Pacific and Europe follow with ratios of 76% and 75%, respectively. In Other Asia, countries like Japan and South Korea – but also increasingly India – have invested heavily in desulphurization to meet fuel standards. A similar situation exists in Europe, where the high level of desulphurization capacity is attributed to stringent requirements for ULS fuels. The Middle East has a ratio of 62%, which has increased in recent years, mirroring continued infrastructure upgrades in several countries. Regions such as China, Latin America and

Russia & Caspian have levels between 53% and 57%, while Africa stands at just 37%. The low desulphurization-to-distillation capacity ratio in Africa is partly due to the large use of sweet crudes, which require less desulphurization, and a general delay in adopting more stringent low-sulphur fuel standards.
Finally, it is worth noting that regions with the highest levels of desulphurization relative to their distillation capacity also have the highest levels of sulphur recovery and hydrogen production capacities.
5.2 Distillation capacity outlook
This section investigates refining capacity additions in the medium and long term, following two different approaches. In the medium term (2024–2030), the refining capacity outlook is based on existing projects that are likely to be commissioned during this period. The longterm outlook is constructed based on long-term demand and supply trends and represents the generic capacity required through to 2050.
5.2.1 Medium-term distillation capacity additions
This section reviews the medium-term development of the downstream sector. It is based on a comprehensive review of refining projects, including their respective status and progress. This includes new projects (greenfield refineries) and the expansion of existing units, covering both distillation and secondary capacities. These expansions are examined and profiled according to their likelihood of being implemented and commissioned within the mediumterm period to 2030. It should be noted that these projections do not include continuous, small and under-the-radar additions, so-called 'creep' capacity, which refers to the natural increase in capacity at existing facilities that requires little or no capital expenditure.
Based on this methodology, the medium-term outlook sees around 5.8 mb/d of new refining capacity coming online. This figure is somewhat lower than the WOO 2024, partly due to the significant refining capacity already commissioned in 2023 and 2024. Furthermore, the progress of several large projects remains unclear at the moment, and their potential start-up dates have been pushed to beyond 2030, which is why they are not included in the current medium-term analysis.
Annual global distillation capacity additions and the estimated investment costs related to new refining projects for the period 2019–2030 are presented in Figure 5.4. The global annual average rate of capacity additions for the period 2024–2030 is estimated at just below 1 mb/d. Capacity additions in 2025 are seen at around 1.3 mb/d, including many large and medium-capacity refineries, some of which were partly commissioned in 2024, with full commissioning expected during 2025. In the period 2026–2028, a relatively stable annual addition rate of around 0.85 mb/d is projected. In 2029, additions are expected to recover to just over 1 mb/d, before dropping to 0.9 mb/d in the final year of the medium-term horizon.
Table 5.2 and Figure 5.5 show projected medium-term projections for refinery additions by region. Similar to previous outlooks, over 90% of medium-term capacity additions are projected to occur in developing regions, mainly in developing countries in the Asia-Pacific, Africa and the Middle East. This once again confirms the historical trend of refining capacity migrating from developed to developing countries. It is also in line with strong oil demand growth in these regions, as well as efforts by some countries to reduce product imports.

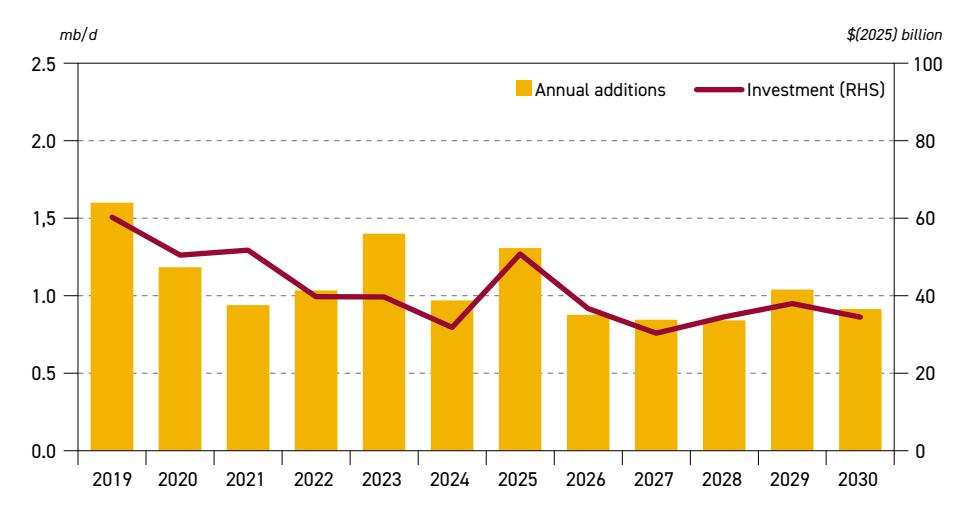
Figure 5.4 Annual distillation capacity additions and total project investment
Source: OPEC.
| Table 5.2 | |
|---|---|
| Distillation capacity additions from existing projects by region, 2025–2030 | mb/d |
| US & Canada | Latin America | Africa | Europe | Russia & Caspian | Middle East | China | Other Asia Pacific | World | |
|---|---|---|---|---|---|---|---|---|---|
| 2025 | 0.0 | 0.2 | 0.3 | 0.0 | 0.0 | 0.2 | 0.4 | 0.2 | 1.3 |
| 2026 | 0.0 | 0.0 | 0.1 | 0.0 | 0.0 | 0.1 | 0.1 | 0.6 | 0.9 |
| 2027 | 0.0 | 0.0 | 0.2 | 0.0 | 0.0 | 0.2 | 0.3 | 0.2 | 0.8 |
| 2028 | 0.0 | 0.0 | 0.3 | 0.0 | 0.0 | 0.2 | 0.1 | 0.3 | 0.8 |
| 2029 | 0.0 | 0.0 | 0.2 | 0.0 | 0.0 | 0.3 | 0.1 | 0.4 | 1.0 |
| 2030 | 0.0 | 0.0 | 0.1 | 0.0 | 0.0 | 0.2 | 0.1 | 0.5 | 0.9 |
| 2025–2030 | 0.1 | 0.2 | 1.2 | 0.0 | 0.1 | 1.0 | 1.0 | 2.2 | 5.8 |
| Share (%) | 1.5 | 3.4 | 20.5 | 0.8 | 1.6 | 17.2 | 17.7 | 37.4 | 100.0 |
Source: OPEC.
Finally, product export strategies adopted by certain countries are also driving the capacity expansion.
In more detail, capacity additions of 5.4 mb/d are expected to come online in the Asia-Pacific, Africa and the Middle East, representing over 92% of the medium-term projected capacity additions of 5.8 mb/d. These projections also include several large-scale, state-of-the-art projects, some of which are integrated with petrochemical facilities.

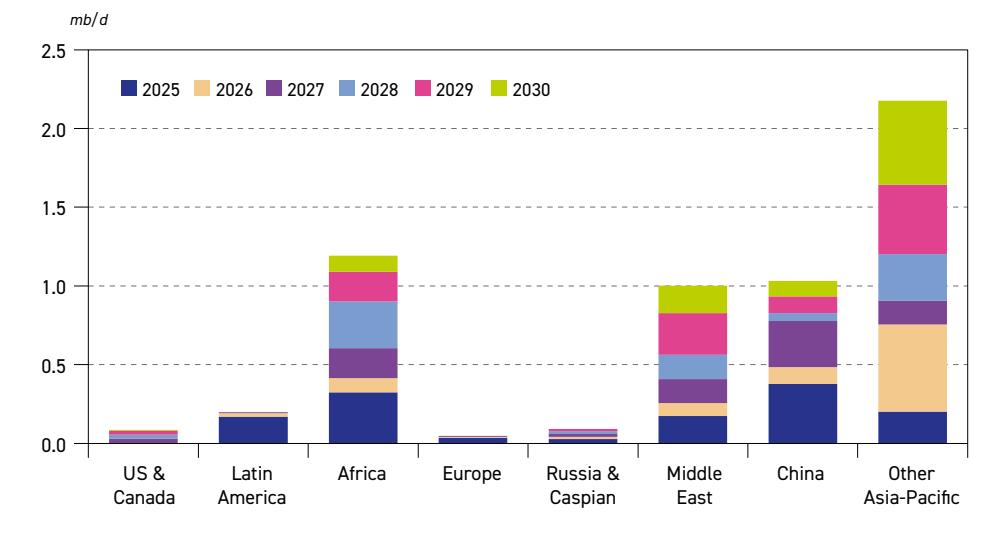
Figure 5.5 Distillation capacity additions from existing projects, 2025–2030
Source: OPEC.
The largest additions are expected in Other Asia-Pacific, with around 2.2 mb/d in the mediumterm, i.e. more than one-third of global additions. This reflects strong oil demand growth in this region throughout the outlook period. More than half of this new capacity is expected to come online in India alone.
India is actively enhancing its oil refining capacity to meet growing domestic demand and enhance its oil products export potential in the coming years. Furthermore, its decision to boost investment in the sector comes as refiners proactively expand into petrochemical ventures as part of broader strategies to adapt to changing market dynamics, enhance competitiveness and position themselves for sustained growth. All major refiners have plans to expand their capacities. Indian Oil Corporation (IOC) is expanding its Panipat, Gujarat, and Barauni refineries, targeting completion in the coming years. These projects aim to boost capacity and integrate petrochemical production to meet rising energy demands. Bharat Petroleum Corporation Limited (BPCL) plans to increase its overall refining capacity to 900 tb/d in the next five years. It aims to raise the capacity of the Kochi refinery in south India to 360 tb/d from its current 310 tb/d. Elsewhere, the new capacity of the Mumbai refinery is expected to increase to 320 tb/d, up from 240 tb/d currently, while the capacity of the Bina refinery is expected to increase by around 70 tb/d. In addition, BPCL aims to develop new petrochemical projects at its Kochi and Bina refineries by 2027 and 2028, respectively. Expansions of existing plants and investments in greenfield projects are also part of the strategies pursued by other companies, such as Hindustan Petroleum Corporation Limited (HPCL) and potentially Nayara Energy.
Further refining capacity expansions in Other Asia-Pacific are also expected in countries like Indonesia, Pakistan, Thailand and Bangladesh. Indonesia is aiming to increase its refining capacity and reduce dependence on imported fuels. A key project is the greenfield project in Tuban, with a planned processing capacity of 300 tb/d. Other important capacity additions include the expansion of the Balikpapan refinery, which is set to increase its crude distillation

capacity by 100 tb/d by 2025. This project is being developed by Pertamina. In Pakistan, Saudi Aramco is helping to develop a 250 tb/d refinery with a potential start-up in 2028. In Bangladesh, the 150 tb/d Payra project could be commissioned in 2028. Singapore, Thailand and some other countries in the region could also see minor refining capacity additions in the medium term.
In China, total capacity additions are estimated at around 1 mb/d over the medium term. The first 200 tb/d of the two crude units at the Yulong plant were commissioned in late 2024, with the second unit likely to start operation in 2025. In addition, Yulong refinery could also see further expansion as part of a second phase, potentially adding another 400 tb/d towards the end of the medium-term period. In addition, Saudi Aramco and Panjin Xincheng Industrial Group are developing a 300 tb/d project in Panjin, with construction beginning in late 2023. Moreover, Sinopec has two projects under development in Ningbo City and Hainan. However, it remains uncertain whether all of these projects will be delivered on schedule.
China's National Development and Reform Commission (NDRC) has announced a cap on the country's crude oil refining capacity at 20 mb/d by 2025. This is intended to modernize its oil processing sector and align it with evolving domestic demand and environmental objectives. According to the NDRC, every new refinery will have to have a capacity of at least 200 tb/d. Smaller, non-conforming refineries (40 tb/d or less) will likely be closed.
In Africa, medium-term capacity additions are expected to reach around 1.2 mb/d, driven by a mix of large, medium and small-scale projects expected to come online. Nigeria will play a key role in the development of the region's downstream sector. Following its start-up in 2024, the Dangote refinery in Lagos is anticipated to reach full operational capacity in the first half of this year. Additionally, the 200 tb/d Akwa Ibom refinery is set to contribute to the region's refining capacity. Angola is also witnessing significant developments, with the 100 tb/d Soyo refinery and the 200 tb/d Lobito plant scheduled to commence operations by 2027 and 2028, respectively. The Ugandan government has signed an implementation agreement with UAEbased Alpha MBM Investments to design, build and operate a 60 tb/d greenfield refinery in Hoima. In addition, several smaller modular refineries are in the pipeline across multiple countries, including Nigeria, the Republic of Congo, Ghana, and Guinea, some of which have capacities of less than 20 tb/d. In North Africa, new refining projects are underway in Algeria (Hassi Messaoud), Libya (Ubari), and Egypt (Soukhna).
In the Middle East, total medium-term refinery additions are projected at around 1 mb/d. Following the recent commissioning of large new projects, such as Al-Zour in Kuwait and Duqm in Oman, the region is set to see the start-up of several medium-sized projects currently under construction. These are mostly located in IR Iran, Iraq and Bahrain. Some minor expansions are also possible in Oman, the UAE, Saudi Arabia and Jordan.
In Latin America, total additions account for around 200 tb/d, with only two projects considered in the medium term – both located in Mexico. These include the second phase of the Dos Bocas refinery, which is likely to reach full commercial operations in 2025, and the expansion of the Hidalgo refinery by 30 tb/d.
In the US & Canada, around 100 tb/d of distillation capacity is expected to be added in the medium term, with two potential projects being developed by Meridian Energy Group Inc, the first in Belfield of 50 tb/d and the second in Texas of 60 tb/d. In Russia & Caspian, minor expansions are expected in Azerbaijan, Georgia and Turkmenistan. Finally, expansion of 50 tb/d is projected in Europe, mirroring two small projects in Turkey.

The medium-term outlook for new refining capacity is based on a large list of announced refinery projects with a combined capacity of over 20 mb/d. However, only a portion of these projects is expected to materialize within the medium-term horizon. The total projected capacity additions of 5.8 mb/d over the medium term correspond to projects at different stages of development. Of these, approximately 3.3 mb/d of capacity is either already under construction or approaching the construction phase, representing the projects with the highest likelihood of being realized within the medium-term time frame.
Beyond this, there are additional projects amounting to around 2.5 mb/d, most of which remain in the early stages of development. However, these projects have advanced sufficiently in terms of planning, financing, and engineering to be classified as 'firm' medium-term additions in the Reference Case. Despite this, a considerable degree of uncertainty remains regarding these projects, as they may face delays extending beyond the medium term or cancellation due to various factors.
5.2.2 Long-term distillation capacity additions
This section focuses on long-term refining capacity additions in the period 2025–2050 and is aligned with the underlying Reference Case assumptions related to oil demand and supply. The long-term projections also take into account medium-term refinery capacity additions and announced refinery closures.
Table 5.3 and Figure 5.6 relate to distillation capacity additions in the medium and long term. They include assessed refinery projects in the medium-term period to 2030 and generic projects thereafter. As already noted, medium-term additions are estimated at 5.8 mb/d (and 6.2 mb/d including estimated creep capacity expansion), while in the long term an additional
Table 5.3 Refinery distillation capacity additions by period
| Distillation capacity additions starting 2024 | ||||||||||
|---|---|---|---|---|---|---|---|---|---|---|
| Assessed projects* | New units | Total | Annualized | |||||||
| 2025–2030 | 5.8 | 0.4 | 6.2 | 1.0 | ||||||
| 2030–2035 | 0.0 | 7.3 | 7.3 | 1.5 | ||||||
| 2035–2040 | 0.0 | 2.9 | 2.9 | 0.6 | ||||||
| 2040–2045 | 0.0 | 1.9 | 1.9 | 0.4 | ||||||
| 2045–2050 | 0.0 | 1.2 | 1.2 | 0.2 | ||||||
| Cumulative distillation capacity additions | ||||||||||
| Assessed projects* | New units | Total | Annualized | |
|---|---|---|---|---|
| 2025–2030 | 5.8 | 0.4 | 6.2 | 1.0 |
| 2025–2035 | 5.8 | 7.6 | 13.5 | 1.2 |
| 2025–2040 | 5.8 | 10.6 | 16.4 | 1.0 |
| 2025–2045 | 5.8 | 12.4 | 18.3 | 0.9 |
| 2025–2050 | 5.8 | 13.7 | 19.5 | 0.8 |
* Firm projects exclude additions resulting from capacity creep. Source: OPEC.

mb/d
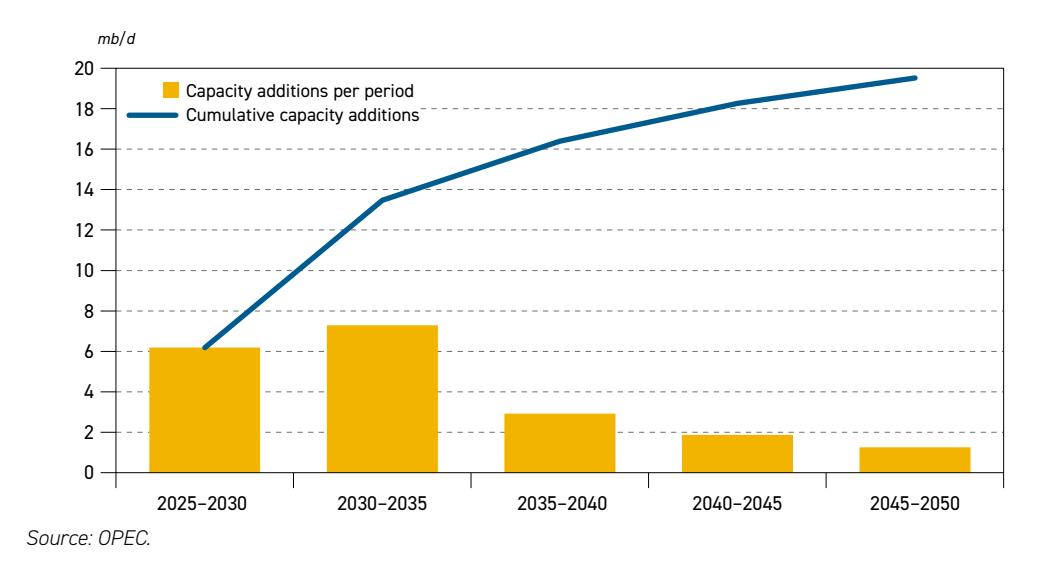
Figure 5.6 Distillation capacity additions per period and cumulative, 2025–2050
13.3 mb/d of distillation capacity is required. It is important to emphasize that projected additions beyond 2030 are not linked to any specific refinery projects. Instead, they are projected as generic capacities required to meet long-term demand for refined products in all regions. In total, distillation capacity additions between 2025 and 2050 are projected at 19.5 mb/d at the global level. These additions will more than offset potential refinery closures in developed regions due to an expected decline in oil demand in the long term.
After the addition of around 6.2 mb/d (including creep capacity) between 2025 and 2030, refining capacity is set to increase by a further 7.3 mb/d between 2030 and 2035, which is supported by rising demand in most developing regions. The rate of additions drops significantly thereafter and is estimated at around 3 mb/d in the 2035–2040 period and 1.2 mb/d in the 2045–2050 period. This mirrors the slowdown in demand growth development towards the end of the modelling horizon.
In the initial period to 2030, on an annualized basis, capacity additions are seen at just above 1 mb/d p.a. The average annual additions between 2030 and 2035 are calculated at around 1.5 mb/d, which marks a significant increase relative to the medium term. Average annual additions drop to around 0.6 mb/d p.a. between 2035 and 2040, and further decline to only 0.2 mb/d p.a. on average in the final five years of the outlook. This means that refinery capacity additions at the end of the outlook period will tend to be expansions of existing capacity, rather than new greenfield refineries.
Regional additions
Global refining capacity additions for the period 2025–2050 are projected at around 19.5 mb/d. Of this, 6.2 mb/d (including creep capacity) is expected in the period between 2025 and 2030 and 13.3 mb/d in the period between 2030 and 2050. Following regional oil demand trends, the majority of the incremental refining capacity is expected to be added in developing regions, predominantly in the Asia-Pacific, the Middle East and Africa. These three regions

are set to account for more than 86% of global refining capacity additions in the long term. Figure 5.7 depicts crude distillation capacity additions by region and by period.
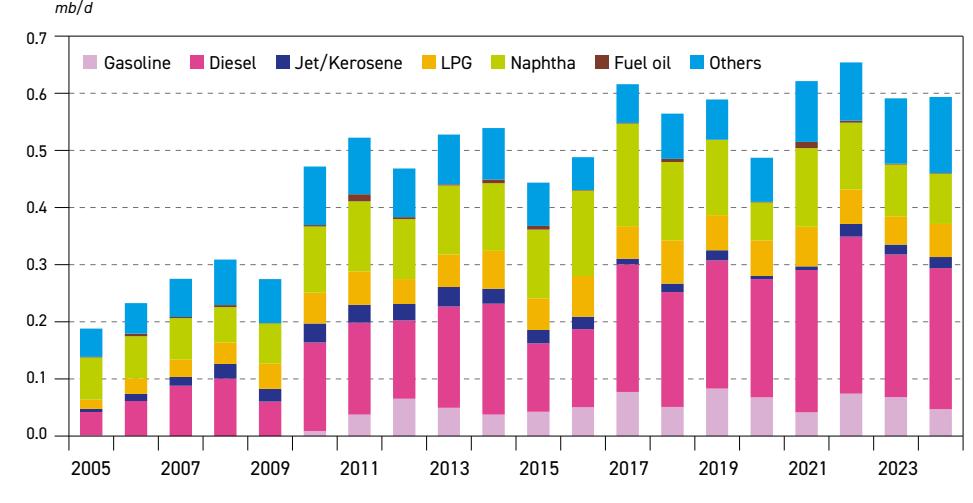
Figure 5.7 Crude distillation capacity additions by region, 2025–2050
Source: OPEC.
By far the largest contribution to refinery capacity additions will come from Other Asia-Pacific (excluding China), with 8.6 mb/d between 2025 and 2050, supported by strong regional demand growth. The largest increment within this region is expected from India, due to its size, followed by several other large countries, including Indonesia.
The required refining capacity additions in Africa are estimated at 3.2 mb/d in the long term. This will be driven by domestic demand growth, but also by efforts to reduce the region's massive amount of refined product imports, especially in West Africa. It is likely that most new refining capacity will largely rely on African crude oil supplies. It is also possible that new capacities will partly rely on imports from other regions, especially in East Africa. It is worth emphasizing that the implementation of large-scale projects, and the relatively long time frame for their completion, still face significant challenges in Africa – including financing and technical issues – that must be resolved if the required refining capacity additions are to be materialized.
Refining capacity additions in China are estimated at 3 mb/d in the long term. The majority of the required capacity of around 2.6 mb/d is expected to come online in the period between 2025 and 2035, driven by oil demand growth, as well as the expected replacement of some old and inefficient refineries (mostly teapot plants) that might close due to more stringent regulations and unfavourable economics. Minor additions are expected thereafter but will likely be limited to the expansion of existing capacities.
The Middle East is expected to add around 2.1 mb/d of new distillation capacity throughout the entire outlook period. However, these additions are front-loaded, with 1 mb/d expected to be commissioned by 2030. Beyond 2030, expansion of the refining system in this region will slow down, with additions of around 0.3 mb/d between 2030 and 2035, declining to 0.15 mb/d

in the period from 2045 to 2050. Most of the additions beyond 2030 will likely be related to expansions of existing refineries rather than the commissioning of new capacity. The region has already built several large, state-of-the-art refineries in recent years, which will help in meeting expanding domestic demand and increase refined product exports to international markets.
Total refining capacity additions in the US & Canada are estimated at around 1.4 mb/d. Capacity additions include a range of continuous debottlenecking efforts at existing refineries, due to the large base capacity already installed in this region. Additions are also expected to help decommission some older, inefficient plants. Availability of oil supply in this region supports the economics of the refining sector and its competitiveness in the international market.
Possible incremental refining capacity in Latin America is estimated at around 1 mb/d between 2025 and 2050. These additions are significantly lower relative to oil demand growth in the same period, estimated at 2.9 mb/d. To help meet that demand growth, Latin America may need to modernize some of its currently underutilized refining capacities. Secondly, due to physical proximity and relatively low transportation costs, Latin America could also see increasing inflows of refined products from the US if deficits arise.
Additions in Russia & Caspian are minor. Total long-term refinery additions in the region are projected at 0.2 mb/d, consisting mostly of debottlenecking existing plants. Finally, in Europe – except for minor additions in the medium term – no new refining capacity is projected for the period beyond 2030, which is in line with this region's expected demand decline.
5.3 Refining sector market balance
This section focuses on the downstream market outlook by taking into consideration the outlined refining capacity additions, regional oil demand and oil supply. The outlook is divided into two medium- and long-term sub-sections that follow two different approaches.
The medium-term outlook looks at refinery additions, as laid out in Section 5.2.1, and compares them with the so-called 'call-on-refining' relative to the base year of 2024. In other words, this analysis shows how the market may change compared to the base year of the Reference Case. The 'call-on-refining' is based on oil demand growth. It also considers demand for various non-refinery fuels, such as NGLs, CTLs, GTLs and biofuels.
The analysis covers the global downstream market, as well as specifics of major regions. The long-term outlook looks at modelling results over the period 2030–2050 and projects refinery throughputs and respective utilization rates at the regional level, including crude and product movements (see Chapter 6).
Medium-term global balance
Medium-term primary capacity additions are projected at 5.8 mb/d globally. On top of these additions, modelling results suggest further debottlenecking or 'creep' capacity additions of almost 0.4 mb/d in the medium term, mostly in the US & Canada and parts of the Asia-Pacific due to the large base of existing refineries. As a result, total distillation capacity additions in the medium term are estimated at roughly 6.2 mb/d. As per the applied methodology, assumed medium-term refinery closures are not taken into account at this stage but are later discussed separately.

The methodology also assumes that new refining capacities may reach the maximum assumed utilization rate of 90% throughout the year. This is considered a reasonable assumption at the global level. Consequently, this provides insight into the potential incremental crude runs or potential refining capacity between 2025 and 2030. Furthermore, as this outlook is on an annual basis, this methodology attempts to capture uncertainties related to the start-up date of refining capacity within the year. This is why the calculation takes into account only one-half of the current year (n) and one-half of the previous year (n–1). With this approach, the cumulative global potential refining capacity is set to reach levels of around 5.6 mb/d by 2030, compared to 2024.
In the next step, the cumulative required incremental crude runs at the global and regional level are calculated. This is the so-called 'call-on-refining' and is based on demand patterns that take into account non-refinery fuels, such as NGLs, biofuels, CTLs and GTLs, which bypass refinery processing. This section covers balances from the perspective of distillation capacity, crude runs and total demand without considering specific refined products that are discussed later.
While medium-term global oil demand growth is estimated at 9.6 mb/d, the total required incremental crude runs are calculated at roughly 7.2 mb/d. In the final step, the potential incremental crude runs are compared with the cumulative incremental refined product demand at an annual level.
The analysis is done at the global level and for each of the major downstream regions. The resulting balances show the incremental refining capacity compared to incremental refined product demand relative to the base year of 2024. This is a good indicator of the state and the direction of the downstream market in the medium term, both globally and regionally.
Figure 5.8 provides a summary assessment of the global cumulative medium-term potential for incremental distillation refining capacity based on project list, compared to the required incremental product supply from refineries relative to the base year.
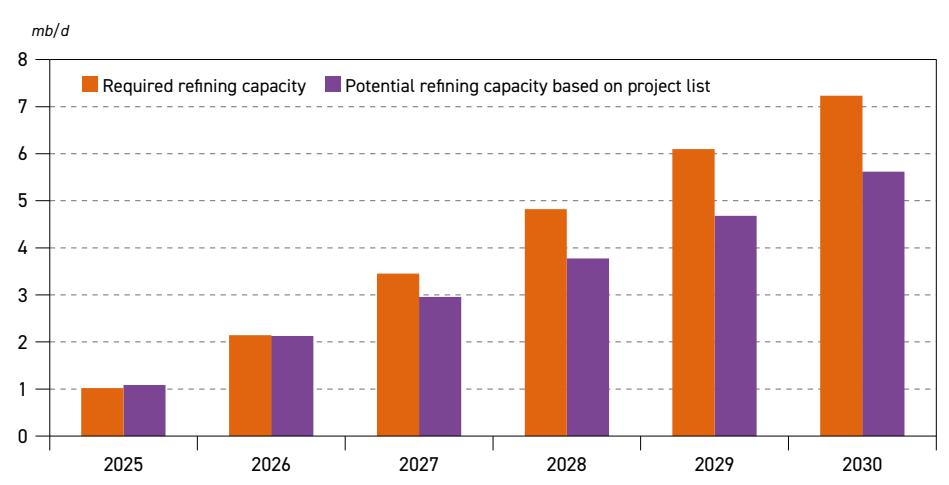
Figure 5.8 Additional global cumulative refinery crude runs, potential* and required**
* Potential: based on expected distillation capacity additions; assuming no closures.
** Required: based on projected demand increases, assuming no change in refined products trade pattern. Source: OPEC.
At the global level, the evolution of incremental potential refining capacity and required refining capacity shows two phases over the medium-term horizon. The first phase corresponds to the years 2025 and 2026, during which the global downstream market is set to remain stable compared to the base year, with incremental refining capacity closely matching the required refining capacity. This is primarily driven by the significant capacity additions set to come online. In contrast, the second phase, spanning from 2027 to 2030, indicates an increasingly tightening downstream market relative to 2024. The deficit between required and potential refining capacity is set to steadily rise from almost 0.5 mb/d in 2027 to 1.6 mb/d by 2030. This is due to strong oil demand growth, which is significantly higher compared to refining capacity additions in this period.
Medium-term regional balances
Figures 5.9 to 5.16 provide a comparison of data for all major downstream regions in the medium term. Figure 5.9 shows the medium-term downstream market balance for the US & Canada relative to 2024. The potential incremental refining capacity is expected to rise gradually to levels of around 0.2 mb/d over the medium term. This is a result of minor refinery expansions in the region, combined with continuous debottlenecking expansions. At the same time, the required refining capacity increases in parallel with the potential refining capacity, reaching around 0.3 mb/d in 2030. Consequently, the medium-term downstream market in the US & Canada is expected to be mostly balanced throughout the outlook period relative to the base year.
Figure 5.9
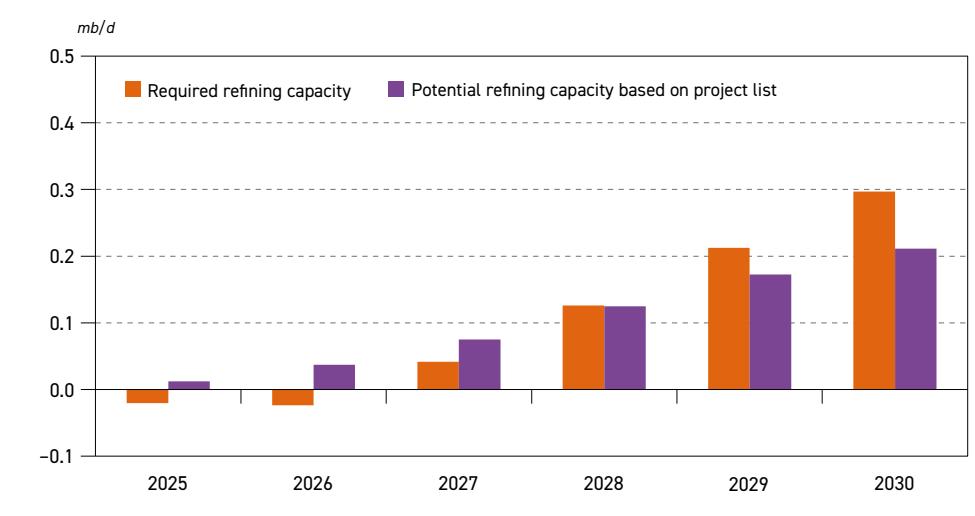
Additional cumulative crude runs in US & Canada, potential and required
Source: OPEC.
It is worth emphasizing that the US & Canada, with its complex refining system and ample domestic supply, is likely to remain competitive in the international downstream market in the medium and long term. This will help to keep utilization rates in this region elevated during the medium term, which is discussed later in this section.
The European downstream market is expected to remain balanced relative to 2024. Figure 5.10 shows cumulative potential refining capacity inching up marginally during the medium
term. During the same period, the required incremental refining capacity is also expected to remain at levels around zero by 2029 and then drop to –0.1 mb/d in 2030, in line with peaking demand during this period. However, expected closures of roughly 0.4 mb/d in the medium term, if materialized, could tighten the market somewhat in the coming years.
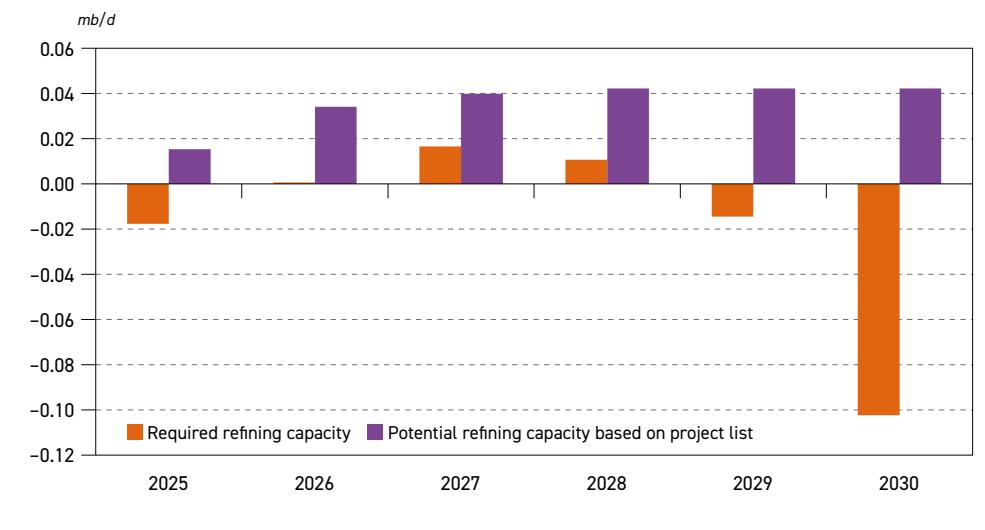
Figure 5.10 Additional cumulative crude runs in Europe, potential and required
Source: OPEC.
Figure 5.11 highlights the medium-term downstream market balance for China. Both cumulative required and cumulative potential refining capacities are set to increase relative to the base year over the medium term, in line with rising oil demand and refinery capacity additions, respectively. China's downstream market is set to remain largely
Figure 5.11


Source: OPEC.
balanced out to 2028 relative to the base year. In the last two years of the mediumterm period, the market is expected to tighten, as the rate of refining capacity additions is expected to decline, while demand continues to rise. Consequently, the country's downstream market indicates a deficit of 0.2 mb/d in 2030.
Figure 5.12 shows the medium-term downstream market balance for the Asia-Pacific (excluding China). Required refining capacity increases strongly from 0.5 mb/d in 2025 to almost 3 mb/d in 2030. This is based on strong oil demand growth in all developing countries of the region, especially India. At the same time, potential incremental refining capacity increases from almost 0.2 mb/d in 2025 to 1.85 mb/d in 2030. As a result, the gap between required and potential refining capacity increases steadily from 0.3 mb/d in 2025 to around 1.1 mb/d in 2030. Consequently, the downstream sector in the Asia-Pacific could see rising utilization rates and possibly higher product imports in the medium term.
Figure 5.12
Additional cumulative crude runs in Asia-Pacific (excl. China), potential and required
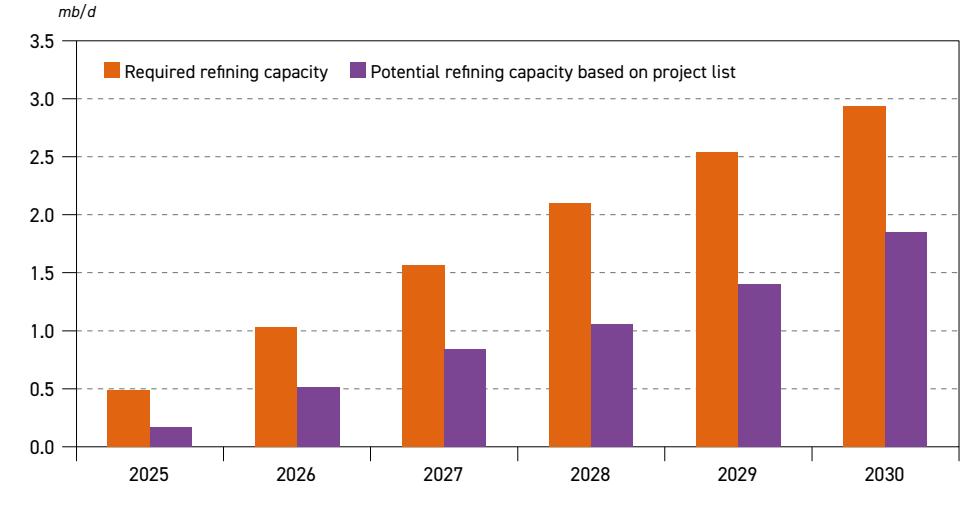
Source: OPEC.
Figure 5.13 shows the medium-term balance for the downstream market in the Middle East. Strong demand growth results in rising required incremental refining capacity relative to 2024. It increases from 0.1 mb/d in 2025 to 1.2 mb/d in 2030. At the same time, potential incremental refining capacity moves from 0.1 mb/d in 2025 to almost 0.9 mb/d by 2030. During 2025 and 2026, the market is largely in balance relative to 2024. The gap between required and potential refining capacity starts opening in 2027 at around 0.1 mb/d and widens to more than 0.3 mb/d towards the end of the medium-term outlook.
In Russia & Caspian (Figure 5.14), only minimal changes relative to the base year are projected. Cumulative required refining capacity is estimated to reach almost 0.2 mb/d by 2030, up from almost zero in 2025, as demand for refinery products increases only modestly. Potential refining capacity increases to 0.1 mb/d in 2030, in line with minor capacity expansions of existing plants. Consequently, the market in Russia & Caspian is set to remain relatively balanced. It is important to note that the required refining capacity relates only to domestic demand trends. However, the downstream sector in Russia & Caspian is largely linked to product exports and changes in the international downstream market.

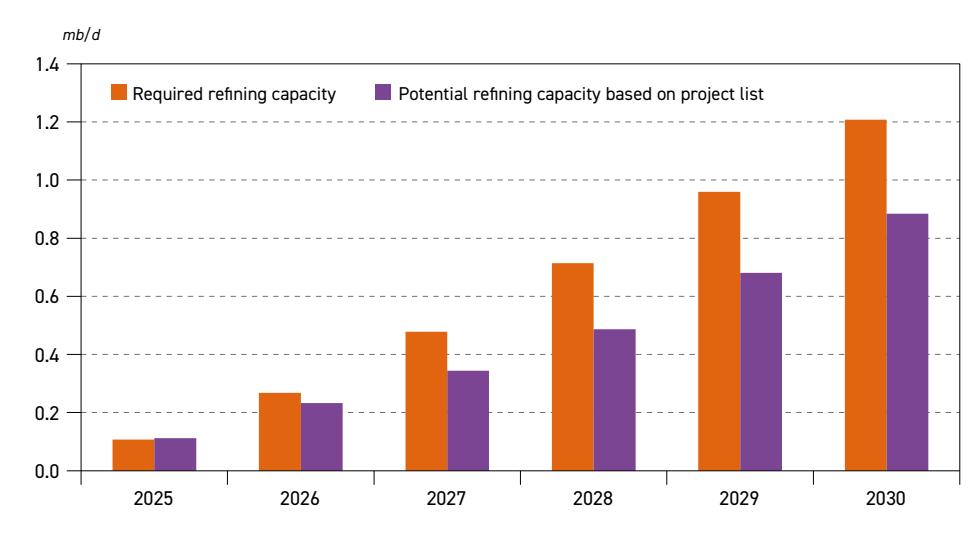
Figure 5.13 Additional cumulative crude runs in the Middle East, potential and required
Source: OPEC.
Figure 5.14 Additional cumulative crude runs in Russia & Caspian, potential and required
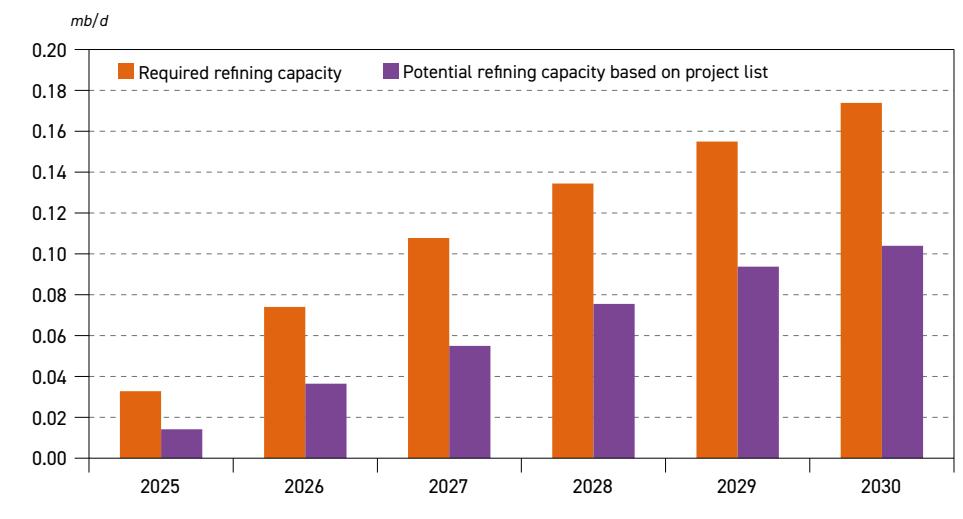
Source: OPEC.
Figure 5.15 highlights the medium-term downstream market balance for Africa. The required cumulative refining capacity is seen increasing from 0.1 mb/d in 2025 to 0.7 mb/d in 2030. At the same time, potential incremental refining capacity is set to increase throughout the medium term, from 0.3 mb/d in 2025 to 1.2 mb/d in 2030, in line with significant refining capacity additions. Potential refining capacity relative to 2024 remains above required capacity throughout the medium term. This means that if the new medium-term refining capacity reaches high utilization rates, African product imports could decline somewhat in comparison with the base year.

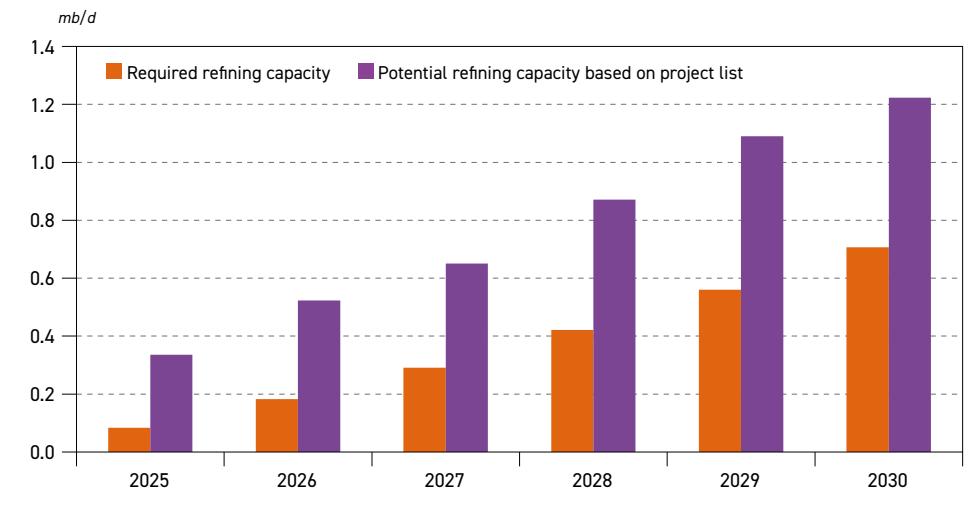
Figure 5.15 Additional cumulative crude runs in Africa, potential and required 2024 2025 2026 2027 2028 2029
Source: OPEC.
The downstream balance in Latin America is shown in Figure 5.16. The cumulative required refining capacity is projected to increase to 0.8 mb/d in 2030, up from 0.1 mb/d in 2025, in line with rising oil demand. The incremental potential capacity is estimated to increase as well, but at a slower pace. It is seen reaching 0.3 mb/d by 2030. Required refining capacity remains above incremental potential capacity throughout the medium term, thus demonstrating a tighter downstream market in the medium term, potentially leading to higher utilization rates of the refining system and potentially to an increase in product imports.
Finally, the recap of the cumulative downstream medium-term balance by region and globally relative to the base year is presented in Figure 5.17. It also shows the change in the gap
Figure 5.16

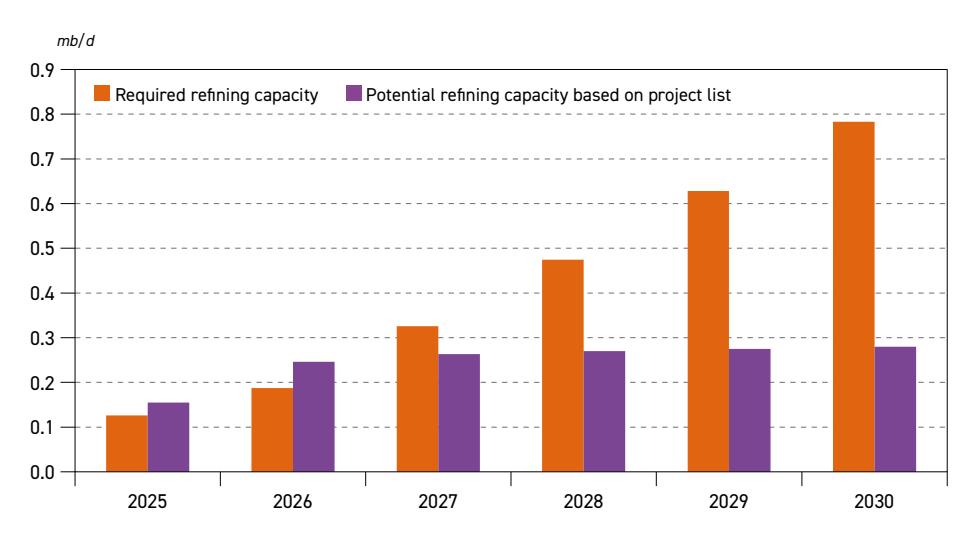
Source: OPEC.


Source: OPEC.
between incremental potential and required refining capacity over the medium term. The largest deficit of refining capacity relative to requirements is expected in the Asia-Pacific (excluding China), due to strong medium-term oil demand growth. Moderate deficits are expected in the Middle East and Latin America, as well as very limited deficits in China towards the end of the period relative to 2024. The cumulative deficit is set to increase steadily from just above 0.3 mb/d in 2025 to reach levels of 2.3 mb/d in 2030.
On the other side, a surplus of refining capacity relative to requirements emerges in Africa, and to a lesser extent in other remaining regions such as Europe. The cumulative surplus for all these regions increases from around 0.4 mb/d in 2025 to below 0.7 mb/d in 2030.
The resulting global balance in 2030 shows a shift from a relatively balanced market in 2025 and 2026 relative to the base year. This is followed by an increasing deficit in potential refining capacity relative to required capacity of around 1.6 mb/d in 2030. It is important to note, however, that this analysis does not include closures (discussed separately in Section 5.4). This means that if all closures materialize as planned, the overall deficit could be somewhat higher. This points towards a stronger downstream market, especially towards the end of the medium-term period when compared to the base year.
Medium-term refinery utilization and throughputs outlooks
This section focuses on medium-term global refinery utilization and refinery throughputs. Unlike the previous section, this analysis includes assumptions on medium-term closures, estimated at around 1 mb/d. It also shows assumed global crude throughputs, the effects of historical and projected closures and assesses spare refining capacity over the medium term.
Global utilization rates in the period 2019–2030 are shown in Figure 5.18. Global utilization rates were at strong levels of around 80% in 2019, but these dropped to around 73% in 2020 due to the

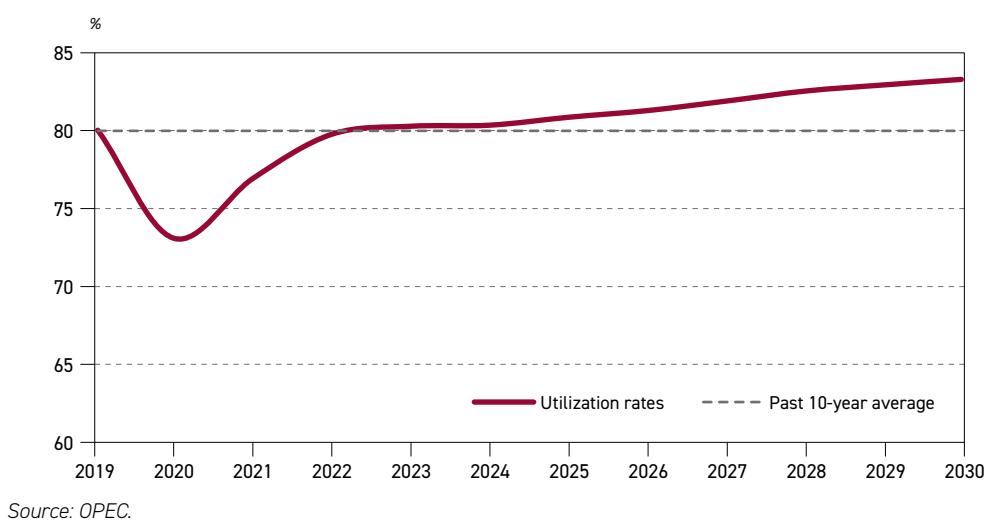
Figure 5.18 Historical and projected global refinery utilization, 2019–2030
demand shock caused by the COVID-19 pandemic. The recovery was gradual in the subsequent years, reaching 76.9% in 2021, almost 80% in 2022, and settling at around 80.4% in 2024.
Global utilization rates are expected to continue increasing in the medium term, reaching 83.3% in 2030. Strong demand growth, insufficient refining capacity additions, as well as announced closures of around 1 mb/d during the medium term, support this trend. Any additional shutdown beyond officially announced capacity closures, such as in the case of China's teapots refineries, would raise global utilization rates even further. In addition, another uncertainty stems from the timing of the estimated refining capacity additions expected to occur in the medium term. Any potential delays would necessarily push the utilization rate even higher.
Global utilization rates are calculated based on nominal refining capacities, which are assumed to be fully available over the medium term. There is a significant discrepancy in regional utilization rates. Many countries, particularly in Africa and Latin America, still operate old and inefficient refineries, which have been running at relatively low levels for many years. Although an improvement is expected in the medium term, these rates are not expected to reach 70% (see Table 5.4) and will therefore remain well below 80%. This implies that, to maintain a global utilization rate of almost 83.5% by 2030, refineries located in other regions will need to operate at levels significantly above 80%, especially in the US & Canada and the Asia-Pacific.
Furthermore, as was the case in previous years, some countries may limit exports of refined products from their domestic refineries due to various reasons, including security of supply for specific products. Recent uncertainties related to the evolution of US trade tariffs and any subsequent retaliatory measures by other countries could also affect the trade of crude oil and refined products. These policies could reduce the actual available refining capacity globally, increasing pressure on the downstream system elsewhere.
Figure 5.19 shows the evolution of global oil (liquids) demand, refinery crude and condensate throughputs, as well as the absolute nominal distillation capacity. The historical trend reveals that nominal distillation capacity has long exceeded oil demand.

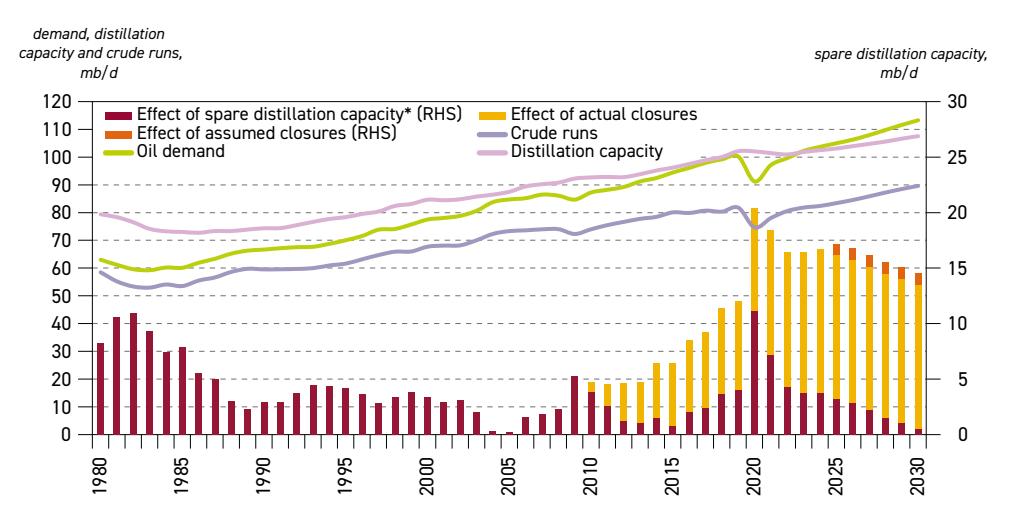
Figure 5.19 Global oil demand, refining capacity and crude runs, 1980–2030
* Effective 'spare' capacity estimate based on assumed 84% utilization rate, accounting for already-closed capacity. Source: OPEC.
However, this trend has gradually shifted towards a convergence, reaching a tipping point in 2023, when total oil (liquids) demand exceeded refining capacity. From this year onward, the gap between oil demand and refining capacity is expected to continue widening over the medium term.
This is due to shifts in the structure of global oil demand and the increasing share of demand attributed to non-refinery fuels, largely NGLs (which bypass refinery systems), but also biofuels, CTLs and GTLs. The increasing share of these liquids leads to a reduced share of refinery products in total oil demand. This has kept refining capacity additions lower relative to oil demand increments.
Global oil demand is projected to increase from around 103.7 mb/d in 2024 to 113.3 mb/d in 2030, an increase of 9.6 mb/d. At the same time, refinery runs are projected to rise by roughly 7.2 mb/d to 89.6 mb/d by the end of the medium-term period. Figure 5.18 also shows the effects of actual and assumed refinery closures. Since 2010, around 13 mb/d of refining capacity has been shut down in several closure waves and for many reasons. Between 2020 and 2024, around 5 mb/d of capacity was put out of service, mainly due to declining demand and margins during the pandemic. According to announcements and plans, another 1 mb/d is expected to be shut down in the medium term (2025–2030).
Based on projected refinery runs, as well as projected refinery additions and closures, the so-called spare refining capacity is calculated, where the maximum global sustainable utilization rate is estimated at around 84%. This is historically the highest observed level. Consequently, the level of spare capacity was at its highest in 2020, at 11 mb/d. However, as demand recovered thereafter and significant capacity was closed, spare capacity dropped to 3.7 mb/d in 2024. The global spare capacity level is expected to decline gradually to only around 0.5 mb/d in 2030, in line with rising refinery runs and expected closures. This also includes the assumption that all projected refining capacity additions are built on time, which means that any delays could lower the level of spare capacity further or push utilization rates above 84%.

Long-term balance for the refining sector
This section focuses on long-term crude and condensate throughputs, as well as longterm utilization rates at the global and regional level. These are based on modelling cases and in line with oil demand (Chapter 3), as well as liquid supply (Chapter 4) assumptions. Assumptions on medium-term refining capacity additions and refinery closures, as discussed above, are also an integral part of the modelling cases.
Table 5.4 illustrates projected refinery throughputs and respective utilization rates at the global level and for major downstream regions. While the assessment of the utilization rates takes projected medium-term closures into account, it excludes the implied closures in the long term.
Total crude unit throughputs mb/d US & Canada Latin America Africa Europe Russia & Caspian Middle East China Other Asia-Pacific Global 2024 18.0 4.8 2.0 11.7 6.5 8.6 14.4 16.5 82.4 2030 18.1 5.4 3.4 12.0 6.5 9.3 15.6 19.2 89.6 2035 18.4 6.0 4.3 11.6 6.5 9.7 16.3 20.7 93.4 2040 18.4 6.6 4.9 10.5 6.3 10.1 16.1 21.6 94.7 2045 18.1 6.9 5.2 10.2 6.3 10.4 16.0 22.3 95.5 2050 17.7 7.1 5.5 9.9 6.3 10.8 15.8 22.9 95.9
Table 5.4
Crude unit throughputs and utilization rates, 2024–2050
Crude unit utilizations
% of calendar day capacity
| US & Canada | Latin America | Africa | Europe | Russia & Caspian | Middle East | China | Other Asia Pacific | Global | |
|---|---|---|---|---|---|---|---|---|---|
| 2024 | 91.7 | 59.6 | 50.4 | 79.1 | 81.8 | 74.6 | 81.1 | 87.0 | 80.4 |
| 2030 | 92.2 | 66.0 | 67.4 | 83.5 | 81.6 | 74.8 | 83.6 | 90.8 | 83.3 |
| 2035 | 90.9 | 70.4 | 69.4 | 80.3 | 80.0 | 75.4 | 80.8 | 84.8 | 81.3 |
| 2040 | 89.6 | 75.7 | 73.6 | 73.1 | 77.9 | 77.0 | 78.8 | 84.3 | 80.4 |
| 2045 | 87.5 | 77.5 | 75.2 | 70.5 | 77.7 | 78.0 | 77.8 | 83.8 | 79.8 |
| 2050 | 85.1 | 79.5 | 78.2 | 68.6 | 77.5 | 79.4 | 76.9 | 83.2 | 79.3 |
Source: OPEC.
Due to strong demand growth in the medium term, global refinery throughputs are expected to see a significant increase from 82.4 mb/d in 2024 to 89.6 mb/d in 2030, translating to an annual average growth of around 1.2 mb/d p.a. Thereafter, global refinery runs are set to continue increasing, albeit at a slower pace, reaching levels of 93.4 mb/d in 2035, reflecting an annual average growth of almost 0.8 mb/d. The deceleration trend will continue in the longer term with global refinery throughputs reaching almost 96 mb/d by 2050. This is in

line with the slowdown in global demand growth, as well as the rising share of non-oil liquids (biofuels and synthetic fuels) and increasing volume of NGLs that surpass refining.
At the same time, the global utilization rate is expected to rise from 80.4% in 2024 to 83.3% in 2030, highlighting a tightening downstream market. Post-2030, the utilization rate is expected to decrease gradually to 79.3% by 2050. This is a result of rising refining capacity in developing countries, where demand is expected to grow. Declining utilization rates signal possible refinery closures in the long term in some regions.
Behind the global trend, there are specific and diverging regional trends. Refinery throughputs are expected to increase in developing regions, especially the Asia-Pacific (including China), the Middle East, Africa, as well as Latin America. This will be partly offset by the long-term decrease in all developed regions, including the US & Canada, Europe and Russia & Caspian.
In the US & Canada, refinery throughputs were assessed at 18 mb/d in 2024 and are expected to increase only marginally to 18.1 mb/d in 2030. Thereafter, they are set to hover at around 18.4 mb/d in the period to 2040. Despite the decline in domestic demand for oil, the region is expected to export significant volumes of refined products to other regions due to the availability of crude oil and its competitive refining system. However, in the last decade of the outlook, refinery throughputs are expected to decline to around 17.7 mb/d in 2050, reflecting declining demand in the region. Refinery utilization rates in this region are set to decline gradually from just above 91.7% in 2024 to above 85% in 2050. The utilization rate in 2050 is comparatively high, but still well below the historical levels seen in the US & Canada. This could be an indication of limited refinery closures, which could hit some older and inefficient plants in the long term.
Refinery throughputs in Europe are expected to increase marginally in the medium term, inching up from 11.7 mb/d in 2024 to 12 mb/d in 2030 following a slight increase in demand. However, over the longer term, refinery throughputs in Europe are projected to decline from 12 mb/d in 2030 to just below 10 mb/d in 2050. This is due to declining oil demand and the lack of sufficient domestic oil supply. Consequently, the utilization rate is set to increase from 79.1% in 2024 to 83.5% in 2030, also supported by expected refinery closures. Beyond 2030, utilization rates are expected to fall to 68.6% in 2050, which will certainly lead to refinery closures in the long term. Many of these capacities could be repurposed for biofuels, synthetic fuel or hydrogen production, or serve as terminals.
In Russia & Caspian, refinery runs are projected to remain stable between 2024 and 2035 at around 6.5 mb/d, followed by a minor decline to 6.3 mb/d in 2050. The major driver is peaking oil demand in this region after 2035. Accordingly, utilization rates in Russia & Caspian are expected to decline from almost 82% in 2024 to below 77.5% in 2050. This could lead to limited capacity closures, especially in the last decade of the forecast period.
By contrast, this outlook points to a rise in refinery throughputs in the other regions over the forecast period. China's refinery throughputs will evolve through two distinct periods. They are expected to increase from 14.4 mb/d in 2024 to 16.3 mb/d in 2035, on the back of growth in domestic oil demand in this period. However, runs are then seen declining gradually to around 15.8 mb/d by 2050. The combination of declining oil demand and rising share of nonrefinery products in the demand mix leads to declining refinery runs in China beyond 2035. Consequently, refinery utilization rates are expected to increase from above 81% in 2024 to 83.6% in 2030, due to the significant increase in refinery runs compared to new refinery

additions. As new capacities are added in the 2030–2035 period, utilization rates are projected to decrease to below 81% in 2035. Thereafter, utilization rates continue decreasing to just below 77% in 2050 due to the decline in oil demand and rising share of non-refinery fuels. The potential implication of this development will likely be closures of older refining capacity, including teapot refineries (see Section 5.4).
In Other Asia-Pacific, based on strong oil demand growth, refinery throughputs are projected to increase significantly over the outlook period. Refinery runs are set to rise strongly from 16.5 mb/d in 2024 to 19.2 mb/d in 2030. The growth in throughputs is expected to decelerate gradually afterwards but will remain strong. Runs are set to reach 20.7 mb/d in 2035 and to finally hit 22.9 mb/d in 2050. Due to limited refinery capacity expansion, refinery utilization rates will increase strongly in the medium term, reaching 90.8% in 2030, up from 87% in 2024. Thereafter, a gradual decline is expected, mirroring significant refinery capacity additions. Utilization rates are seen at 84.3% in 2040 and 83.2% in 2050.
In the Middle East, refinery throughputs are projected to increase from 8.6 mb/d in 2024 to 9.3 mb/d in 2030, followed by a gradual increase to 10.8 mb/d in 2050. This will be driven by domestic demand growth, as well as rising product exports to other regions. Available domestic crude oil supplies also support this trend. In line with rising throughputs, utilization rates are projected to gradually increase to 79.4% in 2050 from 74.6% in 2024. Limited closures and the rationalization of older capacities in the long term cannot be excluded in the long term.
In Africa, refinery throughputs are set to increase sharply over the medium term, followed by steady growth beyond 2030, in line with rising oil demand and expanding refining capacity. African refinery throughputs are seen rising from roughly 2 mb/d in 2024 to 3.4 mb/d in 2030 and will continue increasing to 5.5 mb/d by 2050. Fast refinery capacity expansions and the modernization of existing refineries is crucial for the continent to increase domestic throughputs and reduce its dependency on imported refined products. Based on these assumptions, Africa's refinery utilization rates are also expected to increase accordingly, moving up from around 50.4% in 2024 to more than 78% in 2050. However, it is expected that Africa will be exposed to rising international competition, especially from the US and to a lesser extent from Europe, where refiners are expected to increasingly turn to international downstream markets in the long term.
Finally, refinery throughputs in Latin America are set to increase gradually from 4.8 mb/d in 2024 to 7.1 mb/d in 2050, reflecting strong demand growth and rising domestic oil supplies. Refinery utilization rates are projected to increase strongly from around 59.6% in 2024 to 79.5% in 2050. Similar to Africa, this assumes the modernization of existing refineries, many of which are old and inefficient, in addition to projected refinery capacity expansion. This would enable the region to limit its dependency on refined product imports and profit from domestic crude oil supplies.
5.4 Refinery closures
This section discusses refinery closures in the medium and long term at the global and regional levels. Two different methodologies are applied in the analysis. Refinery closure projections in the medium term include firm and probable closures, largely based on announcements by companies and governments, and analysis of refinery closures. In the long term (beyond 2030), the outlook is much more uncertain. The analysis is based on projections for regional
utilization rates, and a conclusion is drawn on how many closures would be needed to keep regional utilization rates at technically and financially sustainable levels until the end of the outlook period.
Refinery closures in the medium term
Figure 5.20 provide an overview of recent and projected refinery closures by major region in the period to 2030.
Before 2020, global refining capacity appeared to be reaching a point of potential rationalization, driven by additions of new state-of-the-art capacities and the rise of alternative energy sources in the global energy mix. The sudden drop in oil demand caused by the COVID-19 pandemic and the corresponding unfavorable economics in the downstream sector led to a wave of refinery closures. It was primarily the older, less efficient, and less profitable facilities that were forced to cease operations. As a result, about 5 mb/d of refining capacity was closed between 2020 and 2024. Significant closures of around 3.1 mb/d occurred in developed countries (US & Canada, Europe and the developed Asia-Pacific), partly also due to changing narratives related to the future of the energy sector in general and oil demand in particular. China also closed significant refining capacities of around 0.9 mb/d in the same period. This was due to government policies aimed at closing old and inefficient teapot refineries and replacing them with new projects. Africa also witnessed some refinery closures, mainly attributed to several plants in South Africa.
Figure 5.20 Projected net refinery closures by region
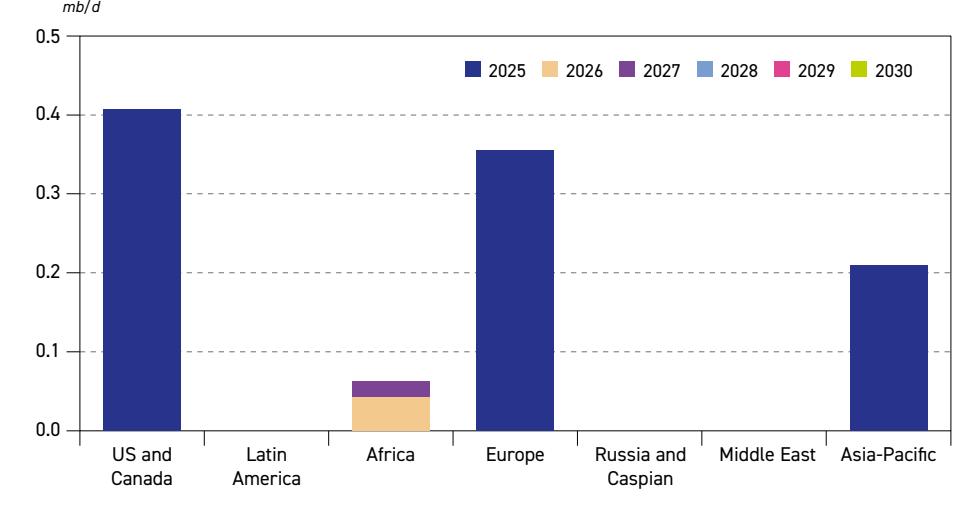
Source: OPEC.
In the medium term, it is expected that around 1 mb/d of capacity will be closed, primarily during 2025. Closures will occur mostly in the US & Canada, Europe and the Asia-Pacific, with minor shutdowns in Africa. No closures have been announced or are expected in other regions in the period to 2030.
The US & Canada will account for almost 40% of closures between 2025 and 2030. This includes the closure of LyondellBasell's facility in Houston and Phillips 66's in Los Angeles.

Both are likely to stop operating in 2025. During the same year, Europe is set to close 350 tb/d, accounting for almost 35% of medium-term capacity closures globally, the majority of which is expected in Germany, including Shell's Wesseling refinery. In the Asia-Pacific region, China has already shut down 210 tb/d of capacity at the Dalian Petrochemical plant and plans to close the remaining 210 tb/d still in operation by mid-2025. Finally, minor closures are foreseen in Africa in 2026 and 2027, while no closures are expected in other regions.
It is also worth noting that the projected medium-term refinery closures in this outlook are well below the levels recorded in the period 2020 to 2024, when annual closures averaged around 1 mb/d, driven largely by the pandemic and related demand patterns. In contrast, closures in the coming years are expected to average just below 0.2 mb/d annually, indicating that the major wave of rationalization has largely subsided. Strong demand growth and improved refining margins since mid-2022 have also helped keep many plants operating. Still, tightening environmental regulations, rising competition and shifting demand – especially in developed markets – could drive further rationalization ahead.
It is important to note that, beyond officially announced capacity closures, additional refinery capacities could be shut down in the medium term due to factors such as technical issues at ageing facilities, weak financial performance, and evolving government policies. In China, for instance, several refineries – particularly smaller, independent 'teapot' facilities – are expected to cease operations. It is envisaged that they will be partly replaced by new, state-of-the-art integrated refineries. These modern plants, combined with government initiatives to increase energy efficiency and limit the country's refining capacity to 20 mb/d to boost utilization rates above 80%, are putting increasing pressure on older, less competitive refineries.
Refinery closures in the long term
As per the applied methodology, refinery closures in the long term (beyond 2030) are not explicitly projected. Instead, only so-called implied refinery closures are calculated and indicated, based on the long-term modelling results. In more detail, implied refinery closures are back-calculated while targeting a long-term sustainable average utilization rate on a regional level. In developed regions, this rate hovers around 80%, but it is different in other regions like Africa, Latin America and – to some extent – the Asia-Pacific and Middle East.
The general assumption is that most of these implied closures will comprise simple, nonintegrated and less efficient plants that will struggle to compete against complex and integrated plants once utilization rates start declining. It is important to note that long-term modelling cases already consider the aforementioned medium-term closures of around 1 mb/d.
Based on refinery utilization patterns in the long term, refining capacity of around 4 mb/d could be closed globally if reasonable utilization rates are to be maintained, on top of assessed medium-term closures. Around half – or 2 mb/d – of refining capacity could be closed in Europe, due to the decline in demand, stringent energy policies and rising competition. In this regard, it is important to note that, historically, Europe is an important supplier of refined products to Africa. If the planned capacity additions in Africa do not materialize on time, this could support the European refining market and postpone closures to later dates.
In the US & Canada, the average utilization rate in 2050 is expected to remain above 85% at the end of the outlook period. While this is comparatively high in international terms, it is
still lower than the region's historical utilization rates, which have at times exceeded 90%. This is why some closures of old and less complex units are possible in the long term. Due to the high competitiveness of this region's refineries in the global market, exports of refined products to other regions could increase significantly in the long term, which would help limit or delay possible additional closures in the region.
In China, some closures in the long term are possible and could include less efficient teapot refiners, which could face challenges operating in a market dominated by large integrated plants. Some teapot plants were already shut at the beginning of this decade and were replaced by large-scale refineries, many of which are integrated with petrochemicals. Furthermore, China's NDRC introduced several regulations and guidelines that could negatively affect the teapot sector, including potential closures in the medium and long term. These include limiting China's overall crude processing capacity to 20 mb/d and forcing the closure of small plants of less than 40 tb/d. Furthermore, China is also seeking to increase the energy efficiency of its refining sector. The benchmark level has been established at 8.5 kgoe/mt, and all capacity above this level should be phased out. By this year, 30% of refining capacity should reach an advanced level of energy efficiency, namely energy consumption of 7.5 kgoe/mt. These measures should help reduce the carbon footprint of the downstream industry in China and represent a significant risk for small teapot plants. Therefore, there could be up to 1 mb/d of capacity closures beyond 2030 in China.
OECD Asia-Pacific could also see some closures. Significant capacity has already been shut down in the region, particularly in Japan. The country has seen several closures in recent years, but has not announced specific closures for the medium-term. However, the potential for closures in the medium and long term remains high. Japan's smaller and less complex refineries were built mainly to serve its domestic fuel needs. Japan's refineries are also set to process lighter and sweeter grades of crude oil, which are more expensive than heavier and more sour grades. The combination of higher yields of lower-value products, using more expensive crude oils and declining long term domestic oil demand makes refiners in Japan less profitable and less competitive in world markets.
Finally, in Latin America and Africa, closures are possible throughout the outlook period. Both regions have many older and inefficient refineries, which operate at relatively low or even close-to-zero utilization rates. Some countries are trying to modernize existing refineries, but these efforts currently remain insufficient due to financial and technical issues. This is why some closures in these two regions can be expected in the long term.
5.5 Secondary capacity
Refining capacity is generally denoted by primary, i.e. distillation, capacity. However, it is secondary capacity that includes conversion and product quality improvement units that are crucial for processing crude fractions into finished products that provide most of a refinery's 'value-added'. Secondary capacity provides flexibility to the refining system to meet the final product demand of a region, including seasonal and structural changes over time. The development of secondary capacity goes hand-in-hand with evolving refined product demand and product specifications, such as sulphur and aromatics content, as well as octane number standards. The development of secondary capacity also depends on the evolving crude slate, which changes over time. A heavier crude slate normally requires additional upgrading capacities, particularly if a large share of residual fuel is to be avoided.

This section discusses secondary capacity additions in the medium and long term by major categories, namely conversion, desulphurization and octane units. Similar to distillation capacity, the Reference Case provides projections for secondary capacity additions in the medium term based on existing projects, which are likely to be commissioned through 2030. The long-term outlook for secondary capacity additions is assessed based on the modelling results for anchor years, in terms of required capacity to meet regional and global product demand.
Medium-term secondary capacity additions
This section focuses on medium-term secondary capacity additions related to a list of specific projects that are under development. Most of these projects are directly linked to distillation capacity additions that are estimated at 5.8 mb/d (excluding debottlenecking) in the period to 2030. Details on secondary capacity additions in the period to 2030 are shown in Table 5.5. These include 3.8 mb/d of conversion/upgrading capacity, 4.4 mb/d of desulphurization capacity and 1.4 mb/d of octane units. Most of these additions are projected to be commissioned in the Middle East and Asia-Pacific (including China), as well as Africa. These regions account for just above 80% of global conversion additions, as well as around 85% of global desulphurization and octane unit increments. This is somewhat lower than the share these regions have in distillation capacity additions. This is due to continuous additions of secondary capacity in other regions, related to upgrades and/or modernization of existing refineries, particularly in Russia & Caspian.
It is worth noting that the rate of secondary capacity additions in relation to new distillation capacity is comparatively higher than the rate observed in the existing refining system
| By year | |||||
|---|---|---|---|---|---|
| Conversion | Desulphurization* | Octane units | |||
| 2025 | 1.0 | 1.0 | 0.3 | ||
| 2026 | 0.7 | 0.8 | 0.2 | ||
| 2027 | 0.5 | 0.6 | 0.2 | ||
| 2028 | 0.5 | 0.7 | 0.3 | ||
| 2029 | 0.6 | 0.7 | 0.2 | ||
| 2030 | 0.6 | 0.5 0.2 | |||
| By region | |||||
| Conversion | Desulphurization* | Octane units | |||
| US & Canada | 0.0 | 0.1 | 0.0 | ||
| Latin America | 0.2 | 0.2 | 0.1 | ||
| Africa | 0.5 | 0.6 | 0.3 | ||
| Europe | 0.0 | 0.0 | 0.0 | ||
| Russia & Caspian | 0.5 | 0.3 | 0.1 | ||
| Middle East | 0.6 | 1.0 | 0.2 | ||
| China | 0.8 | 0.6 | 0.3 | ||
| Other Asia | 1.2 | 1.5 | 0.5 | ||
| World | 3.8 | 4.4 | 1.4 | ||
Table 5.5 Secondary capacity additions from existing projects, 2025–2030
mb/d
* Desulphurization capacity in this table includes naphtha desulphurization. Source: OPEC.

(see Table 5.1). This is mainly due to the large number of new refineries – especially in the Middle East and Asia-Pacific – that are highly complex and integrated plants, designed to process medium- and heavy-sour crude.
Conversion units
Conversion capacity additions in the medium term are shown in Figure 5.21. At the global level, out of 3.8 mb/d of conversion unit additions, almost 50% are for hydrocracking units. The hydrocracker's inherent flexibility to handle a wide range of feedstocks, as well as its ability to produce ultra-low sulphur middle and light distillates, makes it the preferred technology of many refiners. In addition to hydrocracking, around 1.2 mb/d of FCC and 0.8 mb/d of coking capacity are expected to be added in the period to 2030.
Figure 5.21
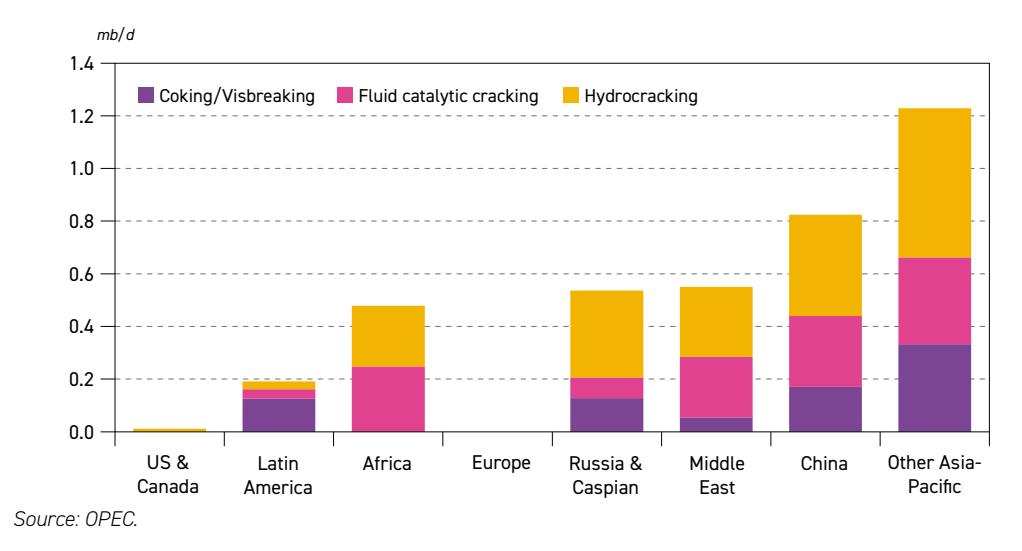
Conversion projects by region, 2025–2030
At a regional level, the vast majority of medium-term conversion capacity additions are projected to occur in Other Asia-Pacific, China, Africa and the Middle East, but, to an extent, also in Russia & Caspian. Other Asia-Pacific is set to lead global expansions in conversion units, adding around 1.2 mb/d, followed by China with 0.8 mb/d. The Middle East is expected to commission nearly 0.6 mb/d of additional conversion capacity, while Africa will add almost 0.5 mb/d. Despite its low additions in distillation capacity, Russia & Caspian will see conversion capacity grow (especially hydrocracking) by around 0.5 mb/d. This reflects the region's efforts to upgrade existing plants and reduce fuel oil output, especially in Russia. Finally, Latin America is set to expand conversion capacity by almost 0.2 mb/d in the period to 2030, while minor or no additions are expected in the US & Canada and Europe.
Desulphurization units
In the medium term, around 4.4 mb/d of new desulphurization capacity is likely to be commissioned. The Asia-Pacific (including China), Middle East and Africa combined are set to account for more than 85%, or around 3.8 mb/d, of global desulphurization capacity additions. The Asia-Pacific and China are expected to add 1.5 mb/d and 0.6 mb/d of new capacity, respectively. Desulphurization capacity additions will reach 1 mb/d in the Middle East over

the medium term, while they are likely to amount to 0.6 mb/d in Africa. Only limited or no additions to desulphurization capacity are expected in Latin America, Russia & Caspian, the US & Canada and Europe.
Looking at desulphurization capacity additions from the perspective of feedstock processing, the majority of new capacity is linked to middle distillates – 2.3 mb/d; around 1.2 mb/d is designated for naphtha processing, 0.5 mb/d for gasoline and the remainder for heavy streams (e.g. vacuum gasoil and residue).
Octane units
Around 1.4 mb/d of global octane unit capacity is likely to come online in the period between 2025 and 2030. This reflects growing gasoline demand, mostly in developing regions, as well as rising specifications for octane number in some countries, including in Eurasia and Latin America. The Asia-Pacific (including China) is expected to add around 0.7 mb/d of octane units, followed by Africa and the Middle East with 0.3 mb/d and 0.2 mb/d, respectively. Russia & Caspian and Latin America are set to add roughly 0.1 mb/d each to their octane unit capacities.
Additions in other regions are expected to be limited in the medium term due to a lack of gasoline demand growth, such as in Europe, or because significant octane unit capacities are already in place, as in the US & Canada.
From a technology perspective, the majority of octane unit additions – around 70% of the total – are expected to be from catalytic reforming. This will be accompanied by around 0.2 mb/d of new isomerization capacity and more than 0.1 mb/d of added alkylation capacity. Capacity additions of MTBE/ethyl tertiary-butyl ether (ETBE) are expected to be limited in the medium term (less than 0.1 mb/d), potentially in developing countries, especially in the Asia-Pacific.
Long-term secondary capacity additions
Long-term secondary capacity additions are set to be driven by the level and composition of oil demand, evolving product specifications, as well as crude oil quality. Many recent refinery additions have already included relatively large and complex units with high levels of upgrading, desulphurization, and related secondary processing, generally with an increased focus on petrochemical integration. This is likely to continue in the future, in line with future oil demand trends.
Global trends demonstrate strong demand growth for ethane/LPG and naphtha in the long term, supported by a continued focus on petrochemicals. Furthermore, global gasoline demand is expected to increase in the first part of the outlook period, followed by slower growth thereafter. This is mostly due to the offsetting effect between OECD and non-OECD demand trends. Middle distillates will also grow strongly, especially jet/kerosene. At the same time, the outlook sees increased supplies of medium- and heavy-sour crude, especially after 2030, raising requirements for additional upgrading and desulphurization capacities.
A few exceptions to the trend towards increased complexity should be pointed out. These are related to new condensate splitters, particularly in the Middle East. Condensate splitters tend to contain limited secondary processing, often related to the processing of light
products like naphtha and gasoline, and are centred on catalytic reforming, isomerization and hydrotreating. This trend could continue, as the share of condensates and NGLs in overall liquid supply is likely to increase.
In setting out to capture the outlook for global and regional refining, particularly future processing needs by type of unit, the modelling is forced to contend with a number of challenges. One relates to the evolution of refinery process technology. This is assumed to be stable, with only gradual changes over time, mainly as catalysts slowly improve.
The emerging trend to increase petrochemical yields represents a second potential modelling challenge. While many existing refineries in the US and Europe have some degree of petrochemical capability, the number of large integrated refining plus petrochemical 'mega-projects' continues to rise, especially in the Middle East and Asia-Pacific. Several of these new complexes are designed to produce a significant share of petrochemical feedstocks, often 40% or more. 'Crude-to-chemicals' technology represents a step forward in this direction. In addition to the flexibility and cost savings it provides, it reduces greenhouse gas emissions and overall environmental impact by optimizing the conversion process and minimizing energy use.
Table 5.6 and Figure 5.22 show global secondary capacity requirements in addition to required primary capacity additions in the period up to 2050. On top of 19.5 mb/d for distillation capacity, there are requirements for around 11.2 mb/d of conversion capacity, 20.4 mb/d for desulphurization and 6.3 mb/d for octane units. These projections take into account capacity additions and capacity closures assumed for the period 2025–2030, as discussed above.
| Existing projects | Additional requirements | Total additions | ||
|---|---|---|---|---|
| to 2030* | 2031–2040 | 2041–2050 | to 2050 | |
| Crude distillation | 5.8 | 10.6 | 3.1 | 19.5 |
| Conversion | 3.8 | 4.7 | 2.7 | 11.2 |
| Coking/Visbreaking | 0.8 | 1.6 | 0.7 | 3.2 |
| Catalytic cracking | 1.2 | 1.0 | 0.7 | 2.8 |
| Hydro-cracking | 1.8 | 2.1 | 1.3 | 5.2 |
| Desulphurization** | 3.1 | 11.2 | 6.0 | 20.4 |
| Gasoline | 0.5 | 2.3 | 1.1 | 4.0 |
| Distillate | 2.3 | 7.6 | 4.4 | 14.3 |
| VGO/Resid | 0.3 | 1.3 | 0.6 | 2.2 |
| Octane units*** | 1.4 | 3.3 | 1.6 | 6.3 |
| Catalytic reforming | 1.0 | 1.9 | 1.3 | 4.2 |
| Alkylation | 0.1 | 1.4 | 0.3 | 1.8 |
| Isomerization | 0.2 | 0.0 | 0.0 | 0.2 |
| MTBE | 0.1 | 0.1 | 0.1 | 0.2 |
Table 5.6 Global capacity requirements by process, 2025–2050
* Existing projects exclude additions resulting from 'capacity creep'.
** Naphtha desulphurization not included.
*** New units only (excludes any revamping). Source: OPEC.
mb/d
5
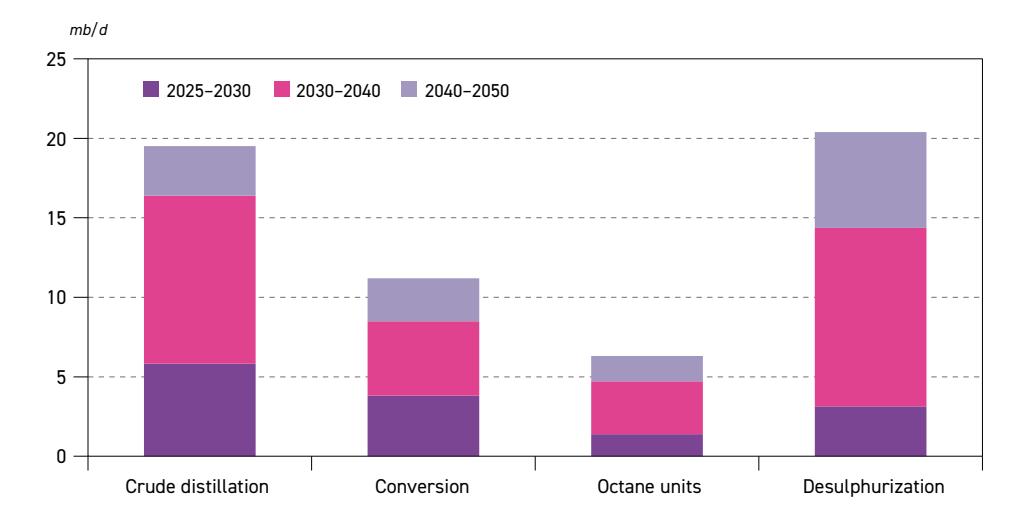
Figure 5.22 Global capacity requirements by process type, 2025–2050
Source: OPEC.
In terms of relative values to primary capacity expansions, desulphurization will account for the largest ratio, of 105%, followed by conversion units with 57%, and octane units with 32% relative to primary capacity additions. These ratios are significantly higher than those of current base capacity (Section 5.1), which is in line with the analysis provided above.
Similar to distillation capacity expansions, the majority of secondary capacity additions are expected to materialize already before 2040. Thereafter, additions will mostly be limited to the expansion and modernization of existing plants, particularly towards the end of the forecast period.
Conversion units
Figure 5.23 presents long-term conversion capacity requirements by region. In line with growing oil demand, the majority of conversion capacity additions are expected in the Asia-Pacific, Middle East and Africa, accounting for 71% of the total. However, it is also important to note that significant conversion capacity additions in other regions such as the US & Canada, Latin America and Russia & Caspian, are expected, despite minimal distillation capacity additions, while marginal additions are also anticipated in Europe.
From a technology perspective, hydrocracking accounts for the largest increment, with 5.2 mb/d of the global required conversion capacity of 11.2 mb/d, as shown in Table 5.7. Hydrocracking is expected to remain the preferred upgrading option for many refiners. This is due to significant advancements in this technology, which can be tailored to adapt to different feed qualities and targeted products, as well as its ability to achieve deep conversion of bottom-barrel streams to improve yields of light products, particularly petrochemical feedstocks.
On a regional level, the majority of hydrocracking capacity additions are expected in the Asia-Pacific, Middle East and Africa, totalling more than 3.9 mb/d, or around 75% of the global level. Latin America is projected to see close to 0.4 mb/d of hydrocracking capacity additions.

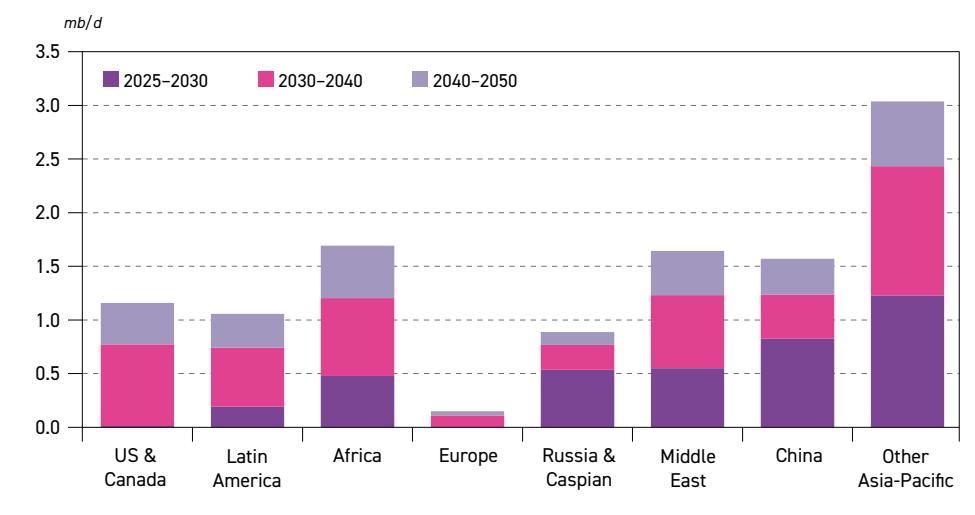
Figure 5.23 Conversion capacity requirements by region, 2025–2050
Source: OPEC.
Due to upgrades of existing refineries, Russia & Caspian and the US & Canada are likely to add around 0.5 mb/d and 0.3 mb/d of new hydrocracking capacity, respectively.
In the long term, around 2.8 mb/d of new FCC capacity will be added at the global level. FCC additions are primarily driven by gasoline demand, but also by propylene demand. This is why the majority of new FCC units are expected in developing regions, where gasoline demand is still likely to increase in the medium and long term. At the same time, gasoline demand in developed countries is expected to peak in the coming years and then start declining in the long term, which is why almost no FCC additions are expected in these regions.
Similar to the new hydrocracking capacities, developing regions will account for the majority of FCC capacity expansions in the period to 2050. The Asia-Pacific (incl. China) will add around 1.3 mb/d, followed by Africa and the Middle East with around 0.5 mb/d each. Noticeable additions are also expected in Latin America and the US & Canada of almost 0.2 mb/d each in the same period. Russia & Caspian is to see minor expansions to its FCC capacity, of slightly above 0.1 mb/d, while no FCC capacity expansions are expected in Europe
Finally, around 3.2 mb/d of coking/visbreaking (predominantly coking) capacity is required in the period to 2050. It should be noted that the modelling projections exclude oil sands and heavy Venezuelan or other upgraders, as they employ projected volumes for crude streams delivered to the market, i.e. downstream of upgraders and blending.
On the regional level, Other Asia-Pacific is set to dominate coking/visbreaking capacity expansions with almost 0.8 mb/d in the period between 2025 and 2050. Unlike other conversion technologies, significant capacity additions are set to come from the US & Canada and Latin America, with 0.7 mb/d and 0.5 mb/d, respectively. Africa's coking additions over the outlook period are estimated at around 0.4 mb/d. Finally, roughly the same level of coking/visbreaking capacity additions is expected in the Middle East, Russia & Caspian and China, close to 0.3 mb/d each.

Desulphurization units
Total desulphurization capacity requirements over the outlook period to 2050 are estimated at around 20.4 mb/d, slightly higher than the required distillation capacity in the same period. This reflects the rising sulphur content of the average barrel, the shift to higher-quality fuels, as well as increasingly stringent environmental regulations related mostly to sulphur content in transportation fuels, especially in developing countries.
Figure 5.24 shows desulphurization capacity requirements by region and period. On top of 3.1 mb/d of global desulphurization capacity expected to be added over the medium term, more than 11.2 mb/d of new capacity additions are projected from 2030 to 2040, followed by slower growth in the last decade of the outlook – with projected additions of 6 mb/d.
Figure 5.24
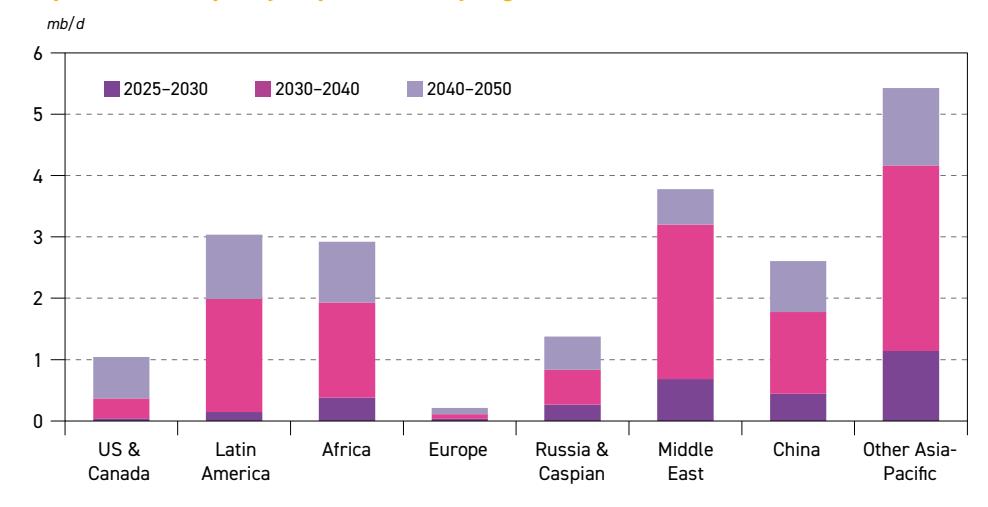
Desulphurization capacity requirements by region*, 2025–2050
* Projects and additions exclude naphtha desulphurization. Source: OPEC.
On a regional basis, Other Asia-Pacific is set to lead those additions by a substantial 5.4 mb/d throughout the forecast period, while China will see an expansion of 2.6 mb/d. High desulphurization additions are in line with rising crude imports from the Middle East in the long term (see Chapter 6).
In the Middle East, desulphurization capacity additions are estimated at almost 3.8 mb/d, in line with the high sulphur content of local crude supplies. Despite the fact that a large share of Africa's crude supply has a relatively low sulphur content, new desulphurization capacity is expected to be high on the continent, at around 2.9 mb/d. This reflects the ongoing efforts of many African countries to strengthen fuel sulphur standards and bring them closer to those in place in other regions, particularly developed countries.
Driven by ULS standards, as well as the relatively high sulphur content of a large share of domestic supplies, desulphurization additions in Latin America are set to be significant and estimated at 3 mb/d. They are mostly related to the modernization of exiting refineries. Russia & Caspian will add almost 1.4 mb/d to its existing desulphurization capacity. Finally, the US & Canada, along with Europe, are expected to see desulphurization additions of around
1 mb/d and 0.2 mb/d, respectively, mostly related to the modernization of existing capacities. The well-established desulphurization capacity in these regions, along with declining fuel demand in the long term, makes additional investments in this area unnecessary.
In terms of the product mix, desulphurization capacities related to middle distillates account for the majority of required additions in the period to 2050. At the global level, almost 14.3 mb/d of middle distillate (diesel and jet/kero) desulphurization capacity is expected to be added. Rising middle distillate demand throughout the outlook period and increasingly stringent regulations on sulphur levels in diesel (towards ULS standards) are the major drivers for this expansion. The majority of middle distillate desulphurization capacity additions are expected in the Asia-Pacific, the Middle East, Africa and Latin America.
Figure 5.25
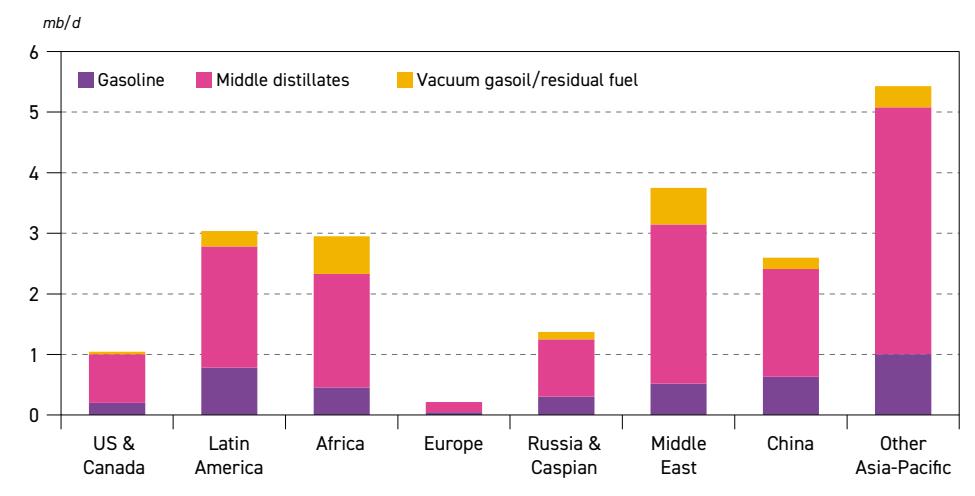
Desulphurization capacity requirements by product and region*, 2025–2050
* Projects and additions exclude naphtha desulphurization. Source: OPEC.
Gasoline hydrotreating additions (excluding naphtha) are estimated at almost 4 mb/d and are projected to materialize mostly in developing regions, where gasoline demand is still expected to grow. This includes the Asia-Pacific, the Middle East, Latin America and Africa.
Finally, vacuum gasoil/residual fuel desulphurization capacity is expected to grow by 2.2 mb/d in the long term. One of the drivers behind this trend is the rising demand for Very Low Sulphur Fuel Oil (VLSFO) due to the IMO Sulphur Rule. Another reason is the substantial hydrocracking capacity additions that often require feedstock pretreatment to remove impurities such as sulphur (see Table 5.6). The majority of additions are expected in the Middle East and the Asia-Pacific. Both regions predominantly process crude with a high sulphur content. Most of the remaining vacuum gasoil/residual fuel desulphurization capacity will be required in Africa and Latin America, with some minor amounts in other regions.
Octane units
Figure 5.26 shows octane capacity requirements by process and region between 2025 and 2050. Around 6.3 mb/d of octane units will be required at the global level in the long term.

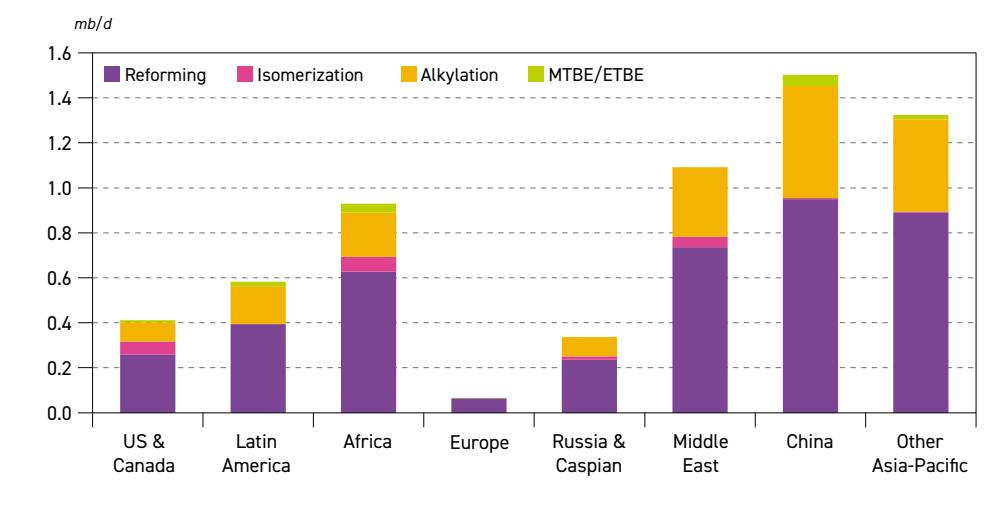
Figure 5.26 Octane capacity requirements by process and region, 2025–2050
Source: OPEC.
At the regional level, around 45% of these additions are projected for the Asia-Pacific, supported by rising gasoline demand. Octane unit growth is also significant in the Middle East at 1.1 mb/d, reflecting the region's effort to increase gasoline exports. Africa will add 1 mb/d over the long term, in line with growing distillation capacity. Traditional gasoline markets – the US & Canada and Russia & Caspian – are projected to add 0.4 mb/d and 0.3 mb/d of new octane units in the long term, respectively.
Octane unit additions are dominated by catalytic reforming, with almost 4.2 mb/d in the period to 2050. Catalytic reforming provides a high-octane number stream, which allows additional naphtha – including that from condensates – to be blended into the gasoline pool. Alkylation accounts for 1.8 mb/d. Global isomerization and MTBE/ETBE additions will likely be only minor, at around 0.2 mb/d and 0.1 mb/d, respectively. Some markets in Asia still use MTBE as a gasoline enhancer and are the major drivers of these additions.
5.6 Refined products supply and demand balances
In assessing the effects of capacity additions on specific product balances at regional and global levels, it is important to note that refiners always have some limited flexibility to optimize their product slates, depending on seasonal demand patterns, changing market circumstances, demand patterns, as well as economics and the availability of feedstock. This can be done by changing feedstock composition (crude slate) and by adjusting process unit operating modes. Table 5.7 presents an estimation of the cumulative potential incremental output of refined products resulting from existing projects by major product category in the period 2025–2030. It also corresponds with the potential incremental output shown in Section 5.3.
The cumulative potential refining capacity in the period to 2030 is estimated at around 5.6 mb/d at the global level. This assumes a maximum utilization rate of 90% for the units expected to come online in the medium term. In addition, it is important to point out that the balance is relative to the base year of 2024 and does not include assumed medium-term closures.

mb/d
| Gasoline/ Naphtha | Middle distillates | Fuel oil | Other products | Total | |
| 2025 | 0.3 | 0.4 | 0.0 | 0.4 | 1.1 |
| 2026 | 0.7 | 0.9 | –0.1 | 0.7 | 2.1 |
| 2027 | 0.9 | 1.3 | –0.2 | 0.9 | 2.9 |
| 2028 | 1.2 | 1.7 | –0.2 | 1.1 | 3.7 |
| 2029 | 1.4 | 2.0 | –0.2 | 1.4 | 4.7 |
| 2030 | 1.6 | 2.4 | –0.1 | 1.7 | 5.6 |
| Share (%) | 29 | 43 | –2 | 29 | 100 |
Table 5.7 Global cumulative potential for incremental product output*, 2025–2030
* Based on assumed 90% utilization rates for the new units. Source: OPEC.
More than 40% of new incremental production capacity is related to middle distillates (2.4 mb/d). Gasoline/naphtha incremental output potential is assessed at 1.6 mb/d in 2030, while the potential output of other products is at 1.7 mb/d. The potential output for fuel oil is at -0.1 mb/d compared to 2024. Once again, this reflects the expected strong secondary capacity additions linked to new, more complex projects, as well as to the ongoing modernization of some existing plants. These projects aim to yield more added-value products, such as gasoline, diesel and jet/kerosene, but also more petrochemical feedstocks like LPG and naphtha, by converting the bottom of the barrel into high-quality products.
Figure 5.27 presents the resulting balance by major product group and selected regions. It is calculated based on the difference between incremental potential output and projected demand.
Figure 5.27

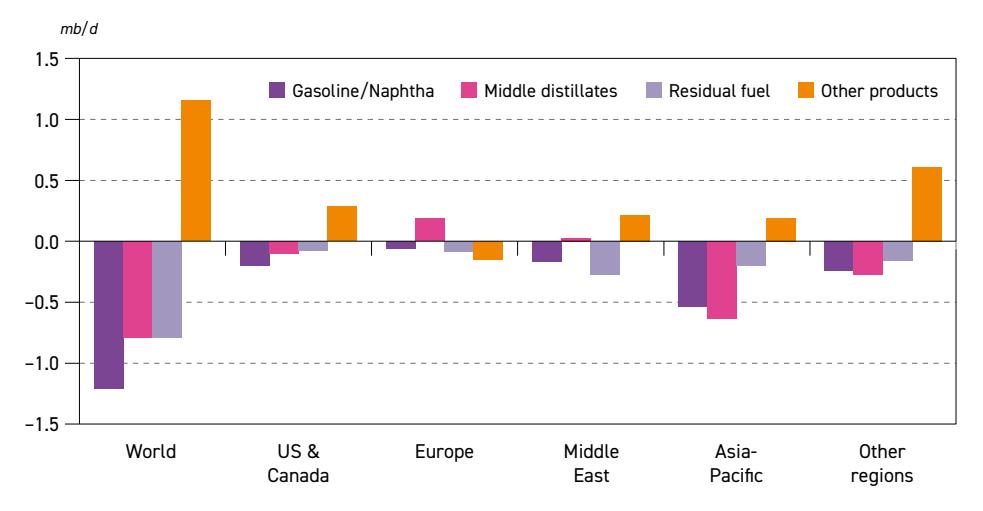
* Declining product demand in some regions contributes to the surplus. Source: OPEC.

It is important to note that demand for refinery products is calculated based on total product demand and subtracting any non-refinery streams, including biofuels, CTLs, GTLs and NGLs. It is also important to mention that surpluses can be the result of declining demand.
The global cumulative deficit is estimated at around 1.6 mb/d in 2030, with all major products showing deficits. Gasoline/naphtha lead the way with a range of 1.2 mb/d, while middle distillates and residual fuel are each in a range of 0.8 mb/d.
Regionally, the Asia-Pacific (incl. China) is expected to witness a deficit of around 1.2 mb/d by 2030. In this region, all major fuels show a deficit, especially middle distillates and gasoline/ naphtha. This may lead to higher throughputs in these regions relative to 2024, and/or increased product imports if projected demand is to be met. Minor deficits are also expected in the Middle East and other regions.
5.7 Investment requirements
This section provides details related to downstream investment requirements by region and by category, as shown in Figure 5.28. The investment requirements are grouped into three categories. The first category includes investment costs related to the announced refining projects in the medium term (Section 5.2.1). Investment costs in this category are based on available and reported information to the extent possible. The second category encompasses investment requirements for new refinery projects in the period 2030–2050. As these projects are generic, estimates are based on unit refining capacity costs at the regional level. The third and final category is related to necessary continuous replacement and maintenance CAPEX throughout the entire outlook period.
For the first category, a total investment cost of $225 billion is estimated. The largest share of medium-term CAPEX is located in developing regions, namely the Asia-Pacific, Middle East and Africa, in line with refining capacity addition trends. Altogether, these regions combined
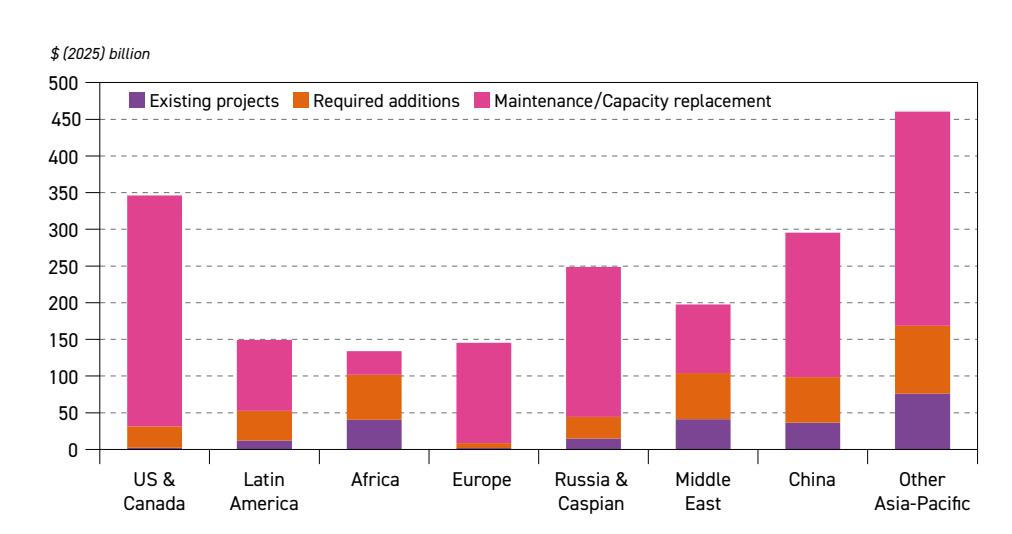
Figure 5.28 Refinery investments by region, 2025–2050

Source: OPEC.
are expected to invest around $194 billion in the medium term. Other Asia-Pacific is set to lead the way, with $76 billion, followed by the Middle East and Africa with more than $40 billion each. In China, the projected medium-term investment amount is above $36 billion, while investments in Russia & Caspian are estimated at almost $15 billion. Elsewhere, modest investments are estimated for Latin America at around $12 billion in the medium term, while other regions are expected to see only minor investments during this period.
In the period after 2030, global investment requirements for required new refinery projects are calculated at $385 billion. Similar to the medium term, the largest share is expected in the Asia-Pacific (including China), the Middle East and Africa. Investment requirements in Other Asia-Pacific are projected at above $92 billion in this period. Refining investments beyond 2030 in China, the Middle East and Africa are estimated at almost the same level, just above $60 billion each. In Latin America, required downstream investments are projected at around $40 billion.
In the US & Canada, post-2030 investments are estimated at close to $30 billion. In this region, secondary capacity expansions support downstream investments. This partly relates to a gradual change in refinery feedstock, with the average crude barrel becoming heavier due to potential additional volumes from Canada, Latin America and the Middle East. In Russia & Caspian, investment volumes are also close to $30 billion, most of which will be dedicated to the expansion of secondary capacity. In Europe, downstream-related investments are estimated at below $7 billion in the same period.
Finally, maintenance requirements and the necessary continuous 'capital replacement' of installed refining capacity are estimated at close to $1.4 trillion for the period 2025–2050. The assessment of this category assumes that the annual capital needed for capacity maintenance and replacement is around 2% of the cost of the installed base capacity. The leading region in terms of maintenance investments is the US & Canada at almost $315 billion, followed by Other Asia-Pacific at around $292 billion. Russia & Caspian and China also have relatively significant replacement costs of around $205 billion and $197 billion, respectively. Investments required for maintenance and continuous 'capital replacement' in these regions reflect the size of the installed base refining capacity.
In summary, this brings the total downstream investment requirements to roughly $2 trillion over the entire outlook period.
5.8 Downstream industry implications
The global refining and petrochemical industries face several major uncertainties in both the medium and long terms. These uncertainties reflect evolving demand trends and related market challenges, technology developments, policies and sustainability challenges.
As discussed in this chapter, most of the new long-term refining capacity is required in the Asia-Pacific, Africa and the Middle East, following regional oil demand trends. Total required refinery capacity additions are estimated at 19.5 mb/d by 2050. In addition, it is assumed that to meet the demand growth and possibly reduce refined product imports, developing regions need to modernize their existing refinery fleet, especially in Latin America and Africa. This requires significant investments, financing and project implementation, which may represent a challenge for some countries in these regions. At the same time, energy policy pressure and a related projected oil demand drop in most OECD regions could potentially lead to significant refinery closures, or their repurposing in the long term.

However, if developing countries are unable to successfully increase and modernize their refining capacity, this could increase pressure on the refining sector, potentially leading to supply shortages of refined products, and, consequently, adversely affecting economic activity. Another possible scenario is that the expected wave of closures in developed regions could be delayed or scaled back, with facilities maintaining or even increasing product exports to meet growing demand in developing regions and keep their utilization rates at high levels. While this may ensure short-term supply security, this could heighten import reliance and make these countries more vulnerable to disruptions in oil product markets, threatening energy security and hindering economic development. Ensuring timely investment in new facilities remains a cornerstone of energy security.
Following recent announcements of closure, several companies (especially in Europe and the US) emphasized the intention and possibility of adopting new business models and converting either some of their capacities to bio-refineries or the co-processing of bio-based feedstocks, focusing on biodiesel or sustainable aviation fuel (SAF). In addition, there were also announcements of conversions to hydrogen production facilities, where either green hydrogen via electrolysis or blue hydrogen with CCUS could be produced, enabling the production of synthetic fuels. Nevertheless, recent news indicates that due to high production costs and uncertain energy policies in some countries, some of these conversions could be delayed or even cancelled. Furthermore, some refineries are set to be converted to terminals. Finally, instead of outright closure, companies may merge or consolidate operations to maximize efficiency and enhance flexibility in the refining network.
Some potential strategies in the plastics sector – including recycling, the conversion of plastics to fuels and the production of bioplastics – are being explored, which would require the adoption and implementation of new technologies and infrastructure at scale. Consequently, given the required time and investments to scale up new technologies, traditional refining will remain a dominant part of the downstream business in developed regions too.
Refiners will also need to adapt to new market dynamics. Chapter 3 discusses the structure of future oil demand and shows that the projected increase in consumption relates mostly to high-quality products with gradually more stringent specifications, especially regarding sulphur. The largest increases are projected for ethane/naphtha and middle distillates over the outlook period, along with a modest increase for gasoline. Concurrently, the growth in demand for petrochemical products in the recent past has provided strong support for the sector. Demand for petrochemical products is set to continue to grow, underpinning demand for ethane/LPG and naphtha (see Section 5.5). Consequently, most new projects, as in previous years, are likely to have high levels of complexity, including petrochemical integration. New technologies, such as crude-tochemicals, could also contribute to altering the output of refineries to align with the longterm composition of oil demand.
In addition, after the medium term, the global crude slate is poised to become heavier and more sulphurous. This is due to rising heavy supply from Canada, Latin America and the Middle East, as well as declining light supply in the US. This will translate into significant requirements for additional secondary capacity, especially upgrading and desulphurization, not only for new refineries, but also for existing plants.
Decarbonization is one of the top priorities for both the refining and petrochemical industries. Despite the difficulty of this task, if operators of these sectors manage to

adequately adopt a mixed approach – including technical creativity, advancing process optimization and digitalization, improving energy efficiency, electrification, integrating CCUS and renewables, as well as using natural sinks – they can take a leading role in decarbonization while simultaneously complying with international environmental regulations. Some countries, like China, have introduced energy efficiency targets for their refineries, which could possibly lead to a restructuring of the country's refining sector. The German government has allocated up to €2.8 billion to subsidize 15 industrial companies, including chemical operators, aiming to decarbonize their production processes under the first "climate protection contracts".
Industry initiatives, while essential, may not be enough to significantly reduce greenhouse gas emissions in the refining and petrochemical sectors. Government intervention is crucial to establish policies and regulations that encourage and facilitate these actions.
Oil movements
Key takeaways
- • Global interregional oil trade (crude oil, condensate and refined products) was estimated at almost 55 mb/d in 2024. By 2030, the trade is projected to increase significantly to above 61 mb/d, with a gradual increase thereafter to 68.5 mb/d in 2050.
- • Interregional crude and condensate trade stood at around 36.8 mb/d in 2024 and by 2030 is expected to increase to 41.7 mb/d, supported by rising oil demand in major consuming regions. After 2030, growth is expected to see a slowdown and reach levels around 47.3 mb/d by 2050.
- • Total oil product trade was assessed at 18 mb/d in 2024 and is expected to rise above 21 mb/d in 2050. This is in line with rising demand in the Asia-Pacific and growing exports from the US & Canada and the Middle East.
- • Crude and condensate exports from the Middle East are expected to increase from 17.4 mb/d in 2024 to 20.2 mb/d in 2030. In the long term, exports are projected to rise further to 28.2 mb/d by 2050.
- • Middle East crude and condensate exports are likely to increase to all major importing regions. However, more than 80% of Middle Eastern exports are set to be shipped to the Asia-Pacific in 2050, increasing from 15.2 mb/d in 2024 to 23.5 mb/d. The trade link between the Middle East and the Asia-Pacific will represent 50% of the global interregional crude and condensate trade in 2050.
- • Crude and condensate exports from Latin America are likely to increase strongly from 4.4 mb/d in 2024 to 6.7 mb/d in 2050, due to the region's strong oil supply growth. The majority of crude and condensate flows from Latin America are destined for the US & Canada and the Asia-Pacific.
- • Crude and condensate exports from Africa are projected to remain at around 5.2 mb/d between 2024 and 2035. In the period after, a gradual decline to around 4.2 mb/d in 2050 is expected, mostly due to higher domestic crude use in Africa.
- • Total crude and condensate exports from the US & Canada are expected to increase from 4.1 mb/d in 2024 to 5.3 mb/d in 2030. Thereafter, however, exports are set to decline gradually to 3.3 mb/d by 2050, due to declining supply in this region. Most of the crude from this region is projected to flow to the Asia-Pacific.
- • In line with the projected oil demand decline in Europe and falling local crude supply, total crude and condensate imports for this region are estimated to drop steadily from 9.1 mb/d in 2024 to 7.8 mb/d in 2050.
- • Total crude and condensate imports to the Asia-Pacific are projected to increase from 24.2 mb/d in 2024 to 34.1 mb/d in 2050, on the back of rising demand. Declining local supply in the Asia-Pacific is also set to contribute to this trend.

Oil trade (crude oil, condensate and refined products) flows are a crucial part of the global oil and product markets and enable the integration of regional markets into the overall global system. Trade flows help balance the market and alleviate supply shortages and surpluses at regional levels. This integration increases producer and consumer flexibility and reduces possible demand and supply shocks.
This chapter examines the main trends related to the trade movements of crude oil and condensates, as well as intermediate and refined products, between major downstream regions. Projections are based on the assumptions and modelling results discussed throughout this Outlook, including oil demand (Chapter 3), supply (Chapter 4) and refining (Chapter 5). Projections on oil trade movements also include assumptions regarding future logistics developments.
6.1 Logistics developments
The development of logistics infrastructure is crucial for maintaining oil trade and exporting capacity, as well as for the availability of crude oil and products on international markets. For this reason, significant interregional logistical developments can have a major impact on oil flows and are considered one of the key inputs in the modelling of global trade movements.
Both crude oil and product movements are impacted and influenced by trade infrastructure. Developments in land-based infrastructure – mainly pipelines and rail systems – affect both short- and long-distance inland and marine movements. International market access and export flexibility are especially impacted by infrastructure development, including longdistance pipelines, coastal terminals and berthing capacity for shipments of crude oil, refined products and other liquid hydrocarbons.
Certain regions require continuous attention because of their potential to alter interregional crude trade. This applies especially to China, the Middle East, Russia & Caspian, along with the US & Canada.
The US & Canada has entered a period of modest crude oil production growth. This, coupled with the completion of several major infrastructure projects in recent years, has seen the region enter a period of sufficient takeaway and export capacity that can accommodate future growth. The biggest threat to takeaway capacity has stemmed from public resistance and political opposition, which occasionally leads to legal challenges against already operating capacity and new projects. With the new US Administration, these challenges could be somewhat reduced.
US
In the US, the age of large-scale infrastructure projects is approaching its end. The Permian and Eagle Ford already have around 8 mb/d of pipeline takeaway capacity to the US Gulf Coast, which should be sufficient to meet production from these two regions. This is why pipeline operators are increasingly focusing on efficiency, regulatory adaptation and optimization of midstream infrastructure.
In addition, the Sea Port Oil Terminal in Texas was approved by the Biden Administration and was expected to add export capacity of more than 2 mb/d. In early 2025, however, the
operator, Enterprise Product Partners, was sceptical about further progress on the project due to a lack of customer interest. Previously, the project was scheduled to come online in early 2027, but now its progress remains uncertain.
Furthermore, the 750 tb/d Dakota Access pipeline out of the Bakken region is still under environmental review, although it should be finalized this year. The pipeline is allowed to continue its operation until the end of the review. Importantly, the Bakken region has enough rail capacity – estimated at 1mb/d – to transport Bakken production and mitigate any potential pipeline problems, particularly if Dakota Access is shut down.
Finally, US President Trump announced that he would support the cancelled Keystone XL pipeline. The project was halted back in 2021, when the permit for the US pipeline was revoked by the previous administration. The project proposed to construct an 830 tb/d pipeline with estimated costs of $9 billion. However, given the current tensions between the US and Canada, it is uncertain whether this project will be revived.
Canada
After numerous delays and cost overruns, the Trans Mountain Pipeline Expansion in Canada was officially commissioned in early May 2024. The project has added 590 tb/d of capacity to the existing pipeline, increasing its total capacity to 890 tb/d. This enables Canada to export crude from the port of Vancouver to the US West Coast, as well as to international markets, notably the Asia-Pacific. Significant volumes have already been shipped to the Asia-Pacific, especially China. Exports to China reached levels of around 270 tb/d in October 2024. Further enhancements of the Trans Mountain pipeline would be possible, and this could increase efficiency and, consequently, the pipeline's capacity. However, further details were not available at the time of writing this report.
Current export capacity out of Canada appears sufficient; however, further supply growth may require further pipeline capacity expansions, especially if less efficient transport by rail is to be avoided. There is the possibility for further enhancement of the existing Keystone and Mainline pipelines, which could boost takeaway capacity up to 300 tb/d over the medium term.
Most of Canadian oil production has traditionally been exported to the US via several pipelines and railways. However, amid rising tensions between Canada and the US, many market participants in Canada have been calling for a diversification of trade routes, which would reduce reliance on the US and help Canadian producers to diversify their exports. The Trans Mountain pipeline is currently the main route that allows exports to international oil markets. However, the pipeline's capacity is only a fraction of total Canadian export volumes. Some energy executives in Canada have been proposing to build a new west-to-east pipeline, which would connect production sites in Alberta with the Canadian East Coast and allow seaborne exports in the future. However, no further details on these plans were available at the time of writing.
Other regions
In Argentina, state-owned oil and gas company YPF is advancing the development of a new oil pipeline that would help bring crude supplies from Vaca Muerta Sur to an export terminal in the Atlantic in the Rio Negro province. The pipeline also attracted the interest of the

international oil companies, Shell and Chevron, which have secured project stakes. Once fully operational in 2027, the pipeline would have a capacity of 550 tb/d. Further expansion to 700 tb/d after 2028 would be possible, if required. In addition, the pipeline operator Oleoductos del Valle is increasing the capacity of the existing Oldelval pipeline from around 225 tb/d to 540 tb/d in 2025. Both projects should help increase export volumes from Argentina to international oil markets.
In Uganda, progress has been made on the East African Crude Oil Pipeline (EACOP), which would link Uganda and the Tanzanian coast, with a total length of almost 1,500 km. The pipeline should have a capacity of 246 tb/d and the project has already secured the first tranche of external financing from the African Export-Import Bank (Afreximbank). At the end of 2024, 50% of the project was reportedly completed, and commissioning could follow as early as 2026.
6.2 Crude oil, condensate and refined product movements
The integrated global midstream and downstream sectors rely on the ability to move crude oil, condensates, refined products and various intermediate streams within, and between, countries and regions. This is generally driven by economics, long-term interests/contracts, and in some cases, geopolitics. Midstream infrastructure (pipelines and shipping capacities) enables market participants to move large amounts of oil liquids between almost any two regions of the world, over short and long distances, and via a variety of transport modes.
These interregional movements enable adequate physical supply, as well as trade and competition between different suppliers, as they respond to price signals between regions. The ability to move crude oil and products also helps to avoid short-term shortages of fuel in specific regions at any given time. For example, the market's ability to respond to price signals and swiftly deploy tankers or other logistics can help offset shortages caused by weather-related issues, as has been seen in the past.
Various factors affect the direction and volume of crude and condensate, as well as product trade movements. These involve: oil demand trends, including seasonal changes; the production and quality of crude and non-crude streams; product quality specifications and related changes; refining sector availability and configurations; potential trade barriers or policy-driven incentives; the capacity and economics of existing transport infrastructure, such as ports, tankers, pipelines and railways; ownership interests; term contracts; crude and product price levels and differentials; freight rates; and, at times, geopolitics. In fact, there is never only one factor influencing petroleum flows, rather a combination of several at the same time.
The downstream sector and its development are key elements in this regard. Based on the economics of oil movements and refining, there is a general preference to locate refining capacity in consuming regions due to lower transport costs for crude oil compared with oil products.
Strategic reasons, including those related to the security of supply, also play a role. Recent trends in the downstream sector confirm this, as most refining capacity additions in recent years have materialized in developing regions with strong oil demand growth, led by the Asia-Pacific. The refining outlook (Chapter 5) shows a continuation of this trend in the long term. As a result, crude and condensates account for most trade, especially over long distances.

However, refining hubs in developed countries with highly complex plants, such as in the US, are competing increasingly in the international product market. This is in line with slower domestic demand growth and the availability of feedstock at competitive prices.
Furthermore, for producing and consuming countries alike, there is an emphasis on securing the refined product supply through domestic refining rather than imports, regardless of economic factors. For producing countries, there is the additional consideration of seeking to increase domestic refining capacity to cover domestic demand, as well as benefit from the export of value-added products beyond crude oil. Benefits for the local economy, including labour markets, also serve as a motivation for building refining capacity.
Given the considerations highlighted, oil movements are not always the most economical or efficient in terms of minimizing overall global costs. In contrast, movements generated in the models used for this Outlook are based on an optimization procedure that seeks to minimize global costs across the entire refining/transport supply system, in accordance with existing and additional refining capacity, logistical options and costs.
Generally, few constraints are applied to crude oil and product movements in the modelling approach, especially over the long term, since it is impossible to predict the ownership interests and policies of individual companies and countries. The differences between shortterm market circumstances – such as constraints from ownership interests and term contracts – and a longer-term modelling approach, which applies fewer movement restrictions and aims to minimize global costs, mean that model-projected oil movements cannot fully capture short-term factors. As a result, the projected trade patterns may not directly reflect or extend from those observed today.
Nevertheless, the model-based results presented in this section provide a useful indication of future crude oil movement trends, which necessarily function to resolve regional supply and demand imbalances for both crude and products. Of course, these projections are dependent on several assumptions used in this Outlook, which, if altered, could materially affect projected movements.
Key elements in the model-based projections are the volumes and qualities of both crudes produced and products consumed by region, and how these change over time. Another element is the location and capability of refining capacity. Over the longer term, the relative economics of building new refinery capacity in different regions and the ability of existing refineries to export and compete against imports affect the trade patterns of crude and refined products. There is also an interplay between freight and refining costs (capital and operating costs). Broadly speaking, higher freight rates tend to curb interregional trade and encourage more refining investment, while lower freight rates tend to enable greater trade and competition between regions and provide more opportunity to export products for regions with spare refining capacity.
This approach alone, however, is not well suited for modelling and estimating the impact of geopolitics and trade policies on oil trade. Recent years have witnessed significant shifts in oil trade patterns, which were mostly the result of geopolitical tensions and not based on trade economics.
The conflict in Eastern Europe has readjusted global oil trade flows since early 2022. New trade links have been established, while some old ones have been discontinued. The EU,

UK and US have introduced an oil embargo on Russian oil imports, becoming effective in late 2022, with some exceptions related to a number of Central European countries. This has led to a strong decline in Russian crude exports to the EU and a rerouting of exports to other regions, including India and China. The underlying assumption in the Reference Case is that the EU embargo on Russian crude will have lasting effects on the European crude import mix.
In recent months, the possibility of a peace agreement related to the conflict in Eastern Europe has emerged. At the time of writing, it is still too early to estimate the consequences on Russian oil exports. Some market participants suggest that European countries could re-establish trade connections with Russia. However, even if some additional Russian oil volumes start flowing to the EU, it is unlikely that pre-conflict trade volumes would be reached in the foreseeable future.
Elsewhere, the US has recently imposed tariffs on the imports of goods from most countries, which was soon followed by retaliation measures from some countries, including China. At the same time, energy and oil imports into the US have remained largely unaffected. However, regulations from other countries, which import US crude oil and oil products, are still unclear. The resulting trade conflict between the US and other large countries has resulted in a high degree of uncertainty for global oil trade. For instance, market participants in Canada have called for a diversification of crude oil exports and a reduction in their reliance on the US, which could have long-term consequences.
It is still too early to estimate how the long-term global oil trade will be affected by the aforementioned trade policies. It is certain, however, that due to the inherent interconnectedness of global oil trade, any major shift in one region consequently leads to a shift elsewhere. This could lead to suboptimal trade patterns, with possible consequences on the downstream market too.
Figure 6.1 illustrates global interregional trade for crude oil, condensates and products in the period from 2024 to 2050. Only trade between major regions is shown, which means that any intra-trade movements are not included.
Global trade in 2024 was estimated at almost 55 mb/d. By 2030, global interregional oil trade is projected to see a significant increase to above 61 mb/d. This is the result of increasing oil demand, especially in developing regions, led by the Asia-Pacific. The trend is expected to continue after 2030, with total oil trade reaching 66 mb/d in 2035 and 67.5 mb/d in 2040.
In the last decade of the outlook period, total oil trade growth is set to experience a slowdown and increase by only 1 mb/d to 68.5 mb/d in 2050. This is due to a drop in global oil demand growth, as well as increased domestic use of crude in some developing countries (e.g. Africa), which reduces export volumes.
Interregional crude and condensate trade was assessed at 36.8 mb/d in 2024, marginally higher than in 2023. Due to expected growth in oil demand and rising refining capacity in some importing regions (mostly developing countries), global crude and condensate trade is expected to climb to 41.7 mb/d in 2030. Beyond 2030, growth will continue to increase, albeit at a slower pace. Global interregional crude and condensate trade is projected to rise to around 46.5 mb/d in 2040 and further to 47.3 mb/d in 2050. This reflects growing oil demand in the Asia-Pacific, which more than offsets lower importing needs in Europe. Furthermore,
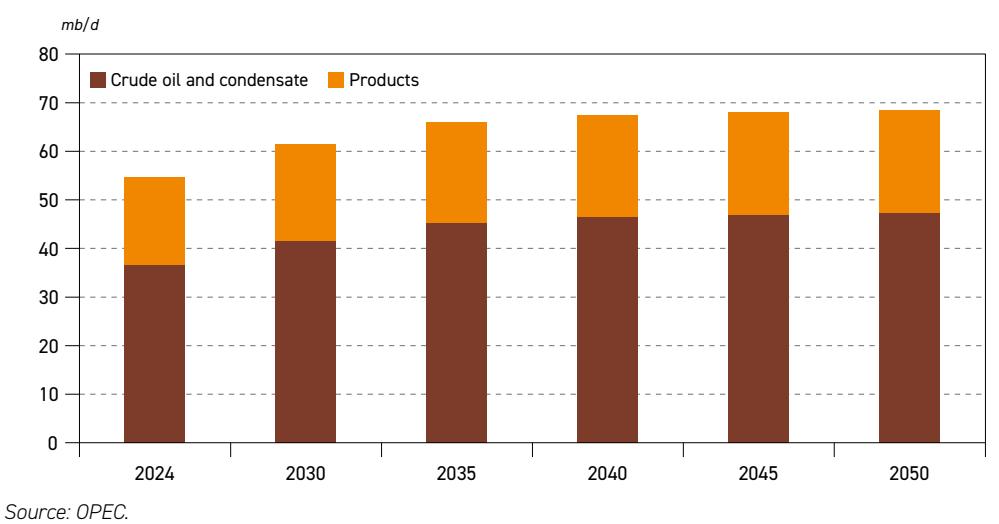
Figure 6.1 Interregional crude oil, condensate and products exports, 2024–2050
the higher domestic use of crude oil in some crude oil-exporting regions limits exports to the global markets. This especially relates to Latin America and Africa.
Interregional crude oil and condensate trade accounted for around 67% of the total oil trade in 2024. This share is expected to increase gradually in the long term and reach levels of almost 70% in 2050.
Interregional oil product trade is set to increase marginally from 18 mb/d in 2024 to almost 20 mb/d in 2030, as demand is set to rise faster than refining capacity expansion. In the longer term, global product trade is expected to increase slowly, reaching levels slightly above 21 mb/d in 2050. This is set to be driven by rising exports from the Middle East, the US & Canada and higher imports to the Asia-Pacific. This is in line with assumptions related to long-term refining capacity expansions that are presented in Chapter 5, which occur mostly in developing countries. Of note, slower-than-expected refining capacity expansion would necessarily result in higher product trade volumes in the long term.
Crude oil and condensate movements
This section discusses global crude and condensate supply developments by downstream regions. This is fully in line with projections provided in Chapter 4. Crude and condensate supply developments explain changes in long-term trade movements. The latter is discussed later in this section, with a focus on the main exporting and main importing regions.
The analysis below relates only to crude and condensates, which includes oil sands and synthetic crudes, but excludes any other liquids, such as biofuels, synthetic fuels, CTLs, GTLs and NGLs.
In the 2024–2030 period, global crude and condensate supply is expected to increase by more than 7.5 mb/d. Almost half of this growth is set to come from the Middle East, while the rest is accounted for by Latin America, the US & Canada and Africa.

6
In the period 2030–2050, global crude and condensate supply is expected to rise by a further 5.2 mb/d. This growth is a combination of strong supply additions in the Middle East and further growth in Latin America and Africa. This growth more than offsets declines in several other regions, such as the US & Canada, the Asia-Pacific and Europe.
The changing regional supply patterns in the medium and long term are expected to gradually alter the quality of the average barrel, as shown in Figure 6.2. Average API gravity was estimated at around 33.6° API in 2024, rising in recent years mostly due to additional lightsweet barrels from the US. However, average API gravity is expected to decline gradually in the medium and long term. Between 2024 and 2040, it is projected to decline slowly and reach
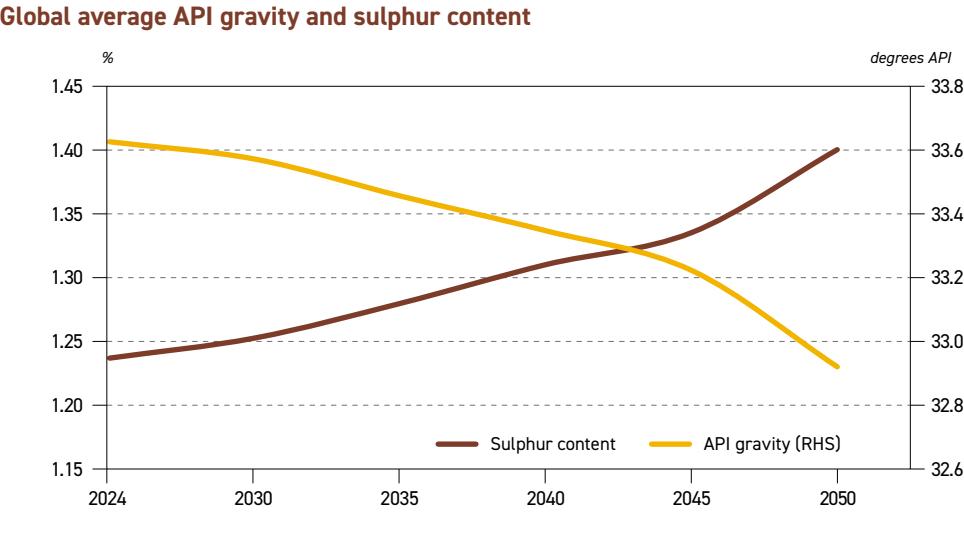
Figure 6.2
Source: OPEC.
33.3° API. This is in line with a slow increase in US tight oil supply in the period to 2030, which is overshadowed by much more significant increments in the Middle East, as well as Latin America and Africa, which supply medium and/or heavy grades. A stronger drop is expected thereafter, due to continuous medium and heavy supply growth, mostly in the Middle East, but also in Latin America and Canada. Consequently, the average API gravity is likely to drop to around 32.9° API by 2050.
At the same time, the average sulphur content is expected to remain relatively stable at around 1.25% between 2024 and 2030. It is then expected to increase gradually thereafter, reaching 1.4% by 2050. This underlines the rising share of high sulphur supplies, predominantly from the Middle East, Latin America and Canada.
In Figure 6.3, global crude oil and condensate exports by major exporting regions are shown. As per the definition, only movements between these major regions are considered, while intra-trade movements are not taken into account. Total crude oil and condensate trade volumes in 2024 were estimated at around 36.8 mb/d. This is only marginally above levels observed in 2023. Global interregional crude and condensate trade are expected to increase to 41.7 mb/d by 2030, supported by rising oil demand.
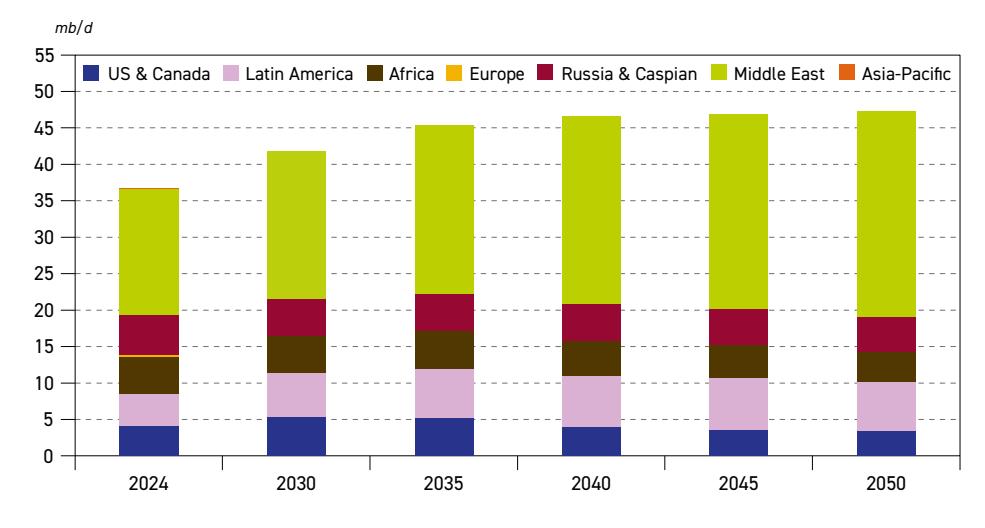
Figure 6.3 Global crude and condensate exports by origin*, 2024–2050
* Only trade between major regions is considered, intratrade is excluded. Source: OPEC.
The growth in trade is expected to increase between 2030 and 2050, albeit with a significant slowdown. In 2050, estimated global crude and condensate trade is expected to reach around 47.3 mb/d. The main driver is rising oil demand and declining local oil supply in the Asia-Pacific (including China). At the same time, rising demand and refinery throughputs in regions such as Africa and Latin America are expected to limit exports of crude and condensate from these regions to international markets. Overall, the crude and condensate change for the entire outlook period is calculated at around 10.5 mb/d.
In terms of regional details, the only region that shows a continuous increase in crude and condensate exports is the Middle East. Total export volumes are estimated at around 17.4 mb/d in 2024. They are then expected to increase to 20.2 mb/d by 2030 and to 28.2 mb/d in 2050. The overall export increment of almost 11 mb/d over the outlook period is supported by the region's projected supply growth.
Latin America also shows significant growth in exports, underpinned by rising supply in several of the region's countries. Latin American crude and condensate exports are projected to rise from 4.4 mb/d in 2024 to 7.1 mb/d in 2045. Only in the last five years of the outlook are exports projected to decline and reach 6.7 mb/d in 2050, mostly due to the higher domestic use of oil. Latin America is poised to become the second largest exporting region by 2030, overtaking Africa and Russia & Caspian.
Exports from the US & Canada stood at around 4.1 mb/d in 2024, underpinned by continuous supply growth and new export routes for Canadian crude to international markets. Exports from the US & Canada are projected to continue increasing in the medium term and reach around 5.3 mb/d in 2030. Afterwards, exports are expected to decline gradually, in line with declining US supply. In 2050, total exports from the US & Canada are projected at 3.3 mb/d.

African crude and condensate exports were assessed at 5.2 mb/d in 2024. In the period to 2035, total exports from this region are likely to remain stable. This is the result of rising African supply, which is offset by higher domestic use in view of higher refinery throughputs. In the longer term, crude and condensate exports from Africa are set to decline due to a slowdown in supply growth and the continuous rise in domestic crude use. In 2050, crude and condensate exports from Africa are estimated at 4.2 mb/d. An overall decline in exports from Africa are calculated at 0.9 mb/d between 2024 and 2050.
Crude and condensate exports from Russia & Caspian are projected to decline gradually from 5.4 mb/d in 2024 to 4.8 mb/d in 2050. The projected oil supply decline in this region is the major reason for this trend.
Interregional crude and condensate exports are heavily dominated by the Middle East, with its share standing at 47% in 2024 (Figure 6.4). In line with rising exports in the Middle East, in combination with falling exports from several other regions (e.g. Africa, US & Canada and Russia & Caspian) in the long term, the share of the Middle East will increase to around 59.5% in 2050. At the same time, due to growing demand and declining local crude output, the share of Asia-Pacific in the global interregional crude and condensate trade increases from almost 66% in 2024 to 72% in 2050.
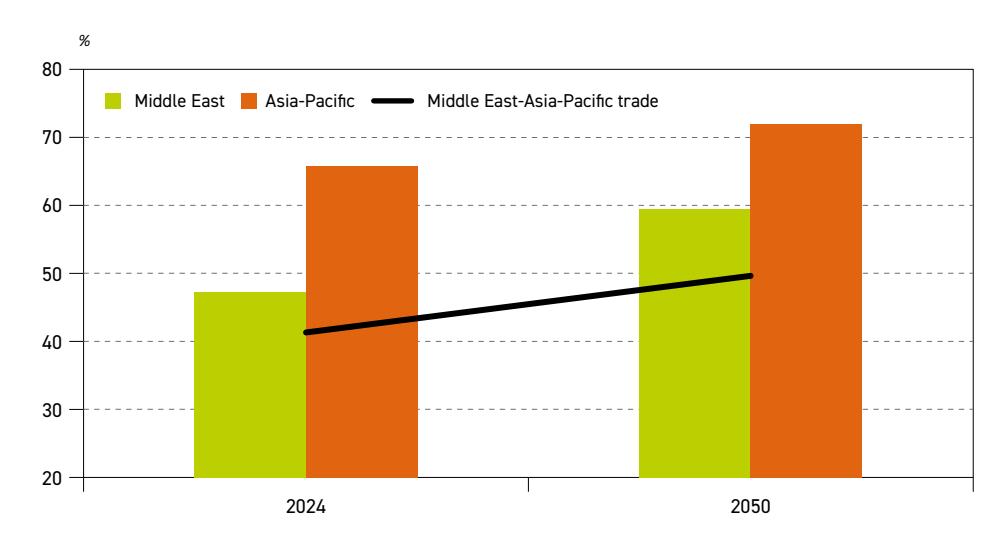
Figure 6.4

Source: OPEC.
The trade between the Middle East and the Asia-Pacific alone accounted for just above 41% of total trade in 2024. In the period to 2050, the trade link between the two regions is set to become even more important, with its share in global interregional crude and condensate trade expected to increase to almost 50% by 2050.
Figure 6.5 shows crude and condensate exports from the Middle East. Estimated at around 17.4 mb/d in 2024, total crude and condensate exports from the Middle East are projected to
increase strongly in the medium term, reaching 20.2 mb/d in 2030. In the longer term, the growth in exports is likely to experience a slowdown, but remain significant, reaching almost 28.2 mb/d by 2050.
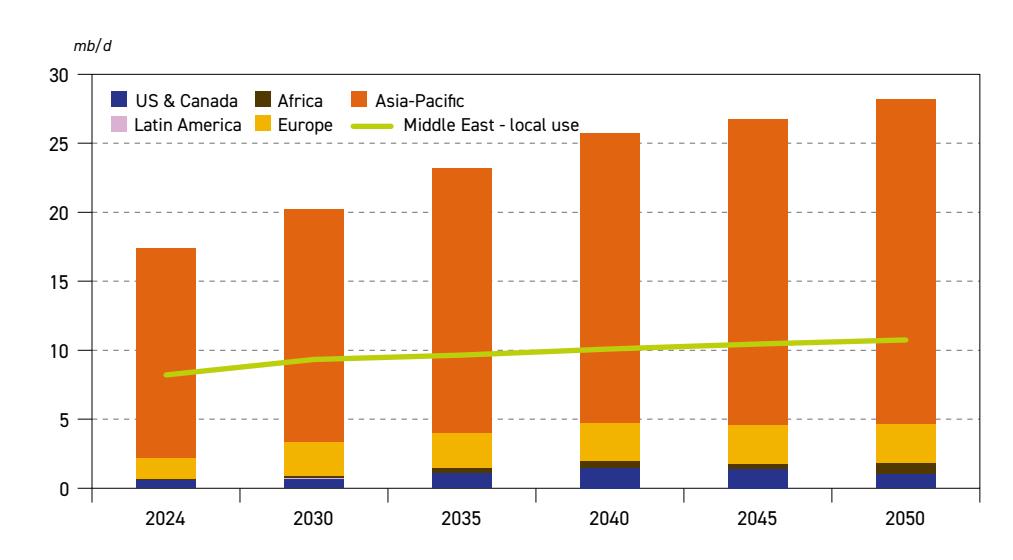
Figure 6.5 Crude and condensate exports from Middle East by major destination (and local use), 2024–2050
Source: OPEC.
Exports to the Asia-Pacific are projected to increase from 15.2 mb/d in 2024 to 16.9 mb/d in the medium term. Flows to the Asia-Pacific are set to continue rising in the long term, in line with increasing demand, and reach levels of 23.5 mb/d by 2050. The Asia-Pacific is by far the most important destination for Middle Eastern barrels, accounting for more than 80% of the total export volumes throughout the outlook period.
Nevertheless, the Middle East remains an important supplier to other regions in the outlook period too. This especially relates to Europe, with export volumes rising from 1.5 mb/d in 2024 to 2.4 mb/d in 2030, and further to around 2.8 mb/d in 2050. The quality of Middle Eastern crudes fit European demand well, which is the main reason for this increase.
Exports to the US & Canada are also likely to increase from around 0.6 mb/d in 2024 to 1.5 mb/d in 2040. Similar to Europe, the quality of Middle Eastern crudes is the main driver of this increase. In the last decade of the outlook, flows from the Middle East to the US & Canada are likely to decline and reach around 1.1 mb/d by 2050, partly due to declining US demand.
Minor exports to Africa are also expected, increasing from around 0.1 mb/d in 2024 to 0.7 mb/d by 2050. The main driver is the increase in African oil demand, which is set to push long-term refinery runs higher in this region. Finally, local crude use in the Middle East is projected to increase from around 8.2 mb/d in 2024 to 10.8 mb/d in 2050. This is in line with

rising refining capacity and refinery throughputs in the Middle East, driven by increasing local demand and rising product exports.
Crude and condensate exports from Latin America in the long term are shown in Figure 6.6. Exports were estimated at around 4.4 mb/d in 2024 and are likely to increase strongly to 6 mb/d in 2030 and further to 7.1 mb/d in 2045, supported by strong oil supply growth in this region. A modest decline is expected at the end of the outlook period with total exports declining to around 6.7 mb/d in 2050. This reflects a slowdown in oil supply growth and rising domestic use in this region.
Exports to the US & Canada are projected to increase from 1.3 mb/d in 2024 to around 2.8 mb/d in 2040. A minor decline to 2.6 mb/d by 2050 is then expected. The quality of barrels from Latin America (medium and heavy) fits well with the configuration of US refiners, which, in combination with the proximity of the two regions, are the major drivers for the increase in trade flows. Latin American shipments to Europe are expected to decline gradually from 1.3 mb/d in 2024 to 0.6 mb/d in 2050, due to declining demand in Europe, as well as more competition from Africa and the Middle East.
In 2024, the main destination for Latin American barrels was already the Asia-Pacific, with exports of around 1.7 mb/d. These volumes are expected to rise considerably, reaching 3.7 mb/d in 2045, followed by a modest decline to 3.5 mb/d by 2050. The driver is the rising demand and declining local supply in the Asia-Pacific, as well as declining exports to Europe in the long term.
The local use of crude in Latin America is expected to increase strongly, in line with rising refinery throughputs. It is projected to increase from 4.3 mb/d in 2024 to almost 6.5 mb/d in
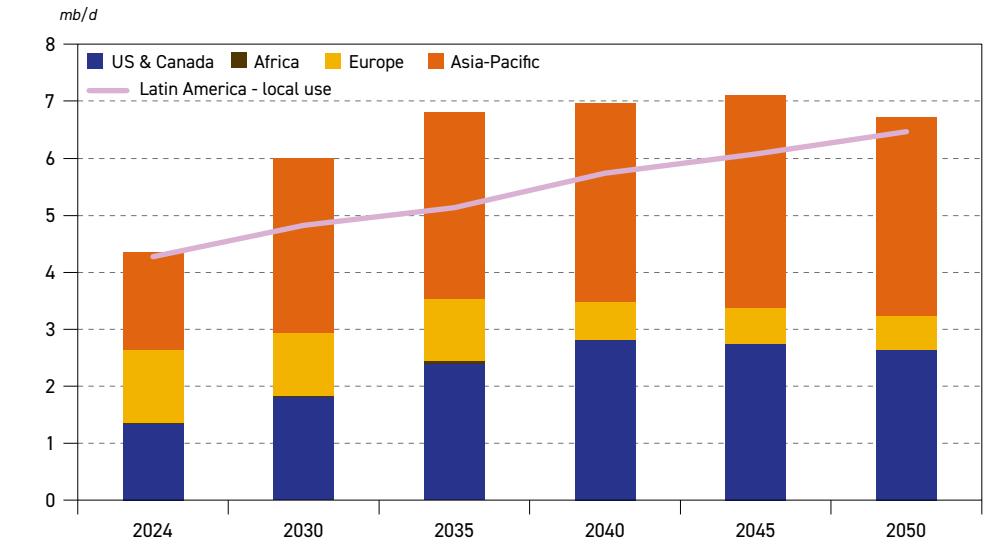
Figure 6.6 Crude and condensate exports from Latin America by major destination (and local use), 2024–2050

Source: OPEC.
2050. This will also help to meet rising oil demand in Latin America and reduce the reliance on product imports from other regions in the long term.
Figure 6.7 shows crude and condensate exports from Russia & Caspian. Total export volumes from this region were estimated at around 5.4 mb/d in 2024 and are projected to decline gradually to around 4.8 mb/d in 2050, as a result of declining supply in the long term.

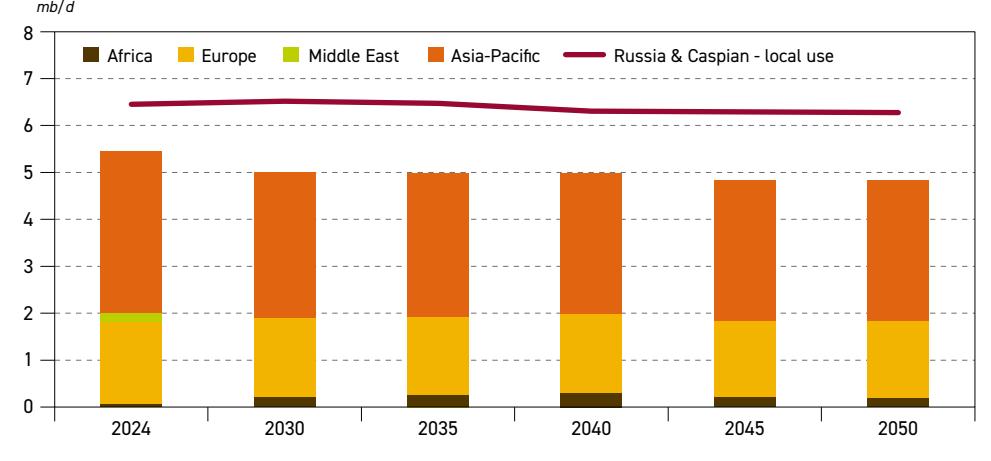
Source: OPEC.
Crude and condensate exports to Europe are expected to hover at around 1.6 mb/d throughout the outlook period. These flows are significantly lower compared to the period before 2022, when the EU imposed an embargo on Russian crude imports. In the long term, Europe is likely to import mostly non-Russian barrels from Kazakhstan and Azerbaijan. However, the long-term outlook is uncertain, and flows of Russian barrels to some European countries cannot be excluded in the medium and long term, given a possible peace agreement related to the conflict in Eastern Europe. Nevertheless, it is unlikely that crude and condensate flows of Russian crude to Europe will reach pre-conflict levels even in the longer term.
Crude and condensate flows from Russia & Caspian to the Asia-Pacific are expected to decline from approximately 3.4 mb/d in 2024 to 3 mb/d in 2040. These levels are then projected to remain flat until the end of the outlook period. Of note, crude and condensate flows to the Asia-Pacific are dependent on flows of Russian crude to Europe in the long term. Limited flows of crude and condensate from Russia & Caspian to Africa are projected, but these flows are not expected to exceed 0.3 mb/d during the outlook period.
Local crude use in Russia & Caspian is expected to decline marginally, from nearly 6.5 mb/d in 2024 to 6.3 mb/d in 2050 and beyond. The significant uncertainty surrounding local crude use is related to product exports from this region, which are likely to face increasing competition from other regions, especially the US & Canada, Europe and the Middle East.

Figure 6.8 presents crude and condensate from Africa in the outlook period. Total crude and condensate exports from Africa are expected to remain stable at around 5.2 mb/d between 2024 and 2035. This is due to rising African supply, which is offset by the increasing domestic use of crude. In the longer term, total crude and condensate exports from Africa are expected to decline gradually and reach 4.2 mb/d in 2050, as supply growth slows, and the domestic use of crude keeps rising.
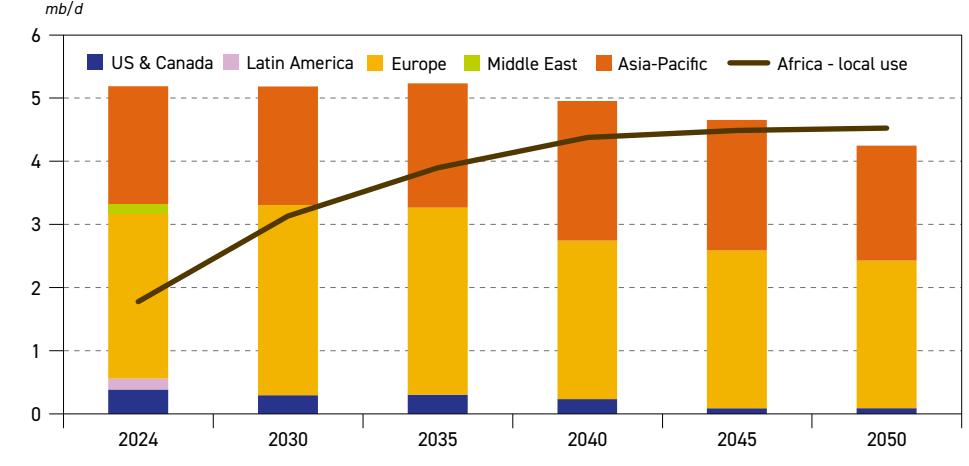

Source: OPEC.
Europe and the Asia-Pacific are two major destinations for African crude exports. From around 2.6 mb/d in 2024, crude exports to Europe are expected to increase to around 3 mb/d in 2030. However, due to declining demand in Europe, exports are then set to decline gradually to around 2.5 mb/d in 2040 and further to 2.3 mb/d in 2050.
Crude and condensate flows from Africa to the Asia-Pacific were estimated at roughly 1.9 mb/d in 2024 and are set to remain stable to 2030. A modest increase is expected afterwards, with total exports reaching 2.2 mb/d by 2040, driven by rising demand in the Asia-Pacific and declining shipments in Europe. As overall export volumes from Africa decline, however, exports to the Asia-Pacific are expected to drop to around 1.8 mb/d by 2050.
In 2024, exports from Africa to the US & Canada were assessed at around 0.4 mb/d. These are expected to decline gradually to around 0.1 mb/d in 2045 and beyond. In the US market, African barrels face strong competition from Latin American volumes, some of which are similar in terms of quality but have significantly lower shipping costs to the US.
Finally, domestic crude use in Africa is expected to increase from 1.8 mb/d in 2024 to 3.9 mb/d in 2035 and further to 4.5 mb/d in 2050. This is in line with an estimated increase in (required) refinery capacity additions and the related rise in refinery throughputs in Africa. However, any delay in long-term refinery capacity additions will likely lead to lower domestic use of crude oil. Consequently, crude and condensate exports to other regions will be higher relative to the Reference Case.

Figure 6.9 shows crude and condensate exports from the US & Canada during the outlook period. In 2024, crude and condensate exports from the US & Canada were estimated at around 4.1 mb/d. Although still relatively small, the share of shipments from Canada to non-US regions has increased, supported by the startup of the Trans Mountain pipeline expansion project in mid-2024. Canada is increasingly exporting crude to the Asia-Pacific, especially China, reaching average levels of almost 0.3 mb/d in October 2024. With rising uncertainty related to tariffs on Canadian crude exports to the US, Canadian shipments to the Asia-Pacific could increase significantly in the near term.
Figure 6.9
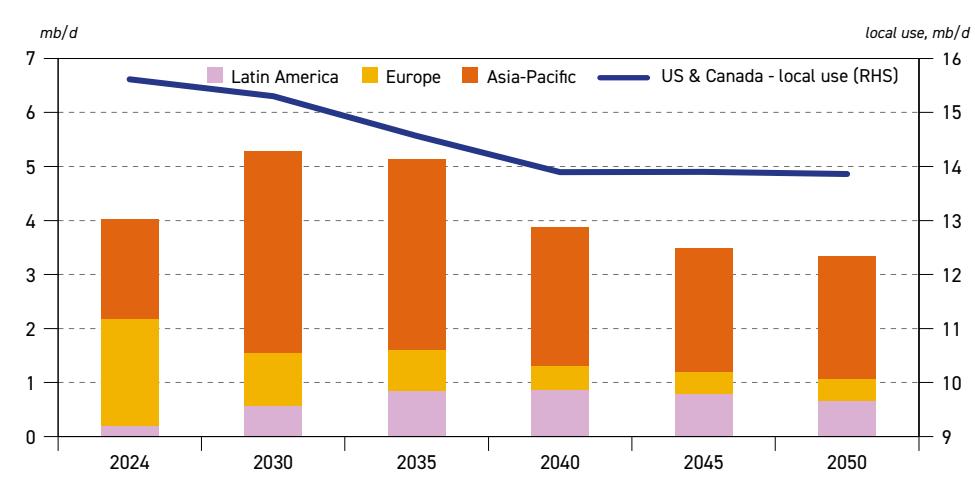
Crude and condensate exports from US & Canada by major destination (and local use), 2024–2050
Looking forward, crude and condensate exports from the US & Canada are projected to increase to 5.3 mb/d in 2030. Due to the expected US oil output peak and gradual decline, crude and condensate exports from the US & Canada are seen declining towards 3.3 mb/d in 2050.
Crude and condensate exports to Europe reached around 2 mb/d in 2024. Nevertheless, these are projected to decline in the medium and long term as US tight oil crude is not a good fit for the European diesel-geared refining sector, due to its significant share of light products. This is a major reason why US & Canada crude and condensate exports to Europe are projected to decline to around 1 mb/d in 2030 and further to 0.4 mb/d in 2045 and beyond.
Crude and condensate shipments to the Asia-Pacific are projected to increase from 1.8 mb/d in 2024 to 3.7 mb/d in 2030. This is in line with rising demand in the Asia-Pacific and an overall increase in export volumes from the US & Canada. The increase is mostly accounted for by US tight oil light-sweet volumes. Light-sweet barrels from the US are in high demand in the Asia-Pacific due to their large share of light distillates, part of which can be used as a feedstock for the region's expanding petrochemical sector. However, as already mentioned, the startup of the Trans Mountain pipeline in 2024 will allow for additional exports of Canadian heavy crude to the Asia-Pacific as well. In the longer term,

6
Source: OPEC.
exports are projected to decline gradually to around 2.3 mb/d by 2050, in line with reduced crude availability for exports.
Limited exports to Latin America are projected too, rising from 0.2 mb/d in 2024 to around 0.9 mb/d between 2035 and 2040. As many refineries in Latin America are not complex, US supplies of gasoline-rich crudes are welcome. Due to lower total export volumes, crude exports from the US & Canada are expected to decline marginally to around 0.7 mb/d in 2050.
Local crude use in the US & Canada is projected to decline gradually from 15.6 mb/d in 2024 to 13.9 mb/d in 2050, reflecting this region's declining demand.
Figures 6.10, 6.11 and 6.12 show crude and condensate imports for the three largest importing regions, namely the US & Canada, Europe and the Asia-Pacific.
Figure 6.10 shows crude and condensate imports to the US & Canada. Due to the refining configuration and the demand patterns, the US & Canada remains an important importer of crude throughout the outlook period. Overall imports were estimated at around 2.3 mb/d in 2024. With rising supplies of heavy and medium grades, mostly from Latin America, the US & Canada is projected to increase their imports to around 4.6 mb/d by 2040. This is followed by a gradual decline to 3.8 mb/d in 2050 due to declining demand in the US & Canada.
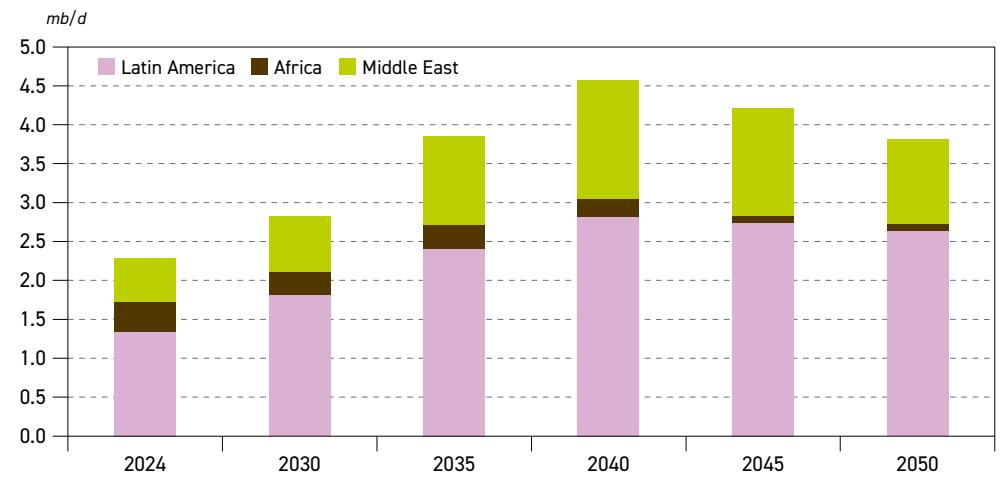
Figure 6.10

Source: OPEC.
The most dominant supplier of crude and condensate to the US & Canada is Latin America. From around 1.3 mb/d in 2024, volumes are expected to more than double by 2040, reaching 2.8 mb/d. The proximity of both regions, coupled with favourable economics, facilitates this significant rise. In the post-2040 period, imports decline to around 2.6 mb/d by 2050, partly due to the expected lower availability of crude from Latin America.
Crude and condensate imports from the Middle East were assessed at around 0.6 mb/d in 2024. Due to a strong increase in Middle East supply in the Reference Case, part of which will

be accounted for by heavy crude, the imports into the US & Canada are expected to increase to around 1.5 mb/d by 2040. In line with the overall trend, these flows are projected to drop afterwards, falling to around 1.1 mb/d in 2050.
Minor volumes from Africa are also expected. From around 0.4 mb/d, US & Canada imports from Africa are set to drop to 0.1 mb/d by 2045. The decline is mostly the result of increasing competition from Latin American volumes in the medium and long term.
Figure 6.11 illustrates European crude and condensate imports. Overall imports are projected to decline from around 9.2 mb/d in 2024 to 7.8 mb/d in 2050. The drop is the result of falling demand in Europe, which is partly offset by declining domestic supply in this region, especially in the longer term.
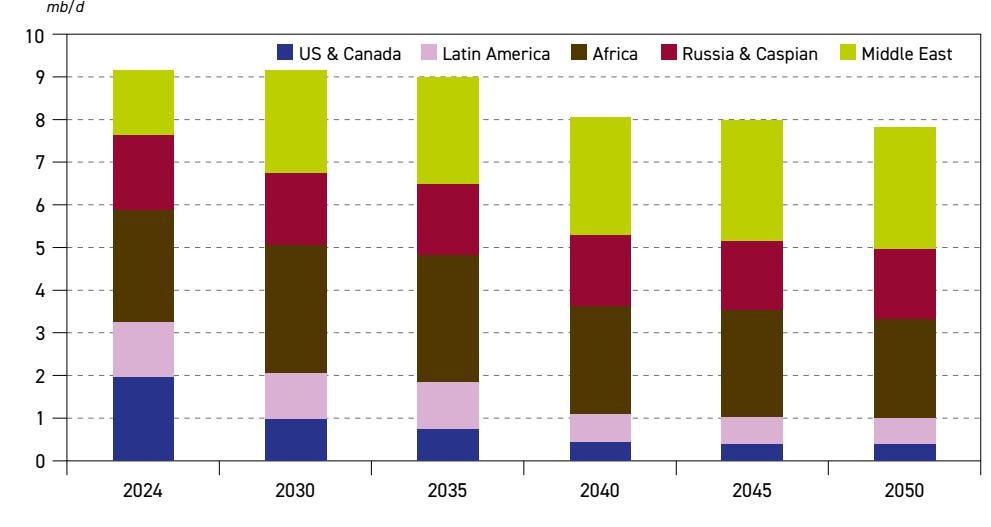
Figure 6.11 Crude and condensate imports to Europe by origin, 2024–2050
Source: OPEC.
Europe has a broad mix of crude and condensate imports. Following the EU's ban on Russian crude imports, the mix has become less dominated by barrels from Russia & Caspian, which were replaced by volumes from the US & Canada, Africa and the Middle East. Looking ahead, this Outlook expects future European crude and condensate imports to remain diversified.
In 2024, the largest supplier of crude to Europe was Africa at around 2.6 mb/d. From these levels, Europe's crude and condensate imports from Africa are projected to increase to around 3 mb/d between 2030 and 2035. Additional African barrels are in demand, due to their quality, and are likely to replace some light-sweet volumes from the US & Canada. In the longer term, imports from Africa are projected to decline stepwise to around 2.3 mb/d by 2050, in line with an overall decline in crude imports.
Imports from the Middle East are projected to increase from 1.5 mb/d in 2024 to 2.4 mb/d in 2030 and gradually to 2.9 mb/d by 2050. The increase is expected to be partly due to

the lower availability of crude from other regions, including Africa, as well as Russia & Caspian. Imports from Latin America are projected to drop from 1.3 mb/d in 2024 to 1.1 mb/d in 2030. In the longer term, imports from Latin America are projected to decline further to 0.6 mb/d by 2050.
Flows of crude and condensates from the US & Canada to Europe were close to 2 mb/d in 2024. Imports have increased in recent years, reflecting the European refining sector's efforts to replace Russian barrels. However, light-sweet supplies are not a good match for European product demand, which is why imports from the US & Canada are projected to decline in the long term, reaching 0.4 mb/d in 2045 and beyond.
Imports from Russia & Caspian were estimated at nearly 1.8 mb/d in 2024 and consist mostly of non-Russian shipments to various EU countries. This is a significant decline from the 3.5 mb/d recorded in 2021 and is due to the EU's embargo on Russian crude imports. Looking ahead, imports from Russia & Caspian (mostly from Kazakhstan and Azerbaijan) are projected to decline marginally to just below 1.7 mb/d in 2030 and inch down towards 1.6 mb/d by the end of the outlook period.
However, it is important to emphasize the high level of uncertainty related to these projections. A possible agreement to end the conflict in Eastern Europe could also help restore shipments of Russian crude to some European countries. This could have implications for the European import mix in the longer term, potentially leading to lower imports of similar crude from other regions such as Africa and/or the Middle East. However, a return to pre-conflict levels is unlikely, given the evolving demand patterns in Europe and new long-term trade relations between market participants in Europe and/ or Russia.
Crude and condensate imports to the Asia-Pacific are shown in Figure 6.12. In terms of total volumes, the Asia-Pacific is, and will remain, the most dominant importing region. Total crude
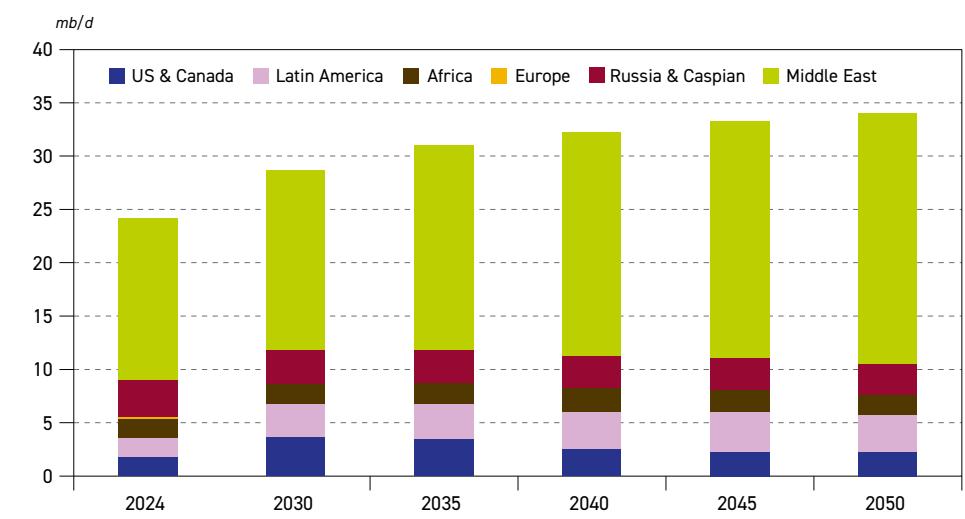
Figure 6.12 Crude and condensate imports to Asia-Pacific by origin, 2024–2050

Source: OPEC.
and condensate imports in 2024 were estimated at around 24.2 mb/d and are projected to increase strongly to 28.7 mb/d in 2030, driven by strong demand growth. In the post-2030 period, total crude and condensate imports increase gradually and reach 34.1 mb/d by 2050. This is due to rising demand and declining local supply.
The largest supplier to the Asia-Pacific is the Middle East. From around 15.2 mb/d in 2024, crude and condensate imports from the Middle East are projected to grow gradually to 23.5 mb/d in 2050. The share of the Middle East in the Asia-Pacific import mix increases from around 63% in 2024 to almost 70% in 2050.
Imports from Latin America are set to increase strongly from 1.7 mb/d in 2024 to above 3 mb/d in 2030 and then further to 3.7 mb/d in 2045, followed by a minor dip to 3.5 mb/d by 2050. This is in line with rising crude and condensate supplies in Latin America.
Asia-Pacific imports of crude and condensates from Russia & Caspian stood at around 3.4 mb/d in 2024. Due to the expected drop in Russia & Caspian supplies in the long term, imports from this region are set to decline to around 3 mb/d by 2035 and remain stable until the end of the outlook period. It should be noted, however, that there is a large degree of uncertainty related to this outlook, which is partly linked to geopolitics and trade relations between Russia and Europe.
Imports from the US & Canada are projected to double from 1.8 mb/d in 2024 to 3.7 mb/d in 2030. These volumes, however, are then anticipated to decline gradually in the longer term. This is in in line with lower US & Canada supply. Imports in 2050 are forecast at 2.3 mb/d. The majority of US & Canada imports consist of light-sweet barrels, which are in high demand from many Asian refiners that are geared towards maximizing light distillate production. In addition, US & Canada imports are likely to see a rising share of heavy Canadian crudes. With the commissioning of the Trans Mountain pipeline in mid-2024, some Asian countries (notably China) have already started importing Canadian cargoes.
Rising demand in the Asia-Pacific is also set to attract additional imports from Africa, which are expected to increase from 1.9 mb/d in 2024 to around 2.2 mb/d in 2040. However, volumes are projected to decrease to around 1.8 mb/d by 2050, in line with the lower availability of crude for exports in Africa.
Figure 6.13 shows regional net crude and condensate imports. On the net importing side, the largest increase is observed in Other Asia-Pacific, with net imports rising from 13.7 mb/d in 2024 to 21.4 mb/d in 2050. China also sees rising net imports from 10.2 mb/d to 12.7 mb/d in 2050. In Europe, net imports are expected to increase initially, from 9 mb/d in 2024 to 9.2 mb/d in 2030. However, due to lower European demand, net imports decline thereafter and are at 7.8 mb/d in 2050.
On the net exporting side, two regions see a significant increase in net exports – the Middle East and Latin America. The Middle East is projected to increase its net exports from 17 mb/d in 2024 to 28.2 mb/d in 2050. Latin American net exports are seen rising from 3.9 mb/d in 2024 to 6.1 mb/d in 2050. In Africa, net exports see a continuous decline, mostly due to rising local use of crude. From around 5 mb/d in 2024, net exports decline to roughly 3.3 mb/d in 2050. The US & Canada is currently a net exporter of crude and condensates, estimated at 1.7 mb/d in 2024, and this is expected to reach 2.5 mb/d by 2030. Due to declining supply,


Figure 6.13 Regional net crude and condensate imports, 2024, 2030, 2040 and 2050
Source: OPEC.
however, the US & Canada is set to become a net importer, with net imports of around 0.5 mb/d by the end of the outlook period.
Refined product movements
As already discussed, refined product movements between the seven major regions are significantly lower compared to interregional crude and condensate flows. This is due to the preference of consuming countries to increase domestic refining and import crude and condensates, as well as benefit from lower transportation costs for crude and/or condensates relative to refined products. This is why the majority of refined products are produced and consumed within the respective regions.
Furthermore, some regions with significant crude and condensate exports (especially Africa), are likely to see a significant increase in long-term oil demand. This is why these regions are expected to process more crude domestically, serving local product demand and limiting crude exports.
In other words, a large part of refined product trade remains an intra-trade issue. However, there are still significant refined product flows from regions with sufficient refining capacities to others where local product demand is higher compared to local refinery output. In some cases, large crude oil producers (e.g. several countries in the Middle East) choose to expand their refining capacity and replace a portion of their crude exports with product exports. Consequently, future trends depend on local demand growth, as well as available and new refining capacity (see Chapter 5).
Figure 6.14 shows projected product net imports by major region. Net imports to the Asia-Pacific are set to increase from roughly 5.2 mb/d in 2030 to almost 9 mb/d in 2050. On the net import side, increases are expected in Africa, from around 1.4 mb/d in 2030 to 2.2 mb/d in 2050, and in Latin America, from 2.7 mb/d in 2030 to 3.1 mb/d in 2050. In Europe, net imports

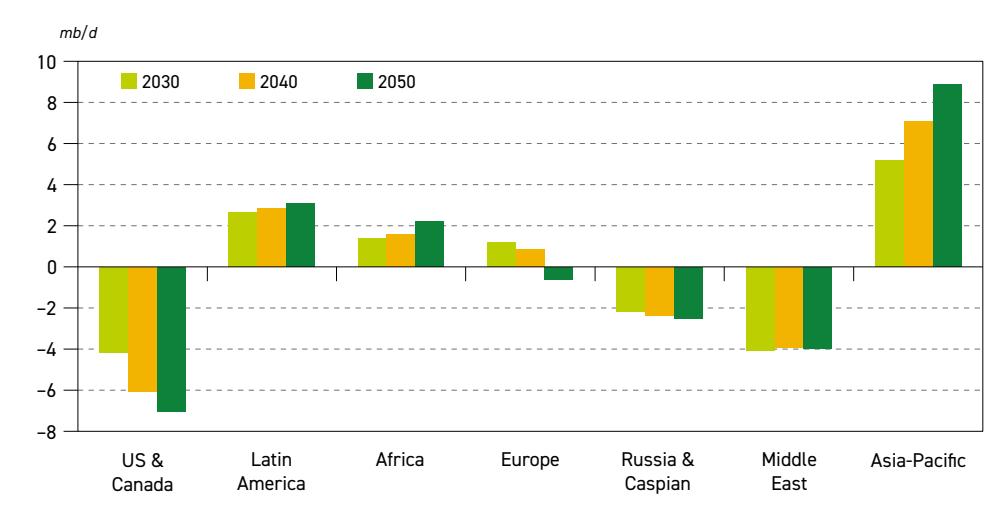
Figure 6.14 Regional net product imports, 2030, 2040 and 2050
Source: OPEC.
of around 1.2 mb/d in 2030 are expected to flip to net exports of roughly 0.6 mb/d in 2050, in line with declining demand.
Net imports are expected to be covered by rising net exports in the US & Canada, which are expected to increase from 4.2 mb/d in 2030 to around 7 mb/d in 2050. In the Middle East, net exports are seen at around 4 mb/d between 2030 and 2050. Finally, net exports in Russia & Caspian are expected to increase from around 2.2 mb/d in 2024 to 2.5 mb/d in 2050.

Energy Scenarios
Key takeaways
- • Given the wide range of uncertainties, and in line with past practice, this WOO will again feature two alternative scenarios to the Reference Case, in order to highlight the range of different but viable outcomes and their impact on energy demand, the future energy mix and oil demand, specifically.
- • The 'Technology-Driven Scenario' (TDS) is one where investments in advanced technologies affecting energy consumption occur at a more rapid pace than that assumed in the Reference Case. These investments result in both significant fuel substitutions and energy efficiency improvements, leading to lower primary energy demand and a changed energy mix. Moreover, it includes the greater deployment of carbon removal technologies, such as stationary and mobile CCUS and DAC technologies, especially in the second part of the forecast period.
- • Primary energy demand in the TDS by 2050 is almost 43 mboe/d lower than in the Reference Case. The share of non-fossil fuels in this scenario is projected to steadily expand to 46% by 2050, from less than 21% in 2024.
- • Global oil demand in this scenario gradually departs from the Reference Case and starts declining after 2035. This pathway opens up a demand gap, vis-à-vis the Reference Case trajectory, of close to 5 mb/d in 2035. This expands to 16.7 mb/d in 2050.
- • The largest potential for oil demand reduction in the TDS exists in road transportation. This is through the combined effect of faster EV penetration and ICE efficiency improvements, followed by the industrial and aviation sectors.
- • By contrast, the 'Equitable Growth Scenario' (EGS) illustrates a pathway that sees a more equitable and prosperous economic future for developing countries, coupled with a differentiated approach to how and when to achieve emission reduction targets. This scenario results in higher long-term demand for energy, in general, and oil, in particular.
- • Global energy demand in the EGS is expected to be close to 16 mboe/d higher than in the Reference Case by 2050, reaching a level of 394 mboe/d.
- • This incremental energy demand is largely met by 'Other renewables', gas and oil each increasing by an additional 6 mboe/d to 7 mboe/d by 2050. In contrast, global coal demand declines by more than 6 mboe/d below the 2050 level seen in the Reference Case.
- • Oil demand in this scenario tops 120 mb/d by 2035 and continues growing to almost 130 mb/d in 2050. Compared to the Reference Case, this is almost 3 mb/d higher by 2035, and 6.5 mb/d higher by 2050.
- • In all energy futures, the critical role of oil and gas in meeting future energy demand, developing new technologies and helping eradicate energy poverty should be taken into consideration.
Long-term energy outlooks are based upon numerous assumptions and are thus exposed to a plethora of uncertainties and risks. These uncertainties pertain to the economic outlook, policy shifts, the pace of technology advances, political and geopolitical developments, investment priorities, consumer behaviour, environmental concerns and 'unknowable' risks and events, such as the COVID-19 pandemic.
Given the wide range of current geopolitical and economic uncertainties, and in line with past practice, this WOO again features two alternative scenarios to the Reference Case, in order to present the range of different but viable outcomes and their impact on energy demand, the future energy mix and oil demand, specifically.
The first, the 'Technology-Driven Scenario' (TDS) , is one where investments in advanced technologies affecting energy consumption occur at a more rapid pace than those assumed in the Reference Case. This scenario starts with the same basic socio-economic assumptions on global population and economic development to 2050 as adopted in the Reference Case. However, an increased focus over time on higher investments in advanced technologies works in two directions.
Firstly, this is partly a story of fuel substitution, which is largely driven by electrification. This encompasses faster EV penetration; coal, oil and gas substitution by electricity in industrial processes; and electrification of the residential sector, which, in turn, all result in higher electricity demand. An important part of this scenario relates to how this higher electricity demand is met. It is assumed that further investments flow into a faster expansion of renewable electricity, mainly solar PV and wind, nuclear power plants and partially more efficient gas turbines, which, to a large extent, will substitute for inefficient coal-based electricity generation.
Secondly, efficiency gains in the widest sense are assumed (without substitution), including more efficient engine technology, more efficient power generation of various kinds, advances in the residential sector – including housing insulation and appliances – as well as the industrial use of energy. The net effect is reduced energy demand, including demand for oil, and a significantly different energy mix compared to the Reference Case.
Besides efficiency improvements and fuel substitution, the TDS also assumes a greater deployment of carbon removal technologies, such as stationary and mobile CCUS and DAC technologies, especially in the second part of the forecast period. Moreover, an expansion in hydrogen use, and a more rapid shift towards adopting a circular carbon economy (CCE) framework, are also part of this scenario.
The second, the 'Equitable Growth Scenario' (EGS) , provides a trajectory where a more equitable outlook, with higher economic growth in developing countries, results in higher longterm energy and oil demand. This scenario assumes stronger long-term economic growth, especially in Africa, India, and developing countries in Asia and Latin America. Consequently, these countries experience higher levels of industrialization and urbanization, which then lead to a larger middle class and improved living conditions for billions of people. While the problem of energy poverty in the widest sense is not fully resolved in this scenario, it is alleviated, with at least minimum access to energy provided to everybody in an affordable manner and in a way that avoids adverse impacts.
The EGS also assumes a quicker transition (compared to the Reference Case) to modern energy sources in these countries, including renewable energy, oil, gas and nuclear power,
especially in the latter half of the outlook period. However, this is not implemented consistently across the board, in the absence of a coordinated move to reduce future emissions. In fact, local development needs in this scenario are prioritized over global issues due to wider protectionism and unilateralism holding sway. While the above issues are largely a phenomenon in emerging economies, there is nevertheless a spillover effect into OECD countries too, due to higher consumption and trade.
The benefit of including these two alternative scenarios, with their varying narratives and assumptions, is to indicate the range of uncertainties to the Reference Case. It also highlights OPEC's commitment to dialogue, outreach and transparency, as well as the Organization's focus on highlighting the challenges facing the world's long-term energy future from different angles.
In the following part of this chapter, the results of these two alternative scenarios are presented and compared relative to the Reference Case. The focus is on highlighting the impact of the varying narratives adopted in these scenarios on future energy demand, the sectoral and regional implications, as well as the changing energy mix, in general, and oil demand, in particular.
7.1 Energy demand and mix
As discussed in detail in Chapter 2, global primary energy demand in the Reference Case is set to grow steadily over the forecast period and reach almost 378 mboe/d by 2050. This represents an increase of almost 70 mboe/d compared to 2024 levels. Apart from coal, which is projected to decline by more than 30 mboe/d between 2024 and 2050, demand for all other major energy sources expands, led by solar and wind electricity production and followed by natural gas and oil.
As presented in Figure 7.1, primary energy demand in the alternative scenarios only gradually departs from the Reference Case trends over the rest of the current decade. During this
Figure 7.1
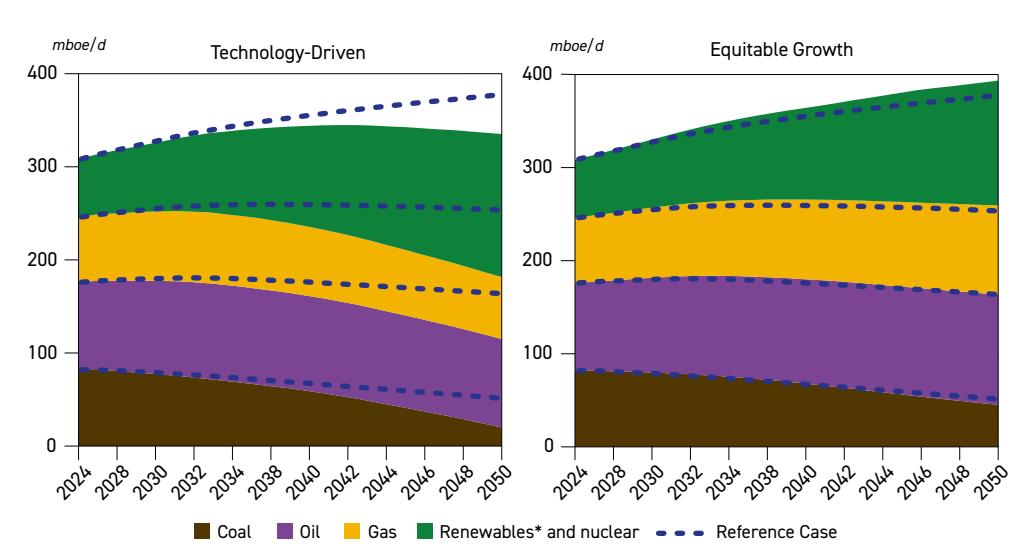
Global primary energy demand in the Reference Case and in alternative scenarios, 2024–2050
* Renewables include hydro, biomass, wind, solar and geothermal energy. Source: OPEC.

period, policy discussions and investment priorities will likely focus primarily on economic and defence issues, hence, this affords a lower priority to considerations of energy efficiency and energy poverty in developing countries.
Therefore, the impact of the alternative scenarios only starts to be visible around 2035. After that, however, the gap between the Reference Case and alternative scenarios evolves relatively quickly, impacting both the level of future demand, as well as its composition. This will be particularly evident in the TDS, where the faster deployment of more efficient technologies increasingly limits final energy consumption growth. Moreover, these trends and technologies – such as a faster penetration of EVs in road transportation; electric arc furnaces, induction and resistance heating systems in industry; and electric boilers and heat pumps in the residential sector – will not only improve efficiency but also lead to higher electricity demand in each of the sectors.
Therefore, an important aspect of these scenarios is how expanding electricity demand will be met. The TDS assumes that the majority is provided by 'Other renewables', mainly solar PV and wind, followed by nuclear energy. The latter is anticipated to come mainly from small modular reactors that substantially shorten the long lead times of conventional, large nuclear power plants. Increased electricity production from these sources will mostly affect the use of coal in power generation. However, they will also partly substitute natural gas – on top of lower gas demand due to more efficient gas turbines and its substitution in the industrial and residential sectors. Regarding coal demand, the main reason for a large demand drop in this scenario is coal's relatively low energy efficiency for electricity generation, it offers the most cost-effective way to improve efficiency and curb emissions.
In the case of the EGS, changes compared to the Reference Case are less pronounced but still significant. In contrast to the TDS, energy demand in the EGS continues to grow even faster than in the Reference Case. Moreover, while the demand reduction evident in the TDS will affects all regions and sectors, higher energy demand in the EGS is concentrated in developing regions – mainly in Africa, Other Asia and India – where the need to alleviate energy poverty is greatest. From a sectoral perspective, the driving force is higher electricity, gas and oil demand in the residential and industrial sectors, supplemented by the commercial and agricultural sectors. In turn, this necessitates some changes in power generation too.
More specifically, Figure 7.2 and Figure 7.3 detail these general trends in the alternative scenarios for 2035 and 2050, respectively. Until 2035, primary energy demand in all scenarios (including the Reference Case) continues to grow, albeit at different paces. As a result, the demand gap between the Reference Case and alternative scenarios gradually opens up to around 7 mboe/d by 2035. Due to assumed faster efficiency improvements, energy demand in the TDS is estimated at 341 mboe/d by 2035 – 6.8 mboe/d lower than in the Reference Case – as demand growth for oil and gas decelerates and coal demand declines faster. Coal will be most affected, declining to 66 mboe/d, compared to almost 82 mboe/d in 2024. This level is almost 6 mboe/d lower than the corresponding demand in the Reference Case, whereas gas and oil are lower by 4.8 mboe/d and 4.4 mboe/d, respectively.
However, reduced demand for these energy sources is partly offset by significantly higher electricity demand. Therefore, the TDS foresees much stronger growth in solar PV and wind energy as the key sources of incremental electricity, especially in the period to 2035, which is too short for a significant nuclear power expansion, and where there are limited
options for additional hydropower. Moreover, gas also plays an important role in the power sector during this period.
Figure 7.2 also shows that global energy demand in the EGS differs from the Reference Case projections by a volume comparable to the TDS, but in the opposite direction. Indeed, by 2035, total energy demand in the EGS is 7.5 mboe/d higher than in the Reference Case. The difference is that demand for all energy sources in the EGS broadly follows the demand
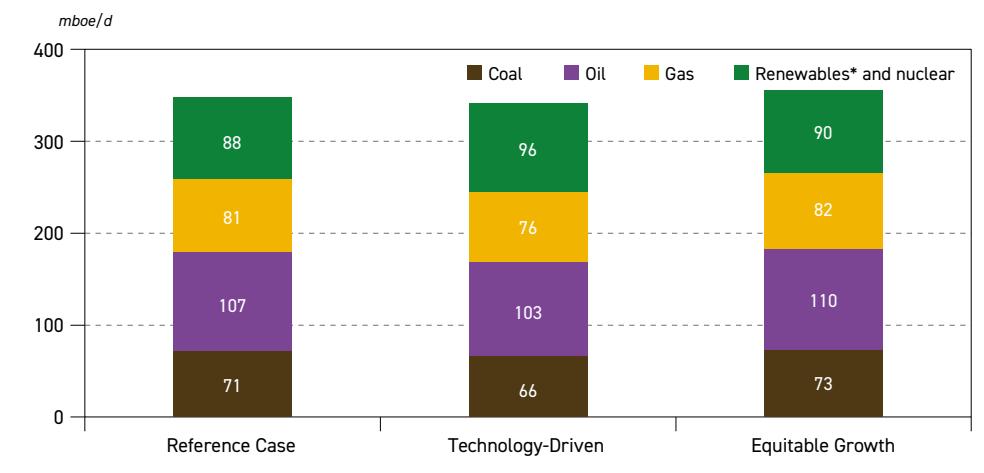

* Renewables include hydro, biomass, wind, solar and geothermal energy. Source: OPEC.


* Renewables include hydro, biomass, wind, solar and geothermal energy. Source: OPEC.
trajectories outlined in the Reference Case, but at gradually higher levels. By 2035, oil demand is projected to be more than 2 mboe/d higher, while gas, coal and the combined demand for renewables and nuclear increase by almost 2 mboe/d each.
Although these demand changes to 2035 are rather limited, they still indicate a momentum building towards a larger change when moving to the second part of the outlook period, as presented in Figure 7.3. It shows that the demand gap between the TDS and the Reference Case widens to 43 mboe/d by 2050, while the corresponding change for the EGS is an expansion of 16 mboe/d.
Global energy demand in the EGS continues to expand at a higher rate, driven by faster economic development, especially in developing countries, and improved living standards and energy access for billions of people. It is worth noting that assumed global GDP growth rates in this scenario are not significantly higher compared to the Reference Case. Nevertheless, the cumulative effect of long-term annual growth rates that are on average higher by around 0.3% is sufficient to push global 2050 GDP levels in this scenario higher by almost $20 trillion compared to the Reference Case, with a large part of it taking place in developing countries.
In the case of the TDS, Figure 7.4 provides a high-level summary of the changing energy mix in this scenario at the end of the forecast period. Given that a major side effect of the faster penetration of more energy efficient technologies is to reduce future emissions, coal demand in this scenario continues to decline throughout the forecast period, falling to a level of 20 mboe/d in 2050. This is 31 mboe/d lower than the corresponding demand in the Reference Case and almost 62 mboe/d lower than observed demand in 2024, leading to a significant reduction in coal use. In OECD countries, specifically, this would mean the almost complete elimination of future coal consumption.
The demand pattern for natural gas in the TDS is different. Gas demand continues to expand at almost the same rate as in the Reference Case during the current decade, before plateauing
Figure 7.4

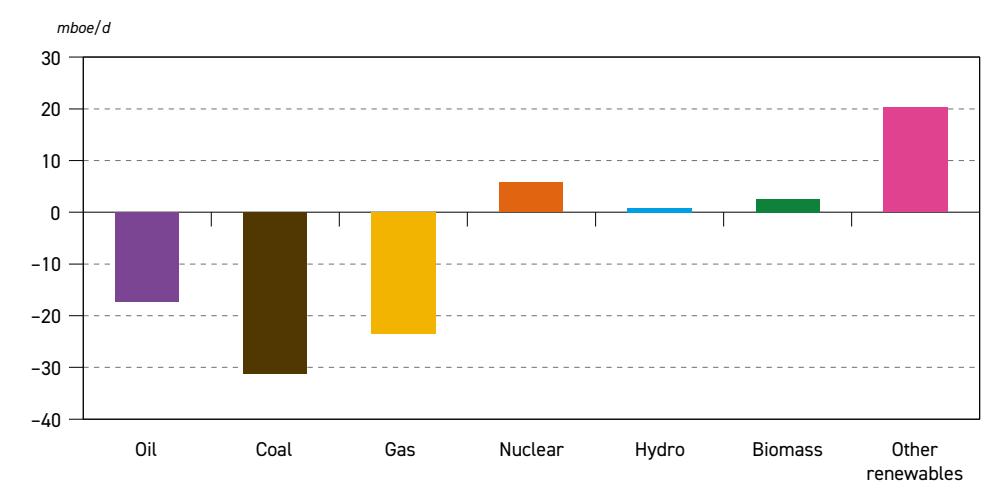
Source: OPEC.
![]()
for most of the next decade at levels around 75 mboe/d. During this period, demand losses in the industrial and residential sectors are broadly offset by still-growing electricity generation demand, where gas plays an important role in stabilizing the power grid and providing additional electricity via more efficient gas turbines.
During the last decade of the forecast period, however, gas demand starts to gradually decline as solar PV, wind and nuclear energy increasingly cover expanding electricity demand, and the role of natural gas is increasingly limited to providing the baseload, especially in combination with CCUS. The overall impact is that by 2050, global gas demand falls to around 66 mboe/d, almost 4 mboe/d lower than in 2024. Compared to the Reference Case, this represents a demand reduction of more than 23 mboe/d by 2050.
Oil demand in this scenario follows a similar trajectory to gas, but the overall effect is less pronounced, especially in the long term. Oil demand in the TDS increases by almost 9 mboe/d between 2024 and 2035, reaching 103 mboe/d. Around this time, however, demand starts to gradually decline on the back of faster oil substitution in the industrial, transport and residential sectors. In particular, this is the case in OECD regions and China, while a lesser impact is expected in other regions where efficiency improvements are partly offset by growing mobility requirements and expanding industry.
Of note, during the second part of the forecast period, emission reductions – primarily achieved by coal substitution in the power and industrial sectors, lower demand for gas due to efficiency improvement measures, as well as the extended use of carbon removal technology – lessens the need for oil substitution in hard-to-abate sectors, especially the transportation and petrochemical sectors.
During this period, global oil demand in the TDS is expected to slowly decline from a level of 103 mboe/d in 2035 to 95 mboe/d by 2050, broadly the same level as projected for 2025. However, this demand is more than 17 mboe/d lower than the projected 2050 demand in the Reference Case. Moreover, as further elaborated in Section 7.3, non-OECD oil demand continues to grow in the TDS over the entire forecast period, albeit at slower rates compared to the Reference Case. In contrast, OECD oil demand in this scenario witnesses an accelerated decline, dropping by more than 16 mboe/d between 2024 and 2050.
Primarily driven by accelerated electrification across all sectors, the demand outlook for renewable energy sources and nuclear energy shows a different picture. Combined demand for these sources is expected to increase by almost 72 mboe/d between 2024 and 2050, almost 30 mboe/d more than in the Reference Case over the same period. Of this, more than 20 mboe/d is provided by solar PV and wind, while nuclear energy affords an additional 6 mboe/d. As a result, the share of oil, gas and coal drops significantly in the future TDS energy mix, while the combined share of renewable energy sources and nuclear reaches almost 46% by 2050.
Turning back to the EGS, the long-term changes in its energy mix, compared to the Reference Case, are provided in Figure 7.5. As already mentioned, global primary energy demand in this scenario is expected to be close to 16 mboe/d higher than in the Reference Case by 2050. This incremental energy demand is largely provided by 'Other renewables', gas and oil, each increasing by an additional 6 mboe/d to 7 mboe/d by 2050. This means that gas demand in the EGS is projected to increase by 26 mboe/d between 2024 and 2050, mainly supported by growing demand in the power, industrial and residential sectors. The corresponding oil

demand increase is 24 mboe/d. Higher oil demand mainly comes from the residential and industrial sectors in developing countries, and partly from the transportation sector.
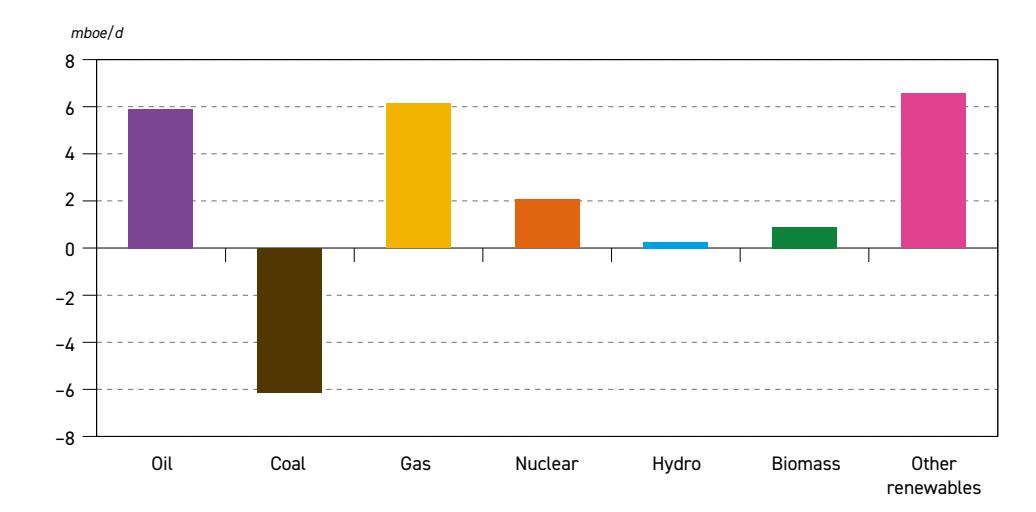
Figure 7.5 Change in primary energy demand between the Equitable Growth Scenario and Reference Case in 2050
Source: OPEC.
In fact, the largest incremental demand in this scenario is associated with solar and wind energy. These two energy sources combined are the fastest-growing energy source in the EGS, increasing by almost 7% p.a. on average over the entire outlook period, or cumulatively by almost 47 mboe/d between 2024 and 2050. This is almost 7 mboe/d higher than Reference Case projections. Adding in incremental demand for nuclear, hydro and biomass pushes up overall demand growth for these forms of energy by around 72 mboe/d in the period to 2050.
In the initial period to 2035, the focus of the EGS is on providing additional electricity to those either lacking access or having only limited access in terms of both available capacity and duration (typically just a few hours per day). During this period, all options for higher electricity production are used, including coal, which stays above levels projected in the Reference Case (albeit slightly declining). In the latter period, however, coal demand is expected to accelerate its decline, falling below Reference Case levels as sufficient capacity from solar, wind, gas and nuclear power is built.
As a result, global coal demand drops to around 45 mboe/d by 2050, around 37 mboe/d lower than that observed in 2024. Compared to the Reference Case, this represents an additional decline of more than 6 mboe/d in 2050. Most of this decline is expected to take place in the OECD and China, where a part of the higher GDP is used to implement additional measures to reduce emissions.
Figure 7.6 complements the previous discussion on the changing energy mix in the alternative scenarios by providing an overview of global energy demand in 2050 from a sectoral perspective. It is important to note that the sectoral breakdown considers energy demand from the primary side, meaning that all sources of electricity are included in the

transformation sector. To avoid double-counting, electricity demand is then excluded from the industrial, transportation and other sectors, which, obviously, provides a somewhat distorted picture of the relative importance of these sectors. Nevertheless, despite this shortcoming, this approach helps to demonstrate the impact of the various narratives on the structural changes in sectoral energy consumption between the scenarios.
In the TDS, oil, gas and coal substitution by electricity plays a key role, leading to lower energy demand in industry, transport and other sectors. Moreover, demand reductions in these sectors are also the result of more efficient technology (such as advanced ICEs and efficient gas furnaces in industry). Finally, some fuel substitution is also assumed: from coal to gas (mainly in the power and industrial sectors), oil to gas (mainly in the industrial sector) and biomass to oil (in the residential sector), which adds to the complexity of the sectoral changes.
The overall effect of these measures assumed for the TDS is that energy demand in the industrial sector drops below 50 mboe/d in 2050 from almost 60 mboe/d in 2024. However, since industrial demand continues growing in the Reference Case to 67 mboe/d in 2050, the corresponding TDS demand is 18 mboe/d lower than in the Reference Case. In fact, energy demand in the industrial sector is the most affected in the TDS, as it provides some 'lowhanging fruit' for better efficiency and emissions reduction.
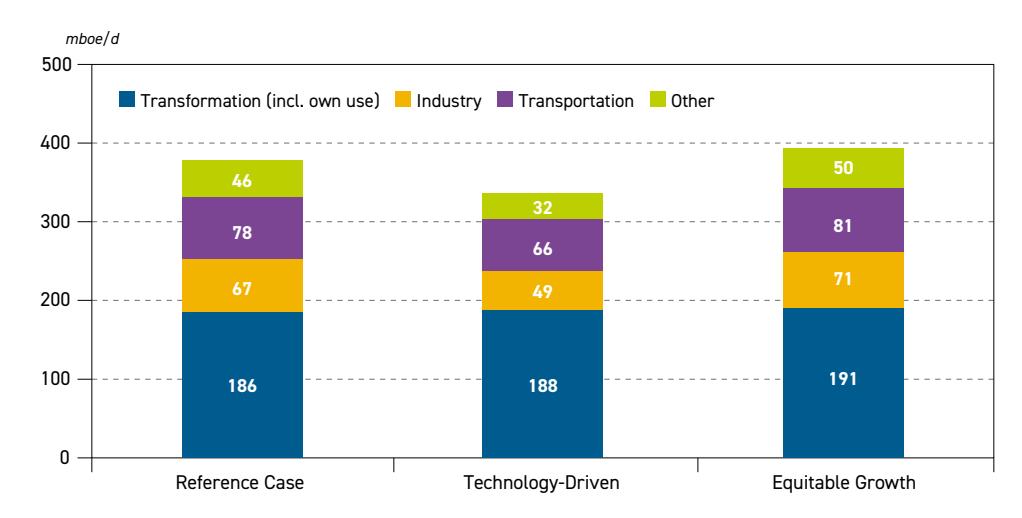
Figure 7.6 Global energy demand* by sector in the Reference Case and alternative scenarios, 2050
* Sectoral energy demand in this figure is measured from the primary energy side. Therefore, electricity is included in the transformation sector and is excluded from industry, transport and other sectors.
Source: OPEC.
A significant reduction in demand is also projected in the 'other sectors', comprising the residential, commercial and agricultural sectors. The TDS assumes that this is achieved by applying stricter building codes, more efficient lighting, heating and cooling systems, better building insulation, as well as through the faster introduction of more efficient machines and vehicles in the agricultural sector. The estimated combined impact of these measures is that

7
energy demand in this sector in 2050 is around 14 mboe/d lower than the corresponding Reference Case demand.
Significant demand reduction in the TDS (compared to the Reference Case) is also projected in the transportation sector. In this case, it is mainly achieved by a combination of the faster penetration of EVs and more efficient ICEs in road transportation. Adding to this is the effect of further rail transportation electrification and efficiency improvements in aviation and marine transportation. The cumulative impact of these trends is a downward revision of 2050 global energy demand in this sector to 66 mboe/d in the TDS, compared to 78 mboe/d in the Reference Case.
Structural changes in the transformation sector in the TDS are much more complex compared to the above-discussed sectors. As mentioned earlier, one of the key components driving energy demand in this scenario is the continued electrification across all sectors of final consumption, leading to significantly higher electricity demand compared to the Reference Case. Despite this, total energy demand in the transformation sector is only around 2 mboe/d higher in 2050.
The main reason for this seeming contradiction is the large substitution of inefficient coal use by renewable and efficient gas-powered electricity. This substitution, supplemented by nuclear electricity, allows for a comparable amount of electricity with a lower input of primary fuels. Moreover, the TDS also assumes a significant increase in CCUS capacity, which helps to meet higher electricity demand without increasing CO2 emissions.
In contrast to the TDS, the EGS is much more aligned with the Reference Case in terms of sectoral demand. In this scenario, energy demand in all major sectors increases almost proportionally with the overall demand change. The largest incremental demand is projected for the transformation sector, expected to be around 5 mboe/d higher than 2050 Reference Case demand. This increase is required due to higher electricity demand in the EGS and fewer structural changes in the composition of electricity generation, compared to the TDS. A significant increase in energy demand is also projected in sectors like industry, transportation and others. However, the level of incremental demand in these sectors is somewhat lower, in the range of 3 to 4 mboe/d compared to the Reference Case.
Figure 7.7 provides a different perspective to illustrate the structural changes in the alternative scenarios. This is in respect to the changing energy mix and sectoral consumption discussed in the previous part of this section, through linking primary energy demand and the share of non-fossil fuels in the energy mix. The figure demonstrates that the TDS and EGS evolve in diverse ways and represent fundamentally specific energy systems at the end of the outlook period.
Assumed efficiency improvements and the faster penetration of renewable energy sources in the TDS result in a significantly faster-expanding share of renewable and nuclear energy in this scenario. Indeed, their combined share reaches 28% by 2035 and almost 46% by the end of the outlook period. This compares to around 25% and 33% in the Reference Case, respectively.
With respect to the EGS, Figure 7.7 shows that this scenario and the Reference Case are broadly aligned from a structural point of view, although some differences exist. While primary energy demand in the EGS expands faster than in the Reference Case, both scenarios
ENERGY SCENARIOS
include a gradual increase in the share of renewables and nuclear in the future energy mix. In the EGS, the combined share of these energy sources differs only marginally from the Reference Case in 2035, but the difference extends to more than 1 percentage point in 2050.

Figure 7.7 Global energy system in the Reference Case and alternative scenarios, 2025–2050
Source: OPEC.
7.2 Oil demand
Given the necessity to use a common unit when dealing with various energy sources, all figures in the previous part of this chapter were expressed on an energy content basis. For the benefit of readers familiar with a volumetric measure, however, this sub-section converts oil demand to a 'barrel per day' unit. Moreover, for better comparability – as oil demand expressed in barrels per day typically also includes other liquids blended with refined products, such as biofuels, GTLs and CTLs – corresponding adjustments were also made (hence, the reference to 'liquids' demand in Figure 7.8 and Figure 7.10).
Global liquids demand in the alternative scenarios and in the Reference Case is presented in Figure 7.8. While demand in the EGS and Reference Case broadly follows a similar trajectory, steadily expanding over the forecast period, liquids demand in the TDS gradually departs from the Reference Case and starts declining after 2035. This pathway gradually opens up a demand gap vis-à-vis the Reference Case trajectory of close to 5 mb/d in 2035, which expands to 12 mb/d in 2045 and further to 16.7 mb/d in 2050.
This demand difference progressively evolves on the back of the gradual penetration of more efficient technology and progressing oil substitution in all key consumption sectors, with the exception of petrochemicals. It is worth noting that, in parallel to these trends, the TDS also incorporates the gradual expansion of CCUS and a CCE framework which, once sufficiently expanded, lowers the need for a much larger substitution of oil and gas in the global energy mix, especially in hard-to-abate sectors. Therefore, in the years beyond the forecast period, the oil demand decline is likely be much slower and eventually stabilize for decades.

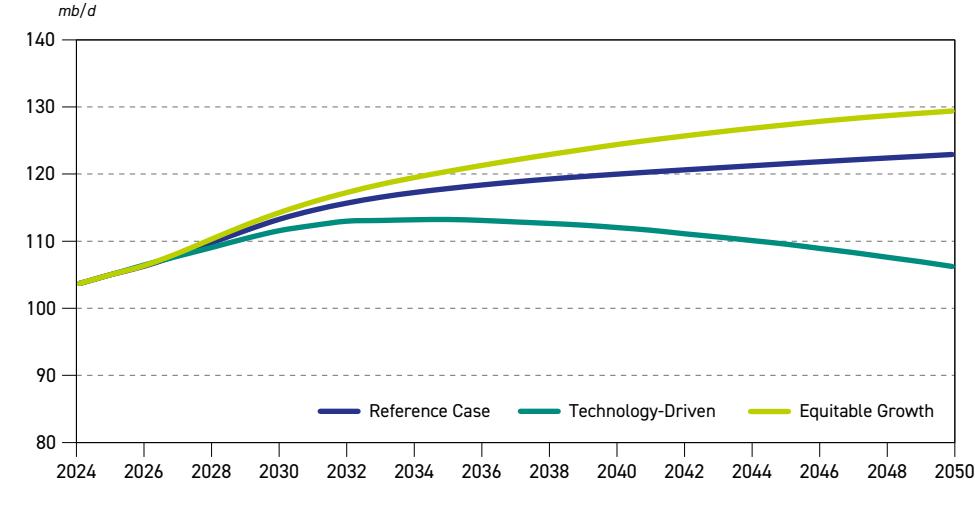

Source: OPEC.
Figure 7.9 provides some details at the sectoral level on the key components, with a demand drop of almost 17 mb/d in the TDS, relative to the Reference Case. Clearly, the sector with the largest potential for both oil substitution and efficiency improvements is road transportation. The primary option for oil substitution is the higher penetration of EVs. In the Reference Case, the EV fleet is projected to increase by almost 600 million vehicles over the forecast period, reaching almost 650 million by 2050. The TDS assumes a larger expansion of EVs, especially in China and OECD regions. In this case, the global EV fleet approaches the 1 billion mark in 2050, which replaces more than 4 mb/d of oil demand. Adding to this, the potential impact of
Figure 7.9

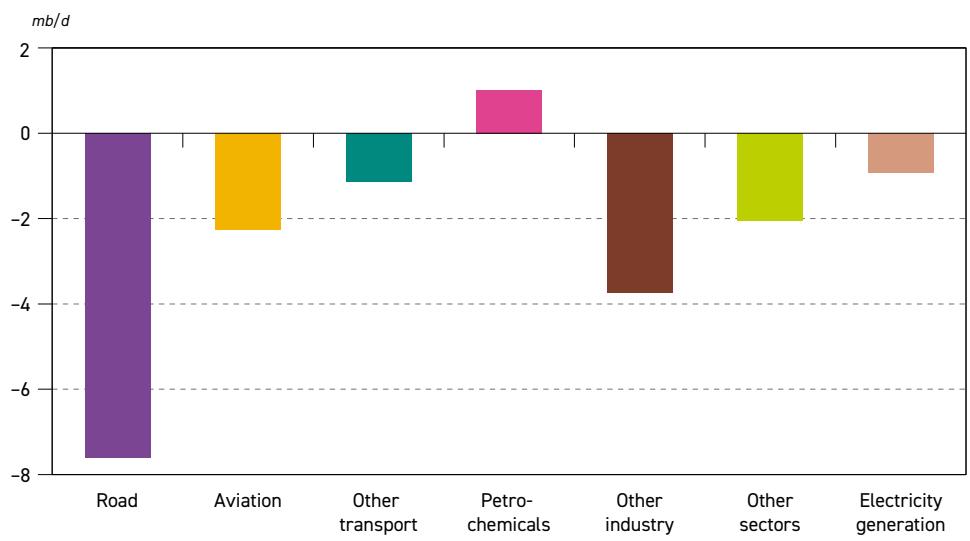


efficiency improvements in ICE-based vehicles could result in a global demand reduction of almost 8 mb/d, compared to the Reference Case.
There is also a significant potential for demand reduction in the industrial sector, estimated at almost 4 mb/d by 2050. Part of this reduction, again compared to the Reference Case, is the result of oil substitution by electricity and natural gas, while another part is linked to using more efficient furnaces. Similar arguments also apply to the aviation sector.
The TDS projection for oil demand in this sector is more than 2 mb/d lower than the Reference Case, mainly due to more efficient aircraft, but also given some substitution by electricity, especially in the category of smaller planes on short routes. Lower oil demand in the remaining sectors is primarily driven by the substitution of oil by gas and electricity. The only exception to this pattern is the petrochemical sector, where oil demand is expected to increase in the TDS compared to the Reference Case. This increase is relatively small – around 1 mb/d by 2050 – and is the result of higher demand for petrochemical products in the construction sector, car manufacturing, a larger number of PV panels and wind turbines, intensified agriculture, etc. However, part of the higher demand for the above reasons is offset by increased plastics re-use within the CCE framework.
Liquids demand in the EGS follows a different path. Since the key components of this scenario are more robust economic growth – especially in developing countries – and increased efforts to improve energy and electricity access in these countries, liquids demand in this scenario is expected to surpass Reference Case levels over the entire outlook period. By 2050, demand in the EGS is projected to reach almost 130 mb/d, 6.5 mb/d higher than in the Reference Case. In contrast to the TDS, oil demand in the EGS is projected to increase in all major sectors, while the largest incremental demand (compared to the Reference Case) materializes in the industrial (+1.9 mb/d), residential (+1.7 mb/d) and road transportation (+1.3 mb/d) sectors, as presented in Figure 7.10.
Figure 7.10
Difference in liquids demand between the Equitable Growth Scenario and Reference Case by sector in 2050
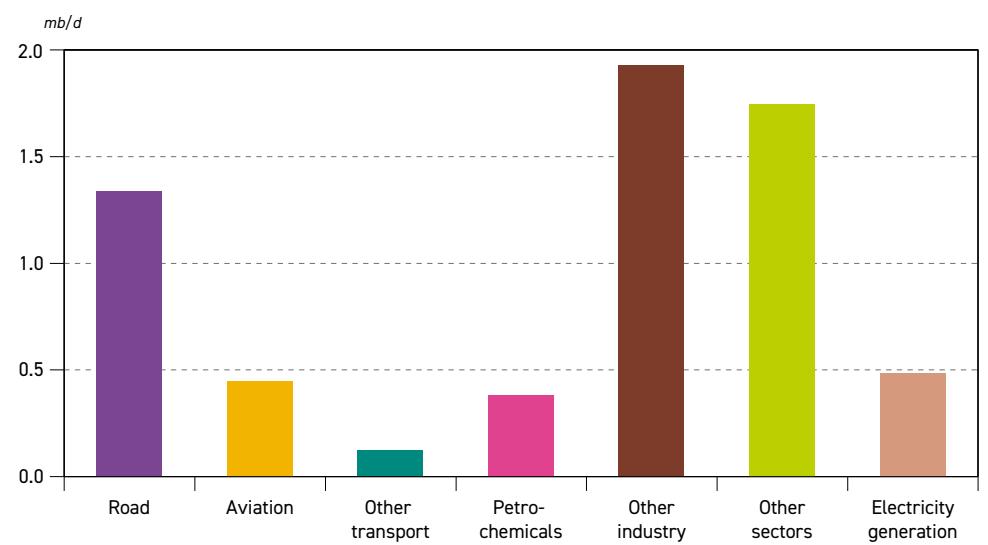
Source: OPEC.

Moreover, because of the varying responses to this higher economic growth, the impact on oil demand in the OECD and non-OECD differs significantly, as presented in Figure 7.11. The figure shows that a large part of the incremental demand in the EGS is projected for non-OECD countries. Oil demand in this region grows from 58 mb/d in 2024 to more than 90 mb/d in 2050, which is almost 5 mb/d higher than in the Reference Case. This strong demand growth is driven by rapid economic expansion, which fosters a larger middle class and accelerates urbanization and industrialization. Part of this development involves increased investments in expanding the electricity grid and related infrastructure, which, in turn, helps improve mobility and access to electricity and modern energy sources, including LPG.

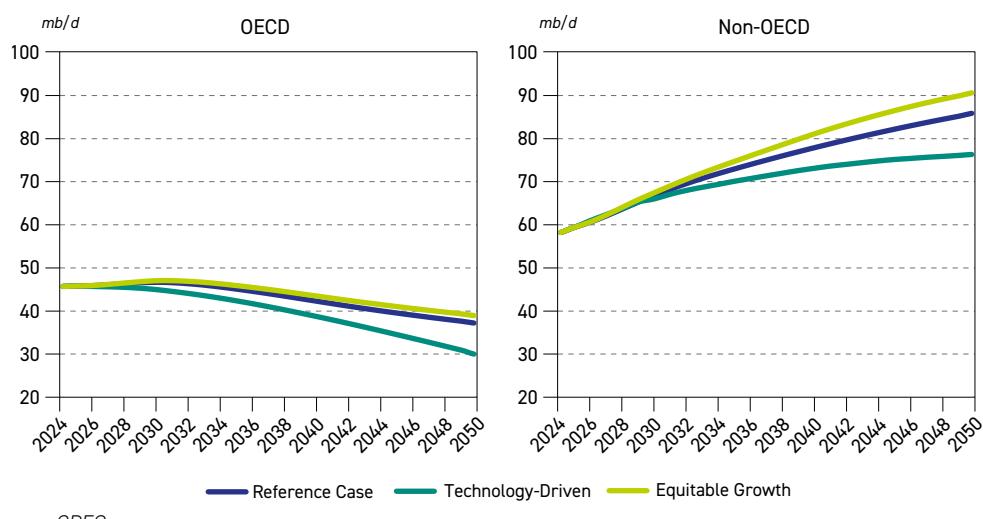
Liquids demand in the Reference Case and alternative scenarios, 2024–2050
Source: OPEC.
Demand changes in OECD countries are projected to be much lower, estimated at less than 2 mb/d by 2050, compared to the Reference Case. There are two main reasons for a limited impact of the EGS narrative on oil demand in this region. The first one is that the scenario's accelerated GDP growth is biased toward developing countries and only slightly impacts OECD countries. Secondly, potentially higher oil demand (due to faster GDP growth) in these countries is somewhat mitigated by additional policy measures aimed at reducing emissions, the quicker adoption of efficient technologies and the more rapid growth of renewable energy compared to the Reference Case. Besides affecting oil demand, these measures also limit the gas demand growth and further accelerates the reduction in coal demand in this scenario.
Finally, Figure 7.11 shows OECD and non-OECD demand in the TDS. In this case, oil demand in both major regions is significantly affected, albeit with a differentiated impact. In the OECD, oil substitution by electricity and gas, combined with efficiency improvements – mainly in the road transportation and industrial sectors – consistently drives oil demand to lower levels. The difference to Reference Case levels evolves relatively fast, reaching almost 3 mb/d by 2035 and progressing to around 7 mb/d by 2050, representing a demand reduction of almost 20%.

In the case of non-OECD countries, oil demand in this scenario is relatively less affected. In the period to 2035, the demand reduction is mostly linked to a growing number of EVs, efficiency improvements and oil substitution in China, while limited change occurs in other developing countries. This, however, gradually changes in the second part of the outlook period as EVs and more efficient technologies begin to penetrate non-OECD markets too. Consequently, non-OECD demand growth decelerates significantly and starts plateauing somewhere in the range of 75 mb/d, as opposed to the continued growth projected in the EGS and the Reference Case. As a result, non-OECD oil demand in this scenario is projected to be around 9 mb/d lower than the corresponding Reference Case demand in 2050. In relative terms, however, this represents a reduction of just around 11%, much lower compared to OECD demand.
7.3 Dialogue, open-minded analysis and transparency help to map out our common energy future
In addition to its regularly updated Reference Case projections, OPEC's WOO has always featured alternative scenarios. Building on this in 2025, this year's edition includes the TDS and EGS, not just as an intellectual exercise, but to highlight some overarching points.
More broadly, OPEC's WOO serves as a platform for dialogue with our readership, and represents an effort to engage, question, discuss and debate. This year's scenarios reaffirm the importance of dialogue and cooperation between the various industry stakeholders to better understand – and take timely and inclusive action – to meet the huge challenges we face together. While OPEC's dialogue programmes include structured discussions with a variety of stakeholders like governments, agencies, and private companies, our publications like the WOO – free and readily available – serve as an important dialogue with an even wider readership of individuals.
Including alternative scenarios in the WOO also highlights the key values underpinning the Organization's research work – namely, that only open-minded, data-driven analysis can be the right starting point from which to address such a broad, inter-connected and overarching issue as the world's long-term energy outlook. In this regard, spelling out the economic, policy-related and technology assumptions that underpin our scenarios, as well as clearly mapping out the underlying – and resulting – narrative, explains our thinking behind why and how specific scenarios should be considered.
In the end this all serves to showcase yet another one of OPEC's key ambitions, namely to provide full transparency in our research work and findings. Anybody can question and criticize results and outcomes, but it is a more worthwhile and useful exercise – and indeed is only properly feasible – to challenge them when they are accompanied by detailed assumptions and reasoning that underpin alternative scenarios.

7
Focus on Brazil
Key takeaways
- The oil industry accounts for 17.2% of Brazil's industrial GDP and sustains 1.6 million jobs. Among Brazil's main exports, oil stands out by accounting for 13% of total revenue, indicating the significance of the energy sector for the country.
- Brazil is one of the world's most populous countries, with 212 million people and an urbanization rate of 87%. The country ranks as the world's seventh largest economy, with a GDP of USD $4.1 trillion in 2024 (2021 PPP).
- Between 2024 and 2050, Brazil's primary energy demand is projected to experience steady and substantial growth, increasing from 6.5 mboe/d to 9.8 mboe/d.
- Among renewable energy sources, the outlook indicates a clear trend of expansion and diversification. Biomass, a well-established component of Brazil's energy mix, is projected to grow from 2.2 mboe/d to 2.8 mboe/d – equivalent to a 25% increase.
- Oil demand in Brazil is projected to increase from 3.4 mb/d in 2024 to 4.8 mb/d by 2050, representing cumulative growth of around 40% over the period.
- Between 2010 and 2024, total liquids production almost doubled in Brazil, rising to 4.2 mb/d in 2024. Importantly, it is also set to be one of the main sources of future non-DoC liquids supply growth, with output projected to peak at around 5.8 mb/d in the late 2030s.
- Crude oil production in the Equatorial Margin region could add 1.1 mb/d to national supply starting in 2029, playing a strategic role in replenishing Brazil's reserves and ensuring long-term production sustainability.
- Brazil ranks ninth globally in refining capacity, with 18 refineries and an installed capacity of 2.4 mb/d. The growth of biofuels can prolong the operational life of the country's refineries by leveraging existing distribution and supply infrastructure.
- Brazil is a global energy leader, with 49% of its primary energy supply and nearly 90% of its electricity from renewables – well above the global average. The country has introduced key policies driving renewable energy, including the Future Fuels Law and the regulation of offshore wind and CCUS, where the oil and gas sector will leverage its expertise.
- The 2024 G20 Summit, chaired by Brazil, indicated the need to reform the international financial architecture so that it can address the urgent challenge of sustainable development, climate change and poverty eradication.
- Brazil's COP30 presidency in 2025 aims to strengthen climate finance, emphasizing that at least $1.3 trillion per year is needed by 2035 for developing countries to invest in mitigation and adaptation.
8
Brazil is one of the largest economies in the world and an energy powerhouse, thanks to its oil and natural gas reserves, abundant natural resources, and well-developed energy industry. The country plays a significant role in various international organizations that focus on economic development and the energy sector, and is one of the key drivers in central debates. The Brazilian oil industry emerged in 1954, with the initiation of research, exploration, and refining activities within the country. Major growth in the upstream sector occurred later, following the discovery of significant offshore oil reserves starting in the 1970s, particularly in the Campos Basin (State of Rio de Janeiro). In 2006, the "Pré-sal" (pre-salt) oil fields were discovered, covering an area of 149,000 km2 off the Brazilian coast between the states of Santa Catarina and Espírito Santo, containing enormous oil reserves. These discoveries positioned the country among the world's largest holders of reserves and contributed to production growth.
The oil sector accounts for 17.2% of Brazil's industrial GDP and sustains 1.6 million jobs. In 2023, Brazil was the eighth largest oil exporter in the world. In 2024, oil became the country's top export product, totalling $44.8 billion in exports (13.3% of total exports). According to the Ministry of Development, Industry, Commerce and Services, China is the primary buyer of Brazilian oil (approximately 44% of exports), followed by the US (around 12%). It is also important to highlight that Brazil is a major producer of electricity from renewable and low-carbon sources, making its energy mix diversified and strengthening its leadership in the sustainability debate.
In light of these facts, it is evident that Brazil is one of the key players in the global energy sector – not only in energy supply but also in the development of new technologies and in guiding changes within the sector. Thus, this special chapter aims to present a detailed look at the Brazilian energy sector.
8.1 Specifics of Brazil
Brazil is a country with a continental dimension, with an extensive territory of 8.5 million square kilometres, making it the fifth-largest country in the world by land area. It is also the seventhmost populous country, with a population of 212 million people in 2024.
The country's significant population growth in absolute numbers occurred between the 1970s and 1980s, when there was an increase of 28 million people, followed by a period of stability. Despite Brazil's large physical size, its population is concentrated in the Southeast, South and Northeast regions, primarily in areas near the coast, where most of the country's natural resource reserves (such as oil, natural gas, and minerals) are being developed. These regions also house the largest urban areas, a significant portion of the industrial sector in the Southeast and South regions and the majority of the country's largest companies.
Approximately 65.7 million people, or 31% of the total population, live in 48 cities with populations greater than 500,000, indicating the high level of urbanization in Brazil, with about 87% of the population residing in urban centres. Thus, Brazil's economic activity is concentrated in large cities and industrial hubs in the regions closest to the Brazilian coastline.
Regarding Brazil's economy, the country ranks as the seventh largest economy in the world, with a GDP of $4.1 trillion in 2024 (2021 PPP). As one of the largest economies in the world, Brazil is a member of the G20, participating in discussions on economic policy, international trade, governance, and global development. Brazil is also a founding member of BRICS (Brazil, Russia, India, China, South Africa), the forum for discussions on issues relevant to emerging
economies, which collectively account for around 37% of the global economy and 26% of global trade (WEF, 2024).
Specifically concerning the recent performance of the Brazilian economy, its real GDP grew by approximately 3.4% in 2024, driven by increased consumption and supported by an expanding labour market and the recovery of investment levels. Projections for the coming years indicate that Brazil's GDP will grow by 34% between 2023 and 2035, reaching $5.4 trillion, with growth of 64% from 2023 to 2050, when it is expected to reach approximately $6.6 trillion.
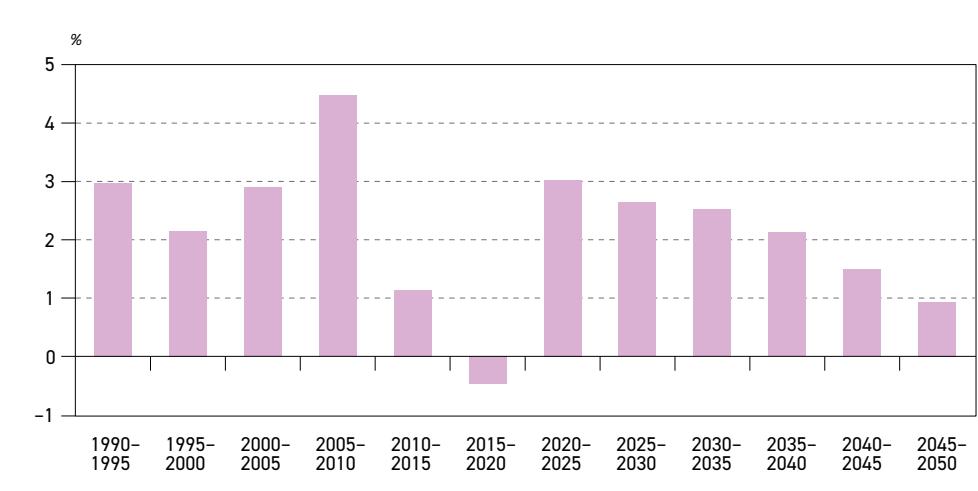
Figure 8.1 Brazil GDP average annual growth rates, 1990–2050
Source: OPEC.
The Brazilian economy has its particularities, resulting from the abundance of natural resources, favourable climatic conditions for agriculture and the presence of a sizable industrial sector. A significant portion of the Brazilian economy is based on commodities, primarily produced for export, with notable emphasis on petroleum, soybeans and their derivatives, iron ore and other minerals. In Brazil's economy, the services sector accounts for 69% of GDP, followed by the industrial sector, which represents 25%, and the agribusiness sector, with a 6.5% share.
Figure 8.2 Composition of Brazil's GDP, 2024
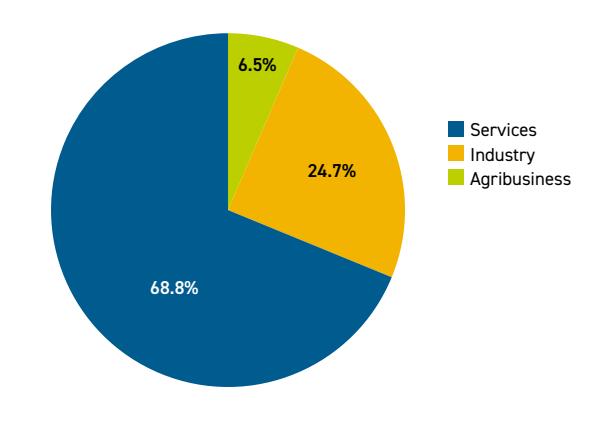
Source: IBGE, 2024
8
It is important to highlight that the industrial sector is highly relevant to the Brazilian economy, serving as a lever for its production system. Industry is a strategic economic sector for global economies due to the value-added nature of its products, the generation of high-income jobs and technological development related to production.
The Brazilian industrial sector is diversified, with significant segments such as energy, textiles, pulp and paper, construction and electronics. It is noteworthy that the oil and gas industry accounts for 17.2% of the industrial sector, possessing an extensive production chain that branches out into various segments. Thus, the importance of the oil and gas sector extends to a large portion of the national economy.
The Brazilian economy is integrated into international trade, offering a wide range of products and services to various countries and economic blocs. Between 2014 and 2024, Brazil's trade with the world grew from $452 billion in 2014 to $600 billion in 2024, representing approximate growth of 33%. Exports during this period increased from $221 billion in 2014 to $337 billion in 2024, reflecting growth of 53%.
In 2024, Brazil's trade with the world reached about $600 billion. Of this total, $337 billion were exports and $263 billion were imports, resulting in a trade surplus of $74 billion. Of the total exports, 28% went to China, making it the largest buyer of Brazilian products. The US, as the second-largest buyer, accounted for 12% of Brazil's exports, followed by Argentina at 4.1%. The European Union accounted for a share of 14% of Brazilian exports, making it an important trade partner.
Among Brazil's main exports, oil stands out, accounting for approximately 13.3% of exports, indicating the significance of the energy sector for the country. The second-largest export product is soybeans and their derivatives, representing 12.7% of exports, showcasing Brazil's strong agricultural sector and its role as a major global supplier of agricultural products.
Amid a backdrop of ever-expanding exports, Brazil has consolidated itself as a major global supplier of commodities, as well as a wide range of other products. Brazilian international trade is crucial for the development of the national economy, integrating the country into important global value chains.
8.2 Primary energy demand
As the eighth-largest energy consumer in the world, Brazil possesses a highly diversified primary energy demand mix, reflecting both the country's abundant natural resources and its balanced integration of fossil and renewable energy sources.
Between 2024 and 2050, Brazil's primary energy demand is projected to experience steady and substantial growth, increasing from 6.5 mboe/d to 9.8 mboe/d. This represents a cumulative expansion of approximately 50%, driven by economic development, structural changes in the country's industrial base, rapid urbanization and rising energy demand associated with social and technological advancement.
Oil is expected to retain its leading position within the Brazilian energy mix, with demand increasing from 2.3 mboe/d in 2024 to 3.1 mboe/d by 2050 (in primary energy terms) – representing overall growth of 31%. Although its share in the total energy mix is projected to

Table 8.1 Primary energy demand, Brazil
| Levels | Growth | Fuel share | |||||||
| (mboe/d) | (mboe/d) | (%) | |||||||
| 2024 | 2030 | 2035 | 2040 | 2045 | 2050 | 2024–2050 | 2024 | 2050 | |
| Coal | 0.3 | 0.3 | 0.3 | 0.3 | 0.3 | 0.3 | 0.0 | 4.6 | 3.1 |
| Natural gas | 0.6 | 0.7 | 0.8 | 1.0 | 1.1 | 1.2 | 0.6 | 9.2 | 12.2 |
| Oil | 2.3 | 2.6 | 2.8 | 2.9 | 3.0 | 3.1 | 0.8 | 35.4 | 31.6 |
| Nuclear | 0.1 | 0.1 | 0.1 | 0.1 | 0.1 | 0.1 | 0.0 | 1.5 | 1.0 |
| Renewables | 3.2 | 3.9 | 4.3 | 4.7 | 5.0 | 5.1 | 1.9 | 49.2 | 52.0 |
| of which: Hydro | 0.8 | 0.9 | 1.0 | 1.1 | 1.2 | 1.3 | 0.5 | 12.3 | 13.3 |
| of which: Biomass | 2.2 | 2.5 | 2.6 | 2.7 | 2.8 | 2.8 | 0.6 | 33.8 | 28.6 |
| of which: Other renewables (mainly solar and wind) | 0.2 | 0.5 | 0.7 | 0.9 | 1.0 | 1.0 | 0.8 | 3.1 | 10.2 |
| Total | 6.5 | 7.6 | 8.3 | 9.0 | 9.5 | 9.8 | 3.3 | 100.0 | 100.0 |
Source: OPEC.
Figure 8.3 Primary energy demand, Brazil
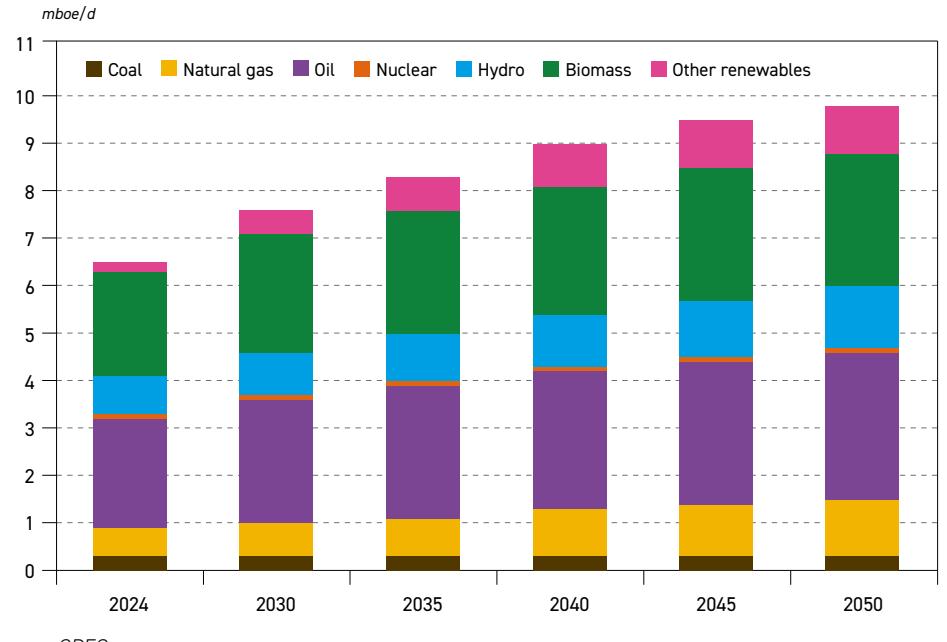
Source: OPEC.
8 decline slightly from 36% to 31%, oil will remain the cornerstone of energy supply, particularly in sectors where substitution remains technologically or economically constrained.
Natural gas is expected to emerge as the fastest-growing energy source, with demand nearly doubling from 0.6 mboe/d to 1.2 mboe/d – an increase of 93%. Its share in the energy mix is expected to rise from 10% to 13%, underscoring its role as a strategic transition fuel. Natural gas provides flexibility, ensures security of supply, and emits significantly less CO2 than coal, making it a critical component of a lower-carbon energy pathway.

Among renewable sources, a clear trend of expansion and diversification is expected. Biomass, a well-established component of Brazil's energy mix, is projected to grow from 2.2 mboe/d to 2.8 mboe/d – equivalent to a 25% increase. Despite this, its share in the overall mix is set to decline from 34% to 28%, suggesting the growing relevance of other renewable technologies.
Hydropower is also anticipated to maintain a positive trajectory, increasing from 0.8 mboe/d to 1.3 mboe/d (+72%), with its share in the mix rising slightly from 12% to 13%. Hydropower remains the backbone of the national electricity sector, offering dispatchable, low-emission energy on a large scale.
The most notable transformation, however, will take place in the category of "other renewables", primarily comprised of solar and wind energy. This segment is forecast to grow from 0.2 mboe/d to 1.0 mboe/d – an impressive increase of 317%. As a result, its share in the energy mix will expand from 4% in 2024 to 10% by 2050, reflecting Brazil's accelerating transition towards a more diversified and lower-carbon energy mix.
Less prominent sources in the Brazilian energy mix are also expected to show incremental developments. Nuclear energy, despite its modest initial base of 0.1 mboe/d, is projected to grow by 62% while maintaining a stable 1% share in the total mix. Meanwhile, coal consumption is expected to remain flat at 0.3 mboe/d throughout the period. Its share in the mix is forecast to decline from 4% to 3%, indicating coal's gradual displacement by alternatives.
In summary, Brazil's primary energy mix is expected to remain highly diversified through 2050, with increasing penetration of renewable energy sources. While oil will continue to play a central role in meeting the country's energy needs, the growing contribution of solar, wind, and other renewables highlights a structural shift toward a more sustainable energy future. Natural gas is set to function as a vital transitional fuel, whereas coal and nuclear will retain only marginal shares. These projections reinforce Brazil's position as one of the major economies with a predominantly renewable energy base and point to the country's potential to further advance energy decarbonization and ensure long-term energy security.
8.3 Oil demand
Since the 1950s, Brazil's transport model has maintained a strong emphasis on road-based logistics, as part of a broader national strategy for industrialization and the development of a robust automotive industry. The expansion of an extensive network of highways spanning the national territory has served to consolidate the dominance of road transport, which today remains the backbone of freight logistics in the country.
The predominance of the road transport sector has direct implications for the country's fuel consumption mix, with diesel oil playing a particularly central role. Diesel is predominantly used by heavy-duty vehicles, such as trucks and buses, which are essential for longdistance freight and public transport. This dynamic is closely tied to the structure of Brazil's productive base, which is characterized by a strong reliance on agribusiness. As a leading driver of national economic growth, the agribusiness sector depends heavily on road transport to move agricultural commodities from inland production hubs to exportoriented ports.
As such, demand for oil is intrinsically linked to both domestic production and external trade flows. In 2024, oil demand increased by 2.8%, year-on-year, to 3.4 mb/d, underscoring the sector's resilience in the face of challenging environmental conditions.
Unfavourable weather patterns, intensified by the El Niño phenomenon, significantly impacted the 2023/2024 soybean and grain harvests, leading to a reduction in transported volumes. According to data from the National Observatory for Transport and Logistics, the movement of soybeans, corn and soybean meal declined by 10.3% over the year, directly constraining road freight activity.
Despite the slowdown in agricultural logistics, overall freight demand was sustained by the positive performance of other sectors throughout 2024. The construction sector, as reported by the Brazilian Chamber of the Construction Industry (CBIC), recorded a 4.1% expansion, which drove increased movement of materials and equipment and helped to support fuel consumption. In addition, extractive and manufacturing industries registered growth in export volumes, further strengthening logistics activity and associated energy and oil demand.
Oil demand in Brazil is projected to increase from 3.4 mb/d in 2024 to 4.8 mb/d by 2050, representing a cumulative increase of 40% over this period. This upward trajectory reflects the sustained relevance of liquid fuels in key sectors such as road freight, aviation and industrial processes.
The road transport sector is projected to remain the dominant force in demand growth through 2050, with overall demand rising from 2.2 mb/d in 2014 to 3.3 mb/d by 2050 – an increase of around 46% over the outlook period. However, the aviation sector is expected to be the fastest-growing segment, with jet/kerosene demand projected to increase by 58%,
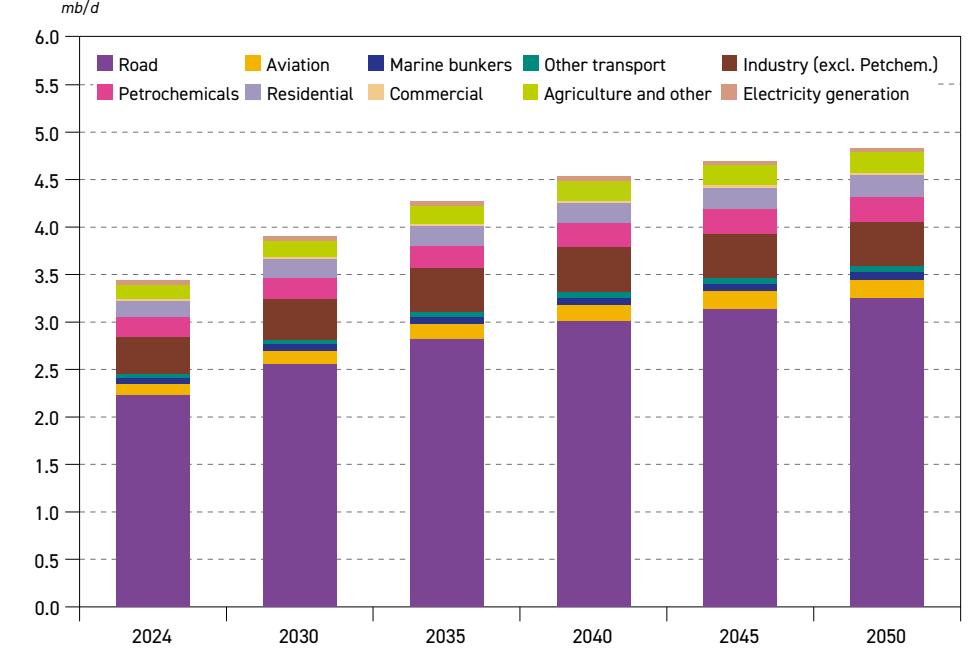
Figure 8.4 Oil demand in Brazil by sector, 2024–2050
Source: OPEC.
8
from 120 tb/d in 2024 to 190 tb/d by 2050. This growth is driven by the sustained expansion of both passenger air travel and air cargo. In contrast, the only sector anticipated to undergo a structural decline in oil consumption is electricity generation, where demand is expected to contract by 15%, reflecting broader decarbonization trends and the progressive shift toward renewable energy sources.
In terms of market share, the sectoral distribution of oil demand is expected to remain relatively stable through 2050, with no significant shifts anticipated in the overall composition of demand across major end-use sectors.

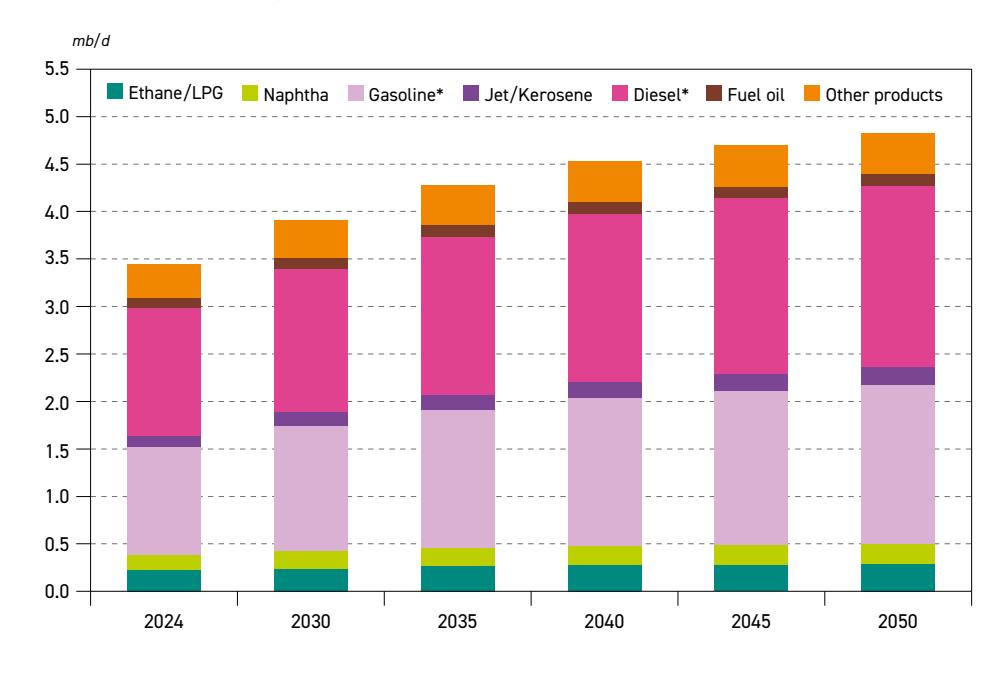
Oil demand in Brazil by product, 2024–2050
*Gasoline includes ethanol blends, and diesel includes biodiesel blends. Source: OPEC.
Within Brazil's fuel demand structure, diesel and gasoline remain the predominant fuels, reflecting the country's long-standing reliance on road-based transport systems. Diesel consumption is largely driven by heavy-duty vehicles engaged in freight distribution and agricultural logistics, whereas gasoline demand is primarily associated with light-duty vehicles used for passenger transport.
Looking ahead, diesel demand is projected to increase from 1.3 mb/d in 2024 to 1.9 mb/d by 2050, representing cumulative growth of 42%. Similarly, gasoline demand is expected to rise from 1.1 mb/d in 2024 to 1.7 mb/d by 2050, marking a 48% increase. These projections underscore the continued importance of both fuels in sustaining the country's mobility and logistics framework over the long term.
Rising activity in the aviation sector is expected to drive a significant increase in demand for jet kerosene, positioning it as the fastest-growing refined product over the forecast horizon. Jet fuel consumption is projected to expand by 58% between 2024 and 2050.

8.4 Liquids supply
The production of petroleum derivatives and other liquid fuels has been crucial for ensuring Brazil's energy security and economic growth in recent decades. Between 2010 and 2024, this production nearly doubled, increasing from 2.6 mb/d to 4.2 mb/d, and is projected to plateau at around 5.8 mb/d in the late 2030s.
Of the total liquid fuels produced, approximately 80% are derived from petroleum. This importance is primarily due to the fundamental role that petroleum derivatives play in the energy mix of the transportation sector, which is predominantly road-based in Brazil.
From 2010 to 2024, crude oil production in the country rose from 2.1 mb/d to 3.4 mb/d. This growth has solidified Brazil as a net exporter of these resources, with crude oil being the main export item in 2024, totalling $45 billion in exports – representing 13.3% of total exports – contributing significantly to the trade balance surplus, according to the Brazilian Ministry of Development, Industry, Trade and Services (MDIC).
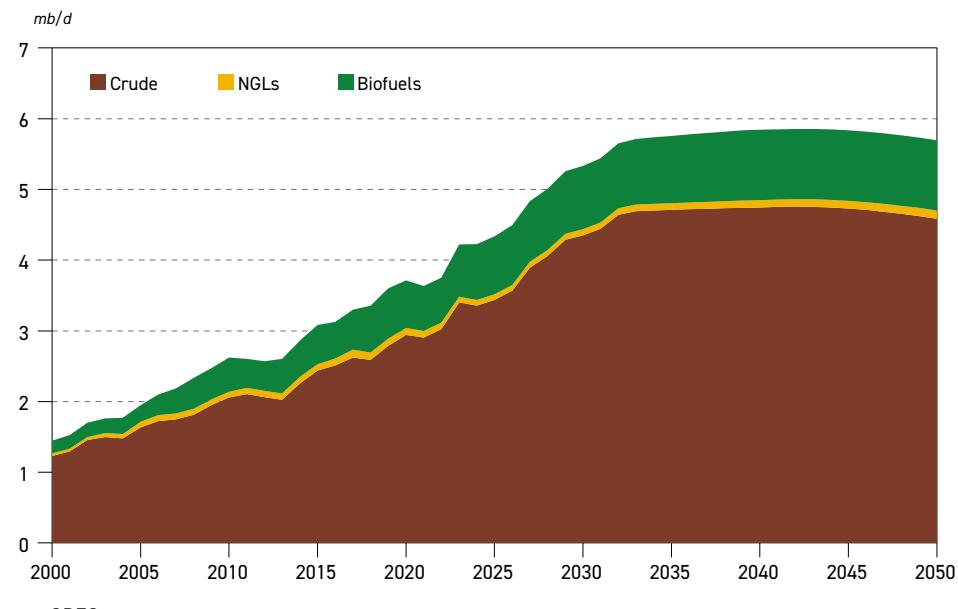
Figure 8.6 Brazil total liquids production outlook
Source: OPEC.
Given the quality of the crude oil produced in Brazil – characterized by a lower intensity of CO2 emissions in the production process than the global average – and advancements made in the exploration and utilization of petroleum resources, it is expected that the country will continue to increase its share in global oil supply.
In this context, it is estimated that crude oil production will surpass 4 mb/d in 2028 and plateau at around 4.7 mb/d throughout the 2030s, after which it is expected to decline modestly to 4.6 mb/d by 2050. The projected growth will be driven by the commencement of 17 new exploration and production projects by 2030, particularly in the pre-salt region, which collectively are expected to have a production capacity exceeding 2.9 mb/d.

In the long term, Brazil may also expand its production through the exploration of resources in new frontier basins, such as the Equatorial Margin, where significant volumes of recoverable resources are estimated.
Additionally, the production of biofuels represents an important energy source for ensuring supply security and decarbonizing the Brazilian transportation sector. Between 2010 and 2024, the production of ethanol and biodiesel rose from 480 tb/d to 790 tb/d. In the long term, it is expected that the production of these energy sources will continue to grow, peaking at approximately 1 mb/d in the late 2030s, and remaining stable at this level until 2050.
Moreover, there is also the production of NGLs, which has remained flat at around 80 tb/d since 2010. By 2050, however, this is expected to reach about 120 tb/d. It is important to note that the incorporation of biofuels and natural gas into the country's energy mix, supported by specific policies, will contribute to the gradual process of energy transition.
Box 8.1 The Equatorial Margin: A New Frontier for Brazil's Offshore Exploration
The Equatorial Margin is Brazil's newest offshore frontier for the exploration of oil and gas. Stretching over 2,200 kilometres, from the far north of the state of Amapá to the coastline of Rio Grande do Norte, the region encompasses five sedimentary basins: Foz do Amazonas, Pará-Maranhão, Barreirinhas, Ceará and Potiguar. Its potential for reserves has attracted growing interest, driven by large discoveries in geologically similar areas in Guyana and Suriname. The National Agency of Petroleum, Natural Gas and Biofuels (ANP) estimates that the Equatorial Margin may contain approximately 30 billion barrels of oil equivalent (boe). Studies indicate that production in the region could add 1.1 mb/d to national supply starting in 2029, playing a strategic role in replenishing Brazil's reserves and ensuring long-term production sustainability.
The first drilling operations in the Equatorial Margin took place in the 1970s, but did not result in large-scale commercial discoveries. To date, most exploratory activities have been conducted in shallow waters, though there is growing expectation of significant reserves in deep waters. The most recent exploratory wells were drilled between 2010 and 2015, distributed across the basins of Foz do Amazonas, Pará-Maranhão, Barreirinhas, Ceará, and Potiguar. Renewed interest in the region is reflected in planned investments by Petrobras. As per its 2025–2029 Business Plan, the company intends to allocate $3 billion and drill 15 new wells in the next five years. Petrobras has already drilled more than 700 wells in the Equatorial Margin and plans to drill 42 new exploratory wells between 2023 and 2027, 16 of which will specifically target the Equatorial Margin.
The exploration of the Equatorial Margin could play a central role in Brazil's future energy landscape. With the natural decline in production from traditional basins, such as Santos and Campos, the region may become a vital source of production to maintain output levels from the 2030s onward. Moreover, monetizing these resources could contribute to job creation and income generation, boosting the economy, particularly in the North and Northeast regions of the country. Given the strategic location of these sedimentary basins along Brazil's northern coastline, exploration could stimulate
investments in infrastructure and strengthen the energy sector in areas away from the current production hubs, helping to reduce regional inequalities.
Petrobras plans to begin drilling new wells in the Equatorial Margin in 2026, starting with the Foz do Amazonas and Pará-Maranhão basins. The first well will be drilled more than 160 km from the coast and 500 km from the mouth of the Amazon River, with a water depth of 2,880 metres. Despite the region's significant potential, exploration in the Equatorial Margin faces technical and environmental challenges. The area requires substantial investments in technology and operational safety, in addition to ensuring environmental sustainability to minimize potential impacts. The development of infrastructure for transportation and refining will also be a crucial factor for the commercial viability of production. If successful, the Equatorial Margin could establish Brazil as one of the world's leading offshore exploration hubs, ensuring energy security, diversifying supply, and creating new economic opportunities for the coming decades.
8.5 Refining sector
Brazil's oil refining industry has evolved significantly, shaping the country's energy sector. Emerging on a small scale in the 1930s, it expanded between the 1950s and 1980s through major investments. A modernization wave in the 2000s improved fuel quality and reduced emissions. Nowadays, Brazil ranks ninth globally in refining capacity, with 18 refineries and an installed capacity of 2.4 mb/d.

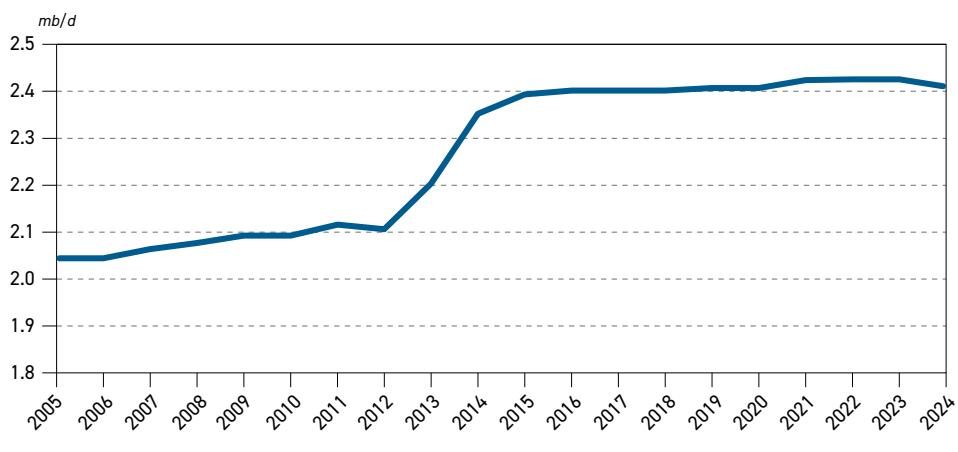
Source: IBP based on data from ANP, 2025.
Most of the country's refineries, built between the 1950s and 1980s, were designed to process light crude oil, necessitating a steady flow of imports. However, the discovery and development of pre-salt fields – known for their lighter crude – have gradually reduced the country's reliance on imported crude oil.

8
Figure 8.8 Brazil refinery throughput
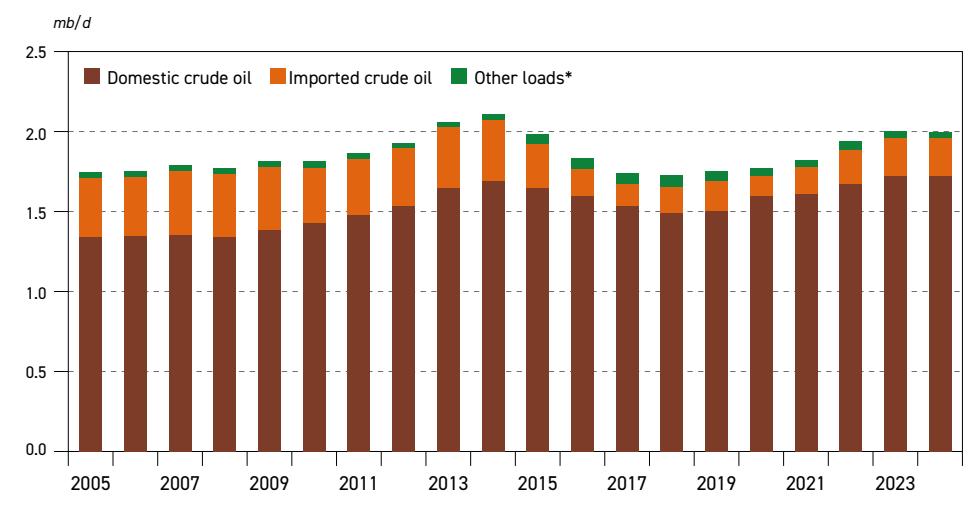
* Includes residues from petroleum, terminals, and derivatives reprocessed in atmospheric distillation units with crude oil and condensate.
Source: IBP based on data from ANP, 2025.
Figure 8.9 Production profile of refined products
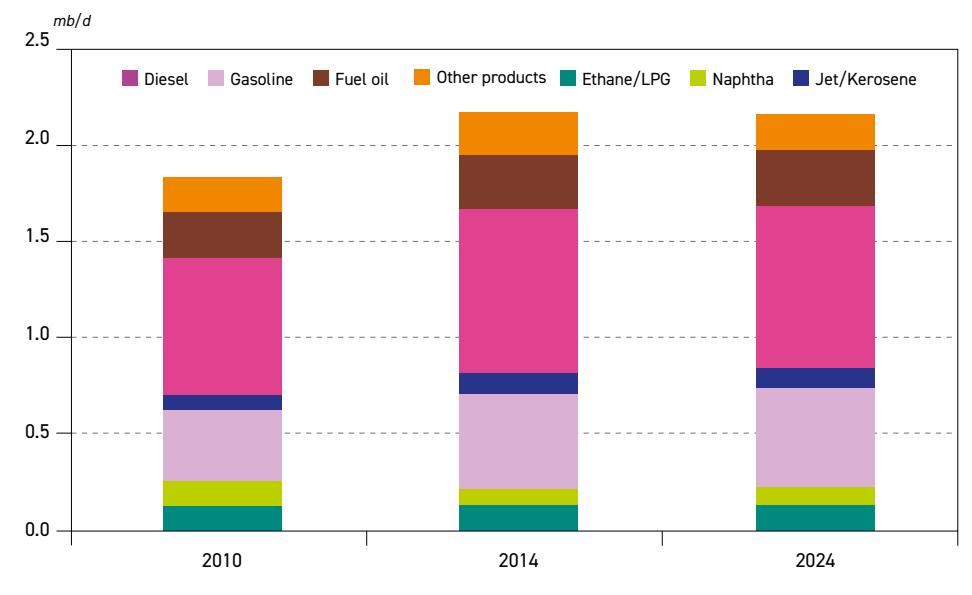
Source: IBP based on ANP data, 2025.
Brazil's refining capacity is primarily concentrated along the coast, with the Southeast region accounting for 60% of capacity, followed by the South and Northeast with 19% each, and the North with 2%. The Central-West region has no refineries.
Brazil's refining sector is economically constrained by the conversion capacity of its refineries, resulting in an effective capacity that is, in practice, lower than the nominal capacity.
Combined with strong domestic demand, this limitation has historically made Brazil a net refined product importer, particularly for diesel, due to the country's heavy reliance on road transport for logistics.

Figure 8.10 Imports of refined oil products
Source: IBP based on ANP data, 2025.
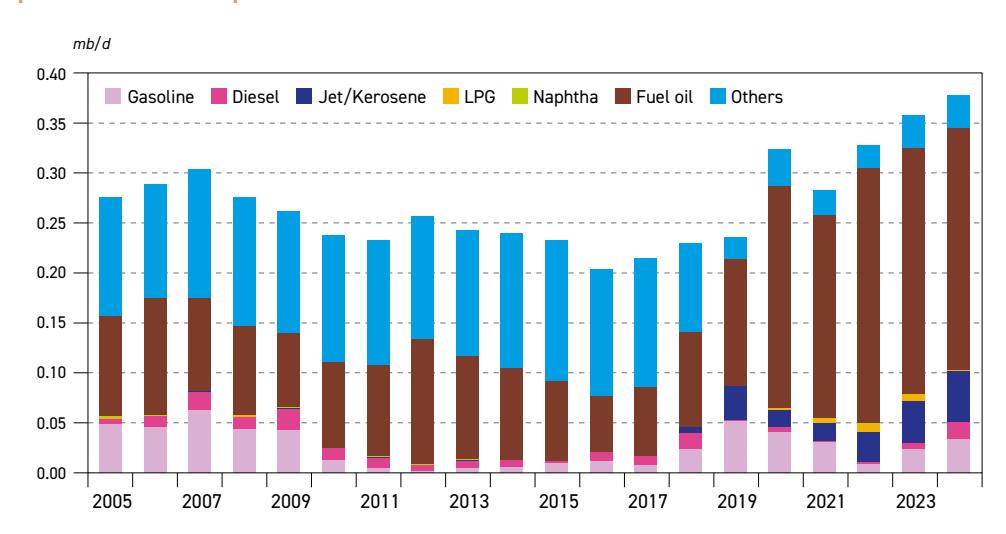
Figure 8.11 Exports of refined oil products
Source: IBP based on data from ANP, 2025.
Conversely, Brazil has a surplus of heavier petroleum products, such as asphalt and fuel oil, creating export opportunities. According to the Brazilian government's Energy Research Company (EPE), fuel oil exports have risen significantly since 2020, driven by the commercial demand for low-sulphur bunker fuel in compliance with IMO 2020 regulations. The country

is also increasingly focused on decarbonization and pollutant reduction measures in its national refineries. In 2021, the production of diesel with 10 part per million (ppm) sulphur content (S10) surpassed that of diesel with 500 ppm. According to the Ten-Year Energy Expansion Plan (PDE 2034) by the EPE, the share of S10 diesel in national production is expected to exceed 85% by 2031, with the implementation of hydrotreatment units in the country's refining sector.
One of the initiatives to decarbonize petroleum products underway in Brazil is the co-processing of vegetable oil and crude oil in hydrotreating units. This process can be carried out at five Petrobras refineries to produce diesel with 5% renewable content (R5), which together have an installed production capacity of 63 tb/d.
Beyond their role in emissions reduction, biofuels also present an opportunity to enhance the efficiency and longevity of Brazil's refining sector. This approach enhances asset utilization, avoids costly new investments and supports a gradual transition to a low-carbon economy, ensuring both environmental and industrial sustainability.
8.6 Renewables and other energy sources: Brazil's energy policies, climate change and sustainable development
Brazil stands out as a global energy leader, thanks to its vast natural resources and highly diversified energy mix, where renewable sources play a dominant role. Unlike many countries where the energy sector is the largest source of CO2 emissions, Brazil's reliance on renewables (including hydropower) keeps its energy-related emissions comparatively lower. Even so, the oil and gas sector remains essential for the country's energy security and economic development, ensuring a stable supply and generating significant revenues. Additionally, this sector plays a key role in driving investments in renewable energy, strengthening Brazil's position in a balanced and sustainable energy transition.
This section examines Brazil's renewable energy production, emphasizing the distinctive features of its energy and electricity mix. The discussion also underscores the role of public policies in fostering the growth of renewable energy, with a focus on strategies aimed at diversifying the energy mix and mitigating greenhouse gas emissions.
8.6.1 Energy mix
Brazil stands out as a global energy powerhouse, distinguished by its vast natural resources and energy mix with one of the highest shares of renewable energy in the world. Renewable sources – including hydro, biomass, solar, wind, and others – account for 49% of the country's total energy demand, a share that far exceeds the global average of 15%. This reliance on renewables highlights Brazil's strong commitment to sustainable energy development and its leadership in the global energy transition.
The oil and gas sector plays a crucial role in Brazil's energy supply, accounting for 46% of the energy provided. Additionally, Brazil's oil and gas reserves, particularly offshore fields, position the country as a major player in the global energy market. The sector's continued development and modernization are integral to maintaining energy security, fostering economic growth and ensuring the stability of Brazil's energy mix, which remains essential for both domestic consumption and export.

Figure 8.12 Share of primary energy demand in Brazil, 2024
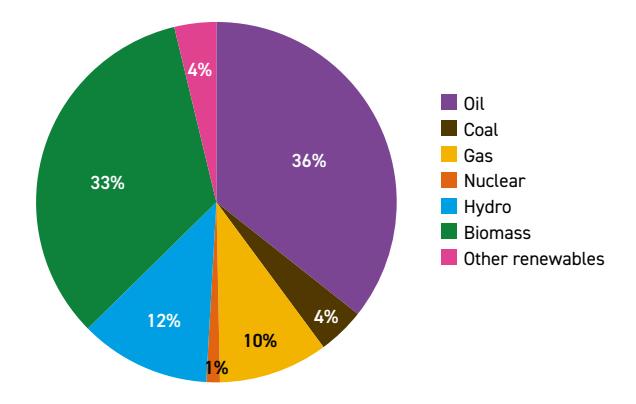
Source: OPEC.
Simultaneously, an analysis of Brazil's electricity mix underscores the prominence of renewable energy sources, with 87% of the country's electricity supply originating from renewables (Figure 8.13). This share positions Brazil as a global frontrunner in renewable energy adoption, largely driven by its hydropower capacities.
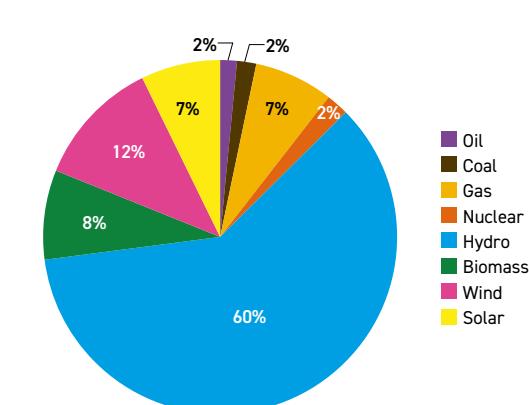
Figure 8.13
Share of primary sources in Brazil's electricity generation, 2024
Source: OPEC.
8.6.2 Hydropower
Brazil's natural characteristics provide a significant advantage for hydropower development, making it a cornerstone of the country's electricity generation system. Abundant river basins, favourable topography and high rainfall patterns enable Brazil to harness hydropower on a large scale, which currently accounts for approximately 60% of the nation's total electricity demand, as illustrated in the graph above.
As the second-largest producer of hydroelectric power globally, behind only China, Brazil is home to some of the world's largest hydroelectric plants, including Itaipu Binacional (14 GW) and Belo Monte (11.2 GW).
Hydropower integration is supported by the National Interconnected System (SIN), a vast network that connects Brazil's electricity generation, transmission, and distribution

infrastructure. This synchronized system, comprising transmission lines, substations, and power plants from various energy sources – including hydropower, thermal, wind, solar, and biomass – enables dynamic management of electricity supply and demand across regions.
As one of the world's largest interconnected systems in both geographic scope and installed capacity, the SIN plays a crucial role in optimizing Brazil's energy resources. Its centralized operation, coordinated by the National Electric System Operator (ONS), ensures the efficient dispatch of electricity from the most cost-effective and sustainable sources. The system also facilitates regional electricity exchanges, balancing surplus generation with demand, especially during hydrological shortages.
However, the growing share of intermittent renewables, such as wind and solar power, has introduced new challenges. This transition requires hydropower and thermal plants to operate more flexibly, adjusting their output more frequently and within shorter intervals to maintain grid stability. Hydropower's flexibility in responding to demand fluctuations and other generation variations is essential to ensuring a reliable and resilient electricity supply during the energy transition.
8.6.3 Wind power
Wind power has emerged as a key pillar of Brazil's electricity sector, now accounting for 12% of national demand and ranking as the second-largest source of generation after hydropower. Over the past decade, installed wind capacity has increased sevenfold, reflecting the sector's rapid expansion and growing role in the energy mix. This development has been driven by a combination of strategic policy frameworks, market incentives, and industrial policies aimed at fostering technological advancement and grid integration.
The growth of Brazil's wind energy sector was catalysed by PROINFA (Incentive Programme for Alternative Sources of Electric Energy) and subsequent policy measures that facilitated its large-scale deployment. The introduction of energy auctions in 2004 proved pivotal, enabling the structured integration of wind power through specific auctions for alternative (LFA) and reserve sources (LFR) from 2009 onward. By 2011, wind energy was competing directly with conventional sources in non-specific auctions, marking a significant milestone in its competitiveness and market maturity. As a result, installed capacity surged from 29 MW in 2004 to 29 GW in 2023, a thousand-fold increase driven by targeted regulatory support, according to research by Vitto, Pinto Jr. and Ferraro (2022).
To further incentivize development, the federal and state governments introduced fiscal measures, including the Special Regime for Incentives to Infrastructure Development (REIDI), ICMS Agreement No. 101/1997, and reductions in the Merchandise and Service Circulation Tax (ICMS). Additionally, wind developers were exempt from ANEEL's (National Electric Energy Agency) R&D clause, which mandates energy companies to invest 1% of net revenue in research and development.
Parallel efforts sought to strengthen domestic production capabilities. Initially, BNDES (National Bank for Economic and Social Development) financing under PROINFA required a 60% local content threshold for wind turbines. However, recognizing inefficiencies in technology choices and limited incentives for high-tech component manufacturing, the BNDES revised local content requirements in 2013, introducing a phased approach to enhance the production of more advanced components.
With consistently strong wind resources, particularly in the Northeast, Brazil remains well-positioned for further expansion in the sector. As investments in renewable energy infrastructure accelerate, wind power is expected to play an increasingly central role in strengthening the country's energy security and advancing its sustainability agenda.
Box 8.2
Offshore Wind Energy in Brazil: Potential, Investments, and Regulatory Advances
Brazil's offshore wind resources are among the most favourable globally, with technical potential exceeding 1,200 GW, according to the World Bank's Scenarios for Offshore Wind Development in Brazil. This includes approximately 480 GW suitable for fixed-bottom foundations (at depths of less than 70 metres) and 748 GW for floating foundations (at depths ranging from 70 to 1,000 metres). These figures highlight the country's significant capacity for offshore wind development, with the potential to increase the share of renewable energy in its electricity mix.
Figure 8.14
Offshore wind technical potential in Brazil
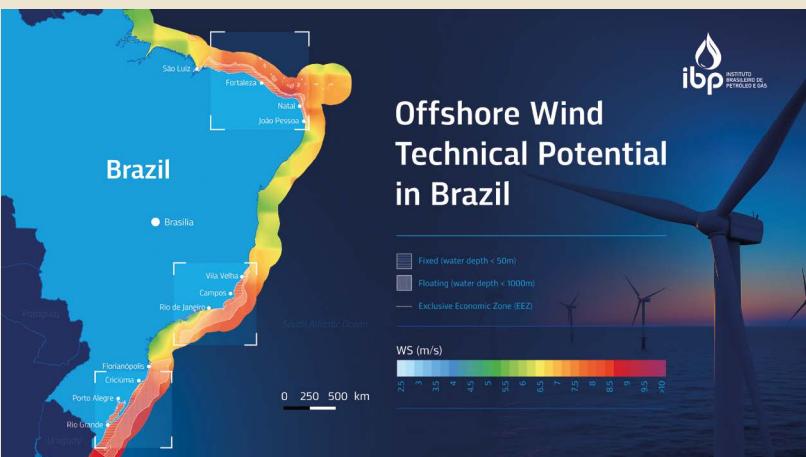
Source: IBP elaborated with World Bank data.
To further facilitate this expansion, Brazil enacted Law 15.097 on 10 January 2025, establishing a transparent regulatory framework for offshore wind energy development. The legislation authorizes the construction of wind farms in territorial waters, the exclusive economic zone, and the continental shelf, with site allocation conducted through competitive bidding processes. By enhancing energy security, attracting investments, and expanding the use of renewable resources, the law aims to address legal challenges that previously hindered the advancement of such projects.
A key driver of Brazil's offshore wind development is the oil and gas sector, which has emerged as a key partner, particularly in technological and regulatory aspects. The sector's expertise in marine operations, infrastructure installation, and logistics can support offshore wind energy development. This synergy stems from shared challenges, such as marine environment knowledge, floating platform installation,

8
and material adaptation. The oil and gas sector's experience in offshore operations can reduce costs and facilitate knowledge transfer, particularly in asset construction and operation. Additionally, technological advancement and cost reduction rely on engineering expertise, large-scale project management, and capital mobilization – strengths inherent to the oil and gas industry.
8.6.4 Solar power
Solar energy has experienced exponential growth in Brazil, emerging as the fastest-growing energy source over the past decade. Brazil's photovoltaic energy sector was initially promoted through reserve energy auctions in 2014 and 2015, allowing the country to contract 2,654 MW of solar energy. Despite challenges in meeting this capacity, cost reductions in solar panel production, changes in fiscal regimes, and increased participation in auctions helped expand solar energy over the past decade. In 2024, Brazil had around 53 GW of PV installed capacity, according to IRENA.
In 2012, Brazil implemented a net metering regime for small-scale distributed generation, and in 2015, regulations were improved to incentivize photovoltaic plant installations. The federal government launched the ProGD (Distributed Electric Power Generation Development Programme) to encourage renewable distributed generation in various sectors.
Solar energy development was also supported by policies like REIDI (Special Incentive Regime for Infrastructure Development), ICMS (Tax on the Circulation of Goods and Services) tax reductions, and financing programmes such as the BNDES, FINEM and FINAME (Industrial Financing). However, the nationalization requirements under FINAME did not achieve the same success as in wind energy. Regardless, R&D funding from the CT-Energy Fund and collaboration with knowledge partners promoted the installation of photovoltaic plants and the analysis of solar energy technologies.
During the past ten years, the country's solar power supply has expanded ninefold, reflecting the increasing role of photovoltaic generation in the national energy mix. Today, solar energy accounts for 7% of Brazil's electricity demand, underscoring its growing significance in the transition toward a more diversified energy system.
8.6.5 Biofuels
Brazil has established itself as a global leader in biofuel production, ranking as the world's second-largest producer, behind the US. According to the 2024 National Energy Balance by the EPE, approximately 22.5% of the transportation sector's energy consumption is met with biofuels. In 2024, Brazil produced 0.8 mb/d of biofuels, marking an increase of 7.1% from the previous year. The country's biofuel infrastructure includes 359 ethanol and 58 biodiesel production plants. This success is driven by proactive policies and initiatives that promote biofuels as a key component of Brazil's energy mix.
Ethanol is the primary biofuel in Brazil's transportation mix, mainly derived from sugarcane, with corn playing an increasing role, particularly during the sugarcane off-season. The National Energy Policy Council (CNPE) mandates a 27% blend of anhydrous ethanol in gasoline (E27). Additionally, ethanol is available in its pure form as hydrous ethanol, allowing
consumers to choose between gasoline and biofuel in flex-fuel vehicles, which make up over 80% of Brazil's light vehicle fleet, according to data from the EPE.
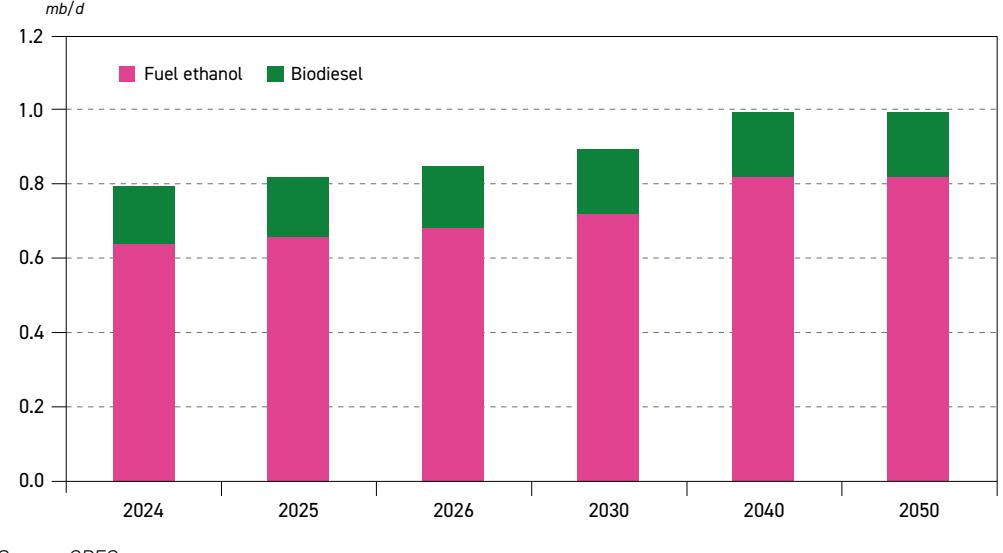
Figure 8.15 Brazilian biofuels production
In the heavy-duty vehicle sector, Brazil mandates a 14% biodiesel (FAME) blend in fossil diesel (B14), as established by the CNPE. Predominantly derived from soybean oil, Brazilian biodiesel also incorporates tallow and palm oil. In 2024, production averaged 0.16 mb/d.
Expanding beyond liquid biofuels, the 2021 New Gas Law incorporated biomethane into Brazil's energy mix. Produced by purifying biogas from organic waste decomposition, biomethane is now regulated as an interchangeable equivalent to natural gas, provided it meets ANP standards. While promising, the sector remains in its early stages, with ten production plants in operation.
This biofuel-driven transformation is further supported by Brazil's National Biofuels Policy (RenovaBio), established in 2017. RenovaBio sets annual decarbonization targets for fuel distributors, requiring them to purchase so-called Decarbonization Credits (CBIOs). These credits, which can be traded on the stock exchange, are generated by biofuel producers based on the CO2 equivalent avoided by substituting fossil fuels with biofuels.
Biofuels are an important alternative to help decarbonize the transportation sector, as their characteristics allow for combustion that emits up to 80% less GHG than fossil fuels throughout their life cycle, according to UNICA (Sugarcane Industry Union).
As mentioned earlier, biofuels play a key role not only in reducing emissions but also in optimizing Brazil's refining sector. By utilizing existing infrastructure and integrating co-processing techniques, refineries can adapt to changing energy demands, improve efficiency, and avoid the need for expensive new investments, ultimately contributing to a sustainable, low-carbon economy.

Source: OPEC.
Box 8.3 The Future Fuel Law
The Future Fuel Law, approved in 2024, is a legislative initiative aimed at increasing the share of renewables in the Brazilian energy mix, focusing on decarbonizing the country's mobility.
The legislation integrates some existing public policies – such as RenovaBio, the Green Mobility Programme (MOVER) and the Brazilian Vehicle Innovation and Labeling Programme (PBE Veicular) – while also updating current biofuel mandates and introducing new biofuels, such as SAF and green diesel (HVO). The law also included the concept of Life Cycle Assessment from well to wheel, considering the fuel from extraction to end use, to measure the emissions of the different energy sources used in transportation. This includes all stages, from energy generation, through extraction and production, to fuel use, with the aim of reducing greenhouse gas emissions more efficiently and economically.
Table 8.2 Fuels of the future
| Biofuel | Measurement | Projection |
|---|---|---|
| SAF | Minimum annual percentage reduction of GHG emissions | 1% from 2027. Growth of 1% per year from 2029, reaching 10% in 2037 |
| Green Diesel | Minimum volume share mandatory | 3% limit Voluntary addition allowed upon notification to the ANP |
| Biomethane | GHG emissions reduction target in the natural gas market | 1% from 2026 Cannot exceed 10% of emissions reduction |
| FAME (biodiesel) | Mandatory percentage, in volume, of biodiesel added to diesel oil | 15% in 2025 Growth of 1% per year until 20% in 2030. Can be changed to values between 13 and 25% |
| Ethanol | Mandatory percentage, in volume, of anhydrous ethanol added to gasoline | Set at 27% Can be changed to values between 22 and 35% |
Source: Adapted from Fuel for the Future – EPE Report, 2025.
8.6.6 Carbon Capture, Utilization and Storage (CCUS)
Brazil has significant potential to advance CCUS activities due to its geological storage capacity, the technological expertise of its oil operating companies, and opportunities for CO2 utilization in bioenergy generation systems.
According to recent estimates, Brazil has a CO2 capture potential of approximately 190 MTPA. The sectors with the greatest potential for implementing CCUS projects are energy, industrial applications, and fuel production. Of the estimated capture potential, 130 MTPA – or 68% of
the total – comes from the energy sector, equivalent to 32% of the sector's emissions and 8% of Brazil's total GHG emissions in 2023.
Beyond the potential to decarbonize the energy sector, CCUS can also serve as a carbon removal technology when combined with renewable biomass energy, known as BECCS. In this context, BECCS represents the second-largest capture potential, accounting for around 20%, due to Brazil's long-standing ethanol market and the growing, yet underexplored, potential for biogas production. The industrial sector follows, with approximately 15%.
The activities related to CO2 capture and storage in Brazil are concentrated in CO2 injection operations in the Santos Basin pre-salt fields, led by Petrobras. However, growing interest from the agricultural sector in BECCS technologies has also driven the implementation of projects following this technological pathway in the country.
In the pre-salt oil production of the Santos Basin, Petrobras employs CO2 injection associated with EOR across 22 platforms, positioning itself as the second-largest operation of its kind worldwide by 2023, according to data from the ANP (National Agency of Petroleum, Natural Gas and Biofuels). In 2024, 14.2 million tonnes (Mt) of CO2 were reinjected, bringing the total to over 67.9 Mt since 2008. Petrobras has set a target to reach a cumulative volume of 80 Mt of reinjected CO2 by 2025.
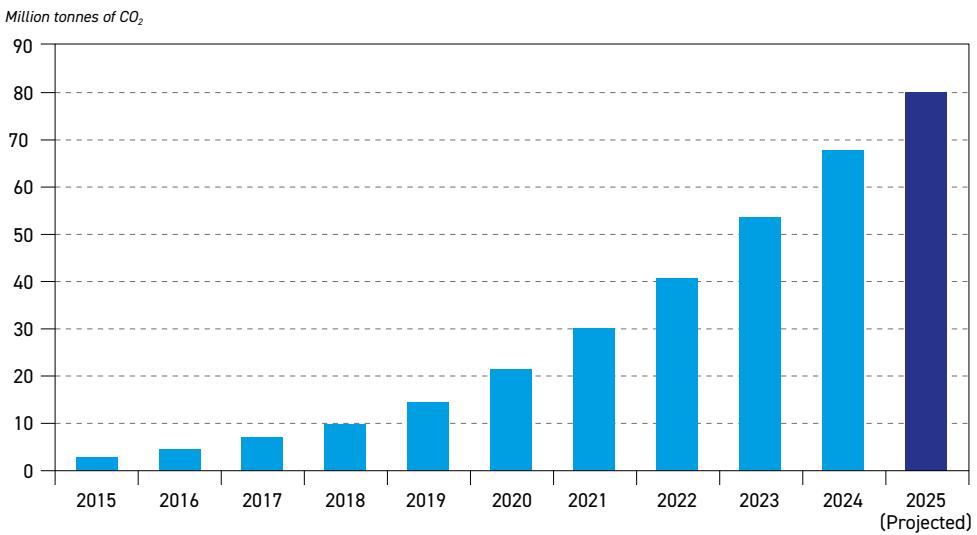
Figure 8.16 Accumulated reinjection of CO2 in Brazil
Source: IBP based on Petrobras data, 2025.
Within BECCS initiatives, a notable project is under development by FS Agrisolutions Indústria de Biocombustíveis, one of Brazil's leading ethanol producers. This pioneering project, the first of its kind in the country, is being developed for the Lucas do Rio Verde plant in the state of Mato Grosso. It aims to capture all CO2 generated during the fermentation stage, with an expected daily injection of 1,160 tons of CO2. Operations are scheduled to begin in 2025.
Additionally, Petrobras has expressed interest in developing CCUS hubs as new business opportunities and risk-sharing mechanisms. The company has already identified eight potential locations for these hubs across the country. In December 2023, during COP28, Petrobras signed a memorandum of understanding with the state of Rio de Janeiro to jointly evaluate the development of a CCUS hub and explore combined solutions, such as low-carbon hydrogen.
Brazil has made progress in establishing frameworks to promote the adoption of CCUS technologies as a productive activity through regulatory guidelines and specific incentives. On 30 August 2023, the Federal Senate approved Bill 1425/2022, aimed at creating a comprehensive legislative and regulatory framework for geological CO2 storage activities. Subsequently, on 8 October 2024, Brazil took a major step forward with the enactment of the above-mentioned 'Future Fuels Law' (Law 14.993/2024), which established the legal framework and obligations for operators to access geological storage sites.
Furthermore, two additional programmes were recently introduced: the Brazilian Emissions Trading System (SBCE) and the Energy Transition Acceleration Programme (PATEN), which encourage the development of low-carbon energy products, including those associated with CCUS technologies, according to analysis by the CCS Institute.
Regarding incentive policies, there are currently no specific instruments dedicated exclusively to CCUS. However, public funding is available through financing lines focused on emission reductions, such as the BNDES RenovaBio Programme, which was used in the FS Bioenergia project. Between 2017 and 2023, approximately 8% of R&D resources from concessionaires in Brazil were allocated to projects related to CCUS.
8.6.7 Natural gas
The energy transitions must be gradual, orderly and just in order to avoid disruptions in energy supply and ensure energy system accessibility. Thus, in the process of transitioning to a low-carbon energy mix, it is essential to consider the premise of supply security and the pursuit of guaranteeing economically accessible energy for consumers. In this context, natural gas is a suitable energy source for transitioning, given its lower CO2 emissions and the availability of established technologies.
Currently, Brazil holds 517 billion cubic metres of proven natural gas reserves, indicating significant production potential (Oil, Natural Gas, and Biofuels Statistical Yearbook 2024, ANP, 2024).
In 2024, the country produced 153 million cubic metres per day (mcm/d), with nearly 80% produced in the pre-salt area. About 30% of gross natural gas production is made available to the domestic market. The remaining volume is primarily reinjected – including all produced CO2 and a substantial share of natural gas – to enhance oil recovery in the pre-salt fields.
Moreover, additional volumes are consumed by the exploration and production (E&P) sector itself, mainly for power generation on offshore platforms, vented during processing (particularly when separating liquid fractions), or flared in small quantities due to operational and safety constraints – all of which are subject to strict regulatory oversight.
Brazil also relies on natural gas imports, primarily from Bolivia. In 2024, imports from Bolivia averaged 14.0 million cubic metres per day (mcm/d). Although Bolivian production is in decline, there are prospects for increasing imports to Brazil from Argentina, which would initially be routed through Bolivia using the existing infrastructure. Although Argentina began exporting gas to Brazil at the beginning of 2025, volumes remain limited for now and are largely driven by seasonal demand and spot market opportunities.
In response to these dynamics, Brazil has been expanding its natural gas transportation and distribution infrastructure, which currently includes approximately 9,400 km of transmission pipelines and about 40,000 km of distribution networks (EPE, 2025).
It is also important to highlight that the use of natural gas in the Brazilian electricity sector through dispatchable thermal power plants provides flexibility to the system during periods of high demand. However, the lack of firm demand for this energy source constitutes a challenge for increasing natural gas consumption in the Brazilian electricity sector.
Since 2016, Brazil's gas sector has undergone structural and regulatory changes aimed at reducing market concentration, separating transportation from production and facilitating access to new players. These regulatory updates have brought more competition, enabled diverse supply conditions and resulted in more attractive prices.
This process culminated with the enactment of a new Gas Law in 2021 (Law 14.134/2021), which has provided a more stable and predictable legal and regulatory environment and spurred the announcements of several new investments by private operators. The results of this market opening are tangible: the number of gas producers increased from 58 to 73 between 2021 and 2024, while the number of unregulated consumers also grew significantly, increasing from six in January 2024 to 57 in 2025.
The ongoing transformation in the natural gas sector has the potential to expand the supply of this resource, thereby contributing to meeting future energy demand. Moreover, these changes are aligned with the requirements of the energy transition by promoting the use of energy sources with lower carbon intensity.
Box 8.4 Energy Transition Accelerate Programme (PATEN)
Brazil has an institutional framework for the energy sector, overseeing the regulation of activities, conducting supply and demand studies, and guiding national energy planning. This framework underpins the development of policies and programmes aimed at enhancing energy efficiency and advancing the country's energy sector.
Among the many topics addressed by Brazil's energy policy, the focus on supply security and a gradual, just energy transition stands out. One notable initiative in this area is PATEN, established in 2024. This programme aims to provide the necessary tools for a transition that harnesses Brazil's industrial potential, fosters job creation, drives technological innovation, and promotes a fair, orderly, and gradual transition model (Law No. 15.103/2025).
Paten facilitates access to credit for companies with receivables from the Brazilian government, such as tax credits, to finance energy transition projects. The Green Fund, established under the Paten law and managed by the BNDES, will provide funding for low-carbon energy generation, as well as infrastructure for storage and transportation.
Paten's objectives include:
- Promoting financing for sustainable development projects, particularly those related to infrastructure, technological research, and innovation.
- Bridging the gap between funding institutions and companies interested in developing sustainable projects.
- Enabling private companies to utilize tax credits as financing tools.
- Promoting the generation and efficient use of low-carbon energy through sustainable projects aligned with Brazil's greenhouse gas emission reduction commitments.
- Encouraging energy transition activities in coal-dependent regions.
PATEN aims to expand and modernize renewable energy generation and transmission, while advancing low-carbon fuel technologies. It also seeks to promote technical training, research, and development of renewable energy solutions, as well as the production, transportation, and distribution of natural gas as an alternative. Thus, through this targeted programme, Brazil aims to ensure an orderly, efficient, and gradual energy transition.
8.7 G20, BRICS and COP30 – Brazil's role in energy and climate policy diplomacy
Brazil is a member of several forums that address the dynamics of the global economy, the architecture of the financial system and the energy sector. Notably, the G20, COP and BRICS stand out as key platforms for discussion, consensus-building and shaping actions in the global economy. Brazil actively participates in these forums, contributing to the development of new ideas, strategies and consensus essential for advancing agendas aimed at ensuring national stability and economic development. In the energy sector, the country engages in discussions related to energy supply and demand, efficiency and supply security, accessibility, climate change and the energy transition. The following sections outline the key debates in which Brazil participates within these organizations.
8.7.1 G20 in Brazil
In 2024, Brazil assumed the group's rotating presidency, hosting various thematic events to discuss an action agenda, in addition to the G20 Summit in Rio de Janeiro, to consolidate understanding and reach consensus.
The Brazilian government outlined three central themes for the 2024 meeting: (i) addressing climate change and energy transition; (ii) combating poverty and hunger; and (iii) reforming multilateral organizations and establishing a new global governance structure. A major highlight of the G20 was the launch of the Global Alliance Against Hunger and Poverty, which gathered 148 members, including 82 countries, the African Union, the European Union, and nine international financial institutions. The Alliance aims to achieve SDG 1 and 2, according to definitions of the UNFCCC.
Discussions related to energy industries held an important place. In this regard, the Brazilian government and the United Nations launched an initiative to combat climate misinformation, the "Global Initiative for Climate Change Information Integrity," to fund research and actions that promote accurate information on climate issues.
The main conclusions and agreements on energy at the 2024 Summit were:
- Consolidating the role of sustainable development in its three dimensions economic, social, and environmental – as a guiding principle for cooperation in favour of people, the planet, and prosperity.
- Accelerating a sustainable, just, accessible, and inclusive energy transition, in line with SDG 7, the Paris Agreement, and the results of GST1 adopted at COP28 in Dubai, ensuring energy access, especially for the poor and those in vulnerable situations, while considering different national circumstances.
- Accelerating efforts to achieve universal access to cleaner cooking energy by 2030.
- Achieving carbon neutrality by mid-century, indicating the need for each country to present its NDCs.
- Expanding international collaboration and support on specific platforms to increase public and private climate finance and investment for developing countries.
- Accelerating the reform of international financial architecture to address the urgent challenges of sustainable development, climate change, and efforts to eradicate poverty.
- Emphasizing support for the "Sustainable Finance Roadmap," highlighting the optimization of climate and environmental fund operations.
- Underscoring the importance of efforts to protect, conserve, and sustainably manage forests and combat deforestation.
Under Brazil's coordination, the G20 recognized the importance of energy security in the process of decarbonizing the global energy mix, acknowledging that it is essential to discuss the transition while ensuring continued access to affordable energy and considering the varying circumstances of each country. Financing these changes was again a major focus of the discussion, with the goal of expanding financing mechanisms for sustainable investments, particularly for developing countries.
8.7.2 BRICS: Brazil 2025
In 2025, Brazil assumed the rotating presidency of BRICS+, becoming the host for ministerial meetings and the annual Summit. The group was established in 2009. The BRICS members are Brazil, China, Russia, Saudi Arabia, India, South Africa, Egypt, Indonesia (joining in 2025), the United Arab Emirates, Ethiopia and IR Iran. The motto for Brazil's presidency in BRICS+ is "Strengthening Cooperation of the Global South for More Inclusive and Sustainable Governance." Brazil has set six priority areas for discussions in 2025: Global Health Cooperation; Trade, Investments, and Finance; Climate Change; Governance of Artificial Intelligence; Multilateral Architecture for Peace and Security; Institutional Development.
Specifically in the area of "Climate Change", the objective is to adopt an agenda that includes: (i) a Framework Declaration by Leaders on Climate Finance; (ii) solutions to facilitate climate action; (iii) cooperation on climate technology; (iv) cooperation on climate and trade synergies; and (v) high-level principles within BRICS for common approaches to carbon accounting. Additionally, in 2025, Brazil is coordinating the BRICS Energy Research Cooperation Platform (ERCP), whose main objectives are to strengthen research cooperation for the energy sector,

promote energy technology projects, and engage in dialogue with international forums on climate issues. In this way, the group is working to create ways to ensure improvements in energy efficiency, financing innovation and new technologies, and expanding energy access, which are essential for the economic and social growth of the member countries.
8.7.3 COP30 in Brazil 2025
Brazil is one of the world's largest economies and a nation endowed with one of the greatest energy potentials, owing to the diversity of natural resources found within its territory, which ensures the diversification of its energy mix. This abundance of natural resources affords the country a prominent leadership role in forums focused on climate change and the mitigation of its effects, as well as in shaping global agendas pertaining to sustainability, supply security and biodiversity.
Brazil will host COP30 in 2025, with the summit taking place in Belém (State of Pará), a city situated within the Amazon, making it an emblematic setting for discussions on energy security, climate change mitigation, and financing adaptations. COP30 will address key discussions concerning the transition to a low-carbon mix, highlighting the importance of supply security throughout this transformation. This illustrates the participation of various sources in this process, which involves increasing investments in renewables, financing sustainable investments and taking action to ensure a gradual decarbonization process.
Brazil plays a pivotal role in negotiations on climate diplomacy, sustainable development and inequality reduction, steering discussions on the global agenda. For COP30, the following priority topics have been established:
- Reduction of greenhouse gas emissions.
- Adaptation to climate change.
- Climate financing for developing countries.
- Renewable energy technologies and low-carbon solutions.
- Forest and biodiversity preservation.
- Climate justice and the social impacts of climate change.
The restoration of ecosystems and forests is one of the proposed strategies to mitigate the effects of climate change, bringing together financial resources, technology transfer and capacity building. Another central theme is ensuring access to energy and financing a just, progressive and equitable energy transition. The consolidation of a gradual transition, without disruptions to the energy system, prioritizing accessibility, is emphasized, which involves aligning international financial resources with climate goals.
In this context, COP30 strengthens the "Baku Climate Unity Pact," with a decision on the NCQG aiming to increase funding for developing countries. The presidency of COP30, aiming to bolster the "Sharm el-Sheikh Dialogue" (alignment of financial resources with sustainable development as per the Paris Agreement), deems it essential to increase climate action financing for developing nations, bringing together public and private sources to reach a financing target of at least $1.3 trillion per year by 2035.
Capacity building for the development of investment strategies and fundable projects to reinforce the implementation of NDCs and National Adaptation Plans (NAPs) is also
emphasized. Adaptation actions require significant attention in the face of climate change, based on the progress of the global adaptation goal (GGA) from COP28 and COP29. Brazil has its NDCs, which commit to reducing the country's net greenhouse gas emissions by 59% to 67% by 2035, compared to 2005 levels.
Brazil is creating several policies and programmes for the energy transition, with emphasis on the Carbon Credit Market, creating a system that allows the purchase and sale of credits to offset greenhouse gas emissions. In addition, the country is formulating a major policy for the energy transition called the "Plano Clima" (Climate Plan), which will define decarbonization goals for several economic sectors.
In light of its objectives, it is evident that COP30 in Brazil recognizes the necessity of utilizing existing energy sources and natural resources in a sustainable manner, striving for a multiphase transformation embedded in the context of economic growth, inequality reduction, and the maintenance of energy access.
To conclude this special chapter, Brazil is a country with a developed, diversified and globally relevant energy sector. The country plays a strategic role in supplying raw materials and energy to the world, attracting investments across various energy segments, thereby establishing itself as a key player in shaping the global energy sector.
In the oil and gas sector, Brazil stands out due to the scale of its hydrocarbon reserves and its mastery of technologies for enhanced exploration and production in diverse exploratory environments and under challenging conditions. Furthermore, the sector in Brazil has large investments planned and new exploratory areas under research, and is set to be a major driver of non-DoC liquids supply growth in the years to come. Additionally, the refining sector is notable for the diversification of production and for ensuring supply, which is crucial for a country of continental dimensions. These structural conditions demonstrate Brazil's capacity to supply energy, develop new technologies and contribute to increasing energy efficiency.
In the context of the transition to a low-carbon economy, the configuration of its energy mix and its diplomatic prowess in climate-related issues position Brazil as a leader in this process, making it a key participant in discussions on how to achieve a fair and equitable energy transition within the framework of sustainable economic growth and the reduction of inequalities.

Annex A Abbreviations
| National Agency of Petroleum, Natural Gas and Biofuels American Petroleum Institute IPCC Sixth Assessment Report | |
|---|---|
| Barrels of oil equivalent | |
| Benzene, toluene and xylenes | |
| Bharat Petroleum Corporation Limited | |
| Corporate Average Fuel Economy | |
| Decarbonization credits | |
| Brazilian Chamber of the Construction Industry | |
| Circular carbon economy | |
| Carbon capture, utilization and storage | |
| Contract for difference | |
| Carbon dioxide equivalent | |
| Carbon Offsetting and Reduction Scheme for International Aviation | |
| Coal-to-liquids | |
| Declaration of Cooperation | |
| Department of Energy | |
| East African Crude Oil Pipeline | |
| Office of Energy Efficiency and Renewable Energy | |
| Equitable Growth Scenario | |
| Enhanced oil recovery | |
| Brazilian government's Energy Research Company | |
| Energy Research Cooperation Platform | |
| EU Emissions Trading System | |
| Electric vehicles | |
| Exploration and production | |
| Fast breeder reactor | |
| Fluid catalytic cracking | |
| Fuel cell electric vehicles | |
| Final investment decision | |
| Five-Year Plan | |
| Gross Domestic Product | |
| Global Goal on Adaptation | |
| Greenhouse gas | |
| Global Stocktake | |
| Gas-to-liquids | |
| Gigawatt | |

| HELE | High-Efficiency, Low-Emissions |
| HPCC | Hindustan Petroleum Corporation Limited |
| IATA | International Air Transport Association |
| ICAO | International Civil Aviation Organization |
| ICEs | Internal Combustion Engines |
| ICMS | Merchandise and Service Circulation Tax |
| IIJA | Infrastructure Investment and Jobs Act |
| IMO | International Maritime Organization |
| INC | Intergovernmental Negotiating Committee |
| IOC | Indian Oil Corporation |
| IPCC | Intergovernmental Panel on Climate Change |
| IRA | Inflation Reduction Act |
| km/l | Kilometre per litre |
| LCOE | Levelized cost of electricity |
| LNG | Liquefied Natural Gas |
| LPG | Liquefied Petroleum Gas |
| LTAG | Long-Term Aspirational Goal |
| mb/d | Million barrels per day |
| mboe/d | Million barrels of oil equivalent per day |
| mcm/d | Million cubic metres per day |
| MDIC | Ministry of Development, Industry, Trade and Services |
| MEPC | Marine Environment Protection Committee |
| MPa | Megapascal |
| mpg | Miles per gallon |
| mt | Million tonnes |
| MTBE | Methyl tertiary butyl ether |
| mtpa | Million tonnes per annum |
| MW | Megawatts |
| M&A | Merger and acquisition |
| NAPs | National Adaptation Plans |
| NCQG | New collective quantified goal |
| NDCs | Nationally Determined Contributions |
| NDRC | National Development and Reform Commission |
| NEVs | New energy vehicles |
| NGLs | Natural Gas Liquids |
| NGVs | Natural Gas Vehicles |
| NOx | Nitrogen oxides |
| OECD | Organisation for Economic Co-operation and Development |
| OCCS | Onboard carbon capture and storage |
| ONS | National Electric System Operator |

| p.a. | Per annum |
|---|---|
| PET | Polyethylene terephthalate |
| PFAs | Polyfluoroalkyl substances |
| pp | Percentage points |
| ppm | Parts per million |
| PPP | Purchasing power parity |
| PV | Photovoltaic |
| RED | Revised Renewable Energy Directive |
| REIDI | Special Regime for Incentives to Infrastructure Development |
| RPK | Revenue Passenger Kilometre |
| R&D | Research and Development |
| SAF | Sustainable Aviation Fuel |
| SBCE | Brazilian Emissions Trading System |
| SB62 | Negotiation Sessions, Bonn |
| S+3E | Energy security, economic efficiency, environmental sustainability and safety |
| SDG | Sustainable Development Goal |
| SIN | National Interconnected System |
| SMR | Small modular reactor |
| SUVs | Sport utility vehicles |
| tb/d | Thousand barrels per day |
| TDS | Technology-Driven Scenario |
| TWh | Terawatt hour |
| ULS | Ultra-low sulphur |
| UNDESA | United Nations Department of Economic and Social Affairs |
| UNFCCC | UN Framework Convention on Climate Change |
| VLSFO | Very Low Sulphur Fuel Oil |
| WOO | World Oil Outlook (OPEC) |
| WTI | West Texas Intermediate |

Annex B Regional definitions for energy and oil demand
OECD
OECD Americas Canada Chile Mexico United States of America (including US dependencies)
OECD Europe Austria Belgium Czechia Denmark Estonia Finland France Germany Greece Hungary Iceland Ireland Italy Latvia Lithuania Luxembourg Netherlands Norway Poland Portugal Slovakia Slovenia Spain Sweden Switzerland Türkiye United Kingdom
OECD Asia-Pacific
Australia Japan Korea (Republic of) New Zealand
NON-OECD COUNTRIES
Latin America Anguilla Antigua and Barbuda Argentina Aruba Bahamas Barbados Belize Bermuda Bolivia (Plurinational State of) Brazil British Virgin Islands Cayman Islands Colombia Costa Rica Cuba Dominica Dominican Republic Ecuador El Salvador French Guiana Grenada Guadeloupe Guatemala Guyana Haiti Honduras Jamaica Martinique Montserrat Netherlands Antilles Nicaragua Panama Paraguay Peru St. Kitts and Nevis St. Lucia St. Pierre et Miquelon St. Vincent and the Grenadines Suriname Trinidad and Tobago Turks and Caicos Islands Uruguay Venezuela

Middle East
Bahrain IR Iran Iraq Jordan Kuwait Lebanon Oman Qatar Saudi Arabia Syrian Arab Republic United Arab Emirates Yemen
Africa
Algeria Angola Benin Botswana Burkina Faso Burundi Cameroon (United Republic of) Cape Verde Central African Republic Chad Comoros Congo Congo (Democratic Republic of the) Côte d'Ivoire Djibouti Egypt Equatorial Guinea Eritrea Eswatini Ethiopia Gabon Gambia (The) Ghana Guinea Guinea-Bissau Kenya Lesotho Liberia Libya Madagascar Malawi Mali Mauritania Mauritius Morocco Mozambique Namibia Niger Nigeria Réunion Rwanda
São Tomé and Príncipe Senegal Seychelles Sierra Leone Somalia South Africa South Sudan Sudan Tanzania Togo Tunisia Uganda Western Sahara Zambia Zimbabwe India India China People's Republic of China Other Asia Afghanistan American Samoa Bangladesh Bhutan Brunei Darussalam Cambodia China, Hong Kong SAR Cook Islands Fiji French Polynesia Indonesia Kiribati Korea (Democratic People's Republic of) Lao People's Democratic Republic Malaysia Maldives Micronesia (Federated States of) Mongolia Myanmar Nauru Nepal New Caledonia Niue Pakistan Papua New Guinea Philippines Samoa Singapore Solomon Islands Sri Lanka Thailand

Timor-Leste Tonga Tuvalu Vanuatu Vietnam Other other Asia
Russia Russian Federation
Other Eurasia Armenia Azerbaijan Belarus Georgia Kazakhstan Kyrgyzstan Moldova (Republic of) Tajikistan Turkmenistan Ukraine Uzbekistan
Other Europe Albania Bosnia and Herzegovina Bulgaria Croatia Cyprus Gibraltar
Note: For Chapter 4 'Liquids supply' the DoC regional grouping is shown, which includes the following countries: Algeria, Azerbaijan, Bahrain, Brunei, Congo, Equatorial Guinea, Gabon, IR Iran, Iraq, Kazakhstan, Kuwait, Libya, Malaysia, Mexico, Nigeria, Oman, Russia, Saudi Arabia, Sudan, South Sudan, the United Arab Emirates and Venezuela.
Annex C Regional definitions for oil refining and trade
US & Canada
United States of America (including US dependencies) Canada
Latin America
Anguilla Antigua and Barbuda Argentina Aruba Bahamas Barbados Belize Bermuda Bolivia (Plurinational State of) Brazil British Virgin Islands Cayman Islands Chile Colombia Costa Rica Cuba Dominica Dominican Republic Ecuador El Salvador French Guiana Grenada Guadeloupe Guatemala Guyana Haiti Honduras Jamaica Martinique Mexico Montserrat Netherlands Antilles Nicaragua Panama Paraguay Peru St. Kitts and Nevis St. Lucia St. Pierre et Miquelon St. Vincent and The Grenadines Suriname Trinidad and Tobago Turks And Caicos Islands United States Virgin Islands Uruguay Venezuela
Africa Algeria Angola Benin Botswana Burkina Faso Burundi Cameroon (United Republic of) Cape Verde Central African Republic Chad Comoros Congo Congo (Democratic Republic of) Côte d'Ivoire Djibouti Egypt Equatorial Guinea Ethiopia Eritrea Eswatini Gabon Gambia (The) Ghana Guinea Guinea-Bissau Kenya Lesotho Liberia Libya Madagascar Malawi Mali Mauritania Mauritius Morocco Mozambique Namibia Niger Nigeria Réunion Rwanda São Tomé and Príncipe Senegal Seychelles Sierra Leone Somalia South Africa South Sudan Sudan Uganda Tanzania Togo Tunisia Western Sahara Zambia Zimbabwe

Europe Albania Austria Belarus Belgium Bosnia and Herzegovina Bulgaria Croatia Cyprus Czechia Denmark Estonia Finland France Germany Gibraltar Greece Hungary Iceland Ireland Italy Latvia Lithuania Luxembourg Malta Moldova (Republic of) Montenegro Netherlands Norway Poland Portugal Romania Republic of North Macedonia Serbia Slovakia Slovenia Spain Sweden Switzerland Türkiye Ukraine United Kingdom
Russia & Caspian
Armenia Azerbaijan Georgia Kazakhstan Kyrgyzstan Russian Federation Tajikistan Turkmenistan Uzbekistan
Middle East
Bahrain IR Iran Iraq Jordan Kuwait Lebanon Oman Qatar Saudi Arabia Syrian Arab Republic United Arab Emirates Yemen
China People's Republic of China
Other Asia-Pacific
Australia Brunei Darussalam Indonesia Malaysia Philippines Korea (Republic of) Singapore Thailand Afghanistan American Samoa Bangladesh
Bhutan Cambodia Cook Islands Fiji French Polynesia India Japan Korea (Democratic People's Republic of) Kiribati Lao People's Democratic Republic Maldives Micronesia (Federated States of) Mongolia Myanmar Nauru Nepal New Caledonia New Zealand Niue Pakistan Papua New Guinea Samoa Solomon Islands Sri Lanka Timor-Leste Tonga Tuvalu Vanuatu Vietnam Other other Asia

Annex D Major data sources
AG Energiebilanzen Airbus American Chemical Society (ACS) American Petroleum Institute (API) Argus Media Asia-Pacific Economic Cooperation (APEC) Baker Hughes Barclays Research Bloomberg Boeing BP Statistical Review of World Energy Brazil, Ministry of Mines and Energy Brookings Institute Bunkerworld Canada, National Energy Board Canadian Association of Petroleum Producers Canadian Energy Research Institute CEDIGAZ Center for Strategic and International Studies (CSIS) China National Petroleum Corporation (CNPC) Citigroup Climate Action Tracker Consensus Economics Deloitte Deutsche Bank E&P Magazine The Economist Economist Intelligence Unit Energy Research Institute of the Russian Academy of Sciences (ERI RAS) Energy Intelligence Group Equinor Ernst & Young EUREL European Automotive Manufacturers Association (ACEA) European Commission (EC) European Council European Environment Agency Eurostat Evaluate Energy Facts Global Energy (FGE) Financial Times FrauenHofer Institue Gas Exporting Countries Forum (GECF) Global Carbon Capture and Storage Institute (GCCSI) Global Commission on the Economy and Climate Global Wind Energy Council Goldman Sachs GSMA Intelligence Harvard Business Review Haver Analytics HSBC Hydrocarbon Processing IMF India, Ministry of Petroleum & Natural Gas India Times Institut Français du Pétrole (IFP) Institute for Essential Services Reform (IESR)
A
Institute of Energy Economics, Japan (IEEJ) Interfax Global Energy Intergovernmental Panel on Climate Change (IPCC) International Air Transport Association (IATA) International Association for Energy Economics (IAEE) International Atomic Energy Agency (IAEA) International Civil Aviation Organization (ICAO) International Commodities Exchange International Council on Clean Transportation (ICCT) International Energy Agency (IEA) International Maritime Organization (IMO) International Monetary Fund (IMF) International Renewable Energy Agency (IRENA) International Road Federation, World Road Statistics International Union of Railways (UIC) Japan, Ministry of Economy, Trade and Industry (METI) Japan Automobile Manufacturers Association, Inc (JAMA) Joint Aviation Authority (JAA) Joint Organisations Data Initiative (JODI) Journal of Petroleum Technology Kennedy School of Government, Harvard University Kpler McKinsey Global Institute National Development and Reform Commission (NDRC) National Energy Administration of the People's Republic of China (NEA) National Renewable Energy Laboratory Natural Gas World Magazine New York Mercantile Exchange OECD Oil & Gas Journal OilX OPEC Annual Statistical Bulletin (ASB) OPEC Fund OPEC Monthly Oil Market Report (MOMR) OPEC World Oil Outlook (WOO) Oxford Economics Oxford Institute for Energy Studies Petro-Logistics Petrobras Petroleum Economist Platts PricewaterhouseCoopers Reserve Bank of Australia Reuters Rystad Energy S&P Global Commodity Insights Seatrade Society of Petroleum Engineers (SPE) Stratas Advisors Sustainable Energy for All The Economic Times Turner Mason and Company UN Department of Economic and Social Affairs UN Energy Statistics UN Food and Agriculture Organization (FAO) UN International Trade Statistics Yearbook UN National Account Statistics

- UN Conference on Trade and Development (UNCTAD)
- UN Development Programme (UNDP)
- UN Economic and Social Commission for Asia and the Pacific (UNESCAP)
- UN Educational, Scientific and Cultural Organization (UNESCO)
- UN Environment Programme (UNEP)
- UN Framework Convention on Climate Change (UNFCCC)
- UN International Labour Organisation (ILO)
- UN Statistical Yearbook
- UN World Tourism Organization (UNWTO)
- US Bureau of Labor Statistics
- US Department of Energy (DoE)
- US Department of the Interior (DoI)
- US Energy Information Administration (EIA)
- US Environmental Protection Agency (EPA)
- US Geological Survey (USGS)
- Vortexa
- Wall Street Journal
- World Bank
- World Coal Association
- World Coal Institute
- World Energy Council
- Wood Mackenzie
- World Economic Forum
- World Nuclear Association
- World Resources Institute
- World Trade Organization (WTO), International Trade Statistics

Organization of the Petroleum Exporting Countries Helferstorferstrasse 17 A-1010 Vienna, Austria www.opec.org ISBN 978-3-9505790-0-0
ISBN 978-3-9505790-0-0

www.opec.org