reader/misc_files/1324674/shales-bold-new-era-what-it-means-and-how-to-succeed
Length: • 11 mins
Annotated by Paul Cox

Oil & Gas Practice
Shale's bold new era: What it means and how to succeed
Shale is entering a new era, clouded by geological and macro uncertainty, but a new level of scale and rapidly accelerating innovation could unlock the next tier of resources.
This article is a collaborative effort by Ashwin Mohandas, Luciano Di Fiori, Micah Smith, and Nikhil Ati, with Jeremy Brown, representing views from McKinsey's Oil & Gas Practice.

The US shale industry has moved through two distinct eras of transformation, and it is now entering a third. After years of rapid growth and a sharp focus on cash, the industry's boldest chapter may be unfolding, defined by unprecedented scale, geologic uncertainty, macro volatility, and accelerating innovation1 .
Thriving in this new era will be all about leveraging scale: transforming operations and supply chains, elevating and integrating commercial strategies for an increasingly dynamic market, and reimagining organizations for a new way of operating.
Taking stock of the new reality
Scale is the most prominent feature of this new era, following continuous growth in output from shale over the last 15 years2 and the M&A wave of 2023– 24.3 In the United States, 8,000 horizontal wells are drilled each year (adding to the US total of more than 180,000). Subsequently, water production is increasing exponentially and operational and infrastructure complexities are intensifying.4
However, even while significant scale is being achieved, operators are confronting the reality that Tier 1 locations (drilling locations with the best geology) are declining. This is evidenced by the fact that most wells drilled in 2024 were child wells, which often show lower capital efficiency than their parent counterparts.5 Additionally, gas-to-oil ratios (GOR) are trending relentlessly upward—for example, 44 percent of Wolfcamp A wells drilled in Delaware after 2021 had a GOR of more than 3,000 standard cubic feet of gas per barrel of oil, a rate which has doubled from the previous decade.6 By simple measures, all basins are now past their peak of total capital efficiency (Exhibit 1), with finite rigyears of Tier 1 inventory in sight (Exhibit 2), based on current technologies and cost profiles.
The macroeconomic outlook is another source of uncertainty. McKinsey modeling suggests that trade barriers could increase breakeven prices for new wells by 10 percent, while outlooks for oil prices in 2026 have been highly turbulent over the past three months.7
5
By simple measures, all basins are now past their peak of total capital efficiency, with finite rig-years of Tier 1 inventory in sight.
1 "Jeremy Brown, Florian Christ, Tom Grace, and Sehrish Saud, "Paths to profitability in US unconventionals," McKinsey, August 12, 2019; Jeremy Brown, Florian Christ, and Tom Grace, "Sustaining the base: A new focus in shale's quest for cash," McKinsey, October 25, 2019." 2 Combined US oil and gas production from shale averaged 5.3 million barrel of oil equivalent (BOE) per day in 2010, compared to 31.4 million BOE per day in May 2025, Rystad Energy, accessed June 2025.
3 In 2023–24, transactions between upstream operators in North America with a value exceeding $1 billion totaled more than $250 billion, Capital IQ, accessed May 2025. 4
& quot;The distribution of US oil and natural gas wells by production rate with data through 2023," US Energy Information Administration, December 2024; "Produced water from oil and gas development and critical minerals," US Department of Energy, June 2014.
Child wells are wells drilled near existing "parent" wells, in areas with risk of depletion from the parent wells, or risk of causing frac
interference during completion. McKinsey Energy Solutions, North American Supply Model (assumes child wells are drilled within 1,500 feet from an existing well and at least a year afterward).
6 McKinsey Energy Solutions, North American Supply Model.
7 "Petroleum and other liquids: Cushing, OK WTI Sport Price FOB," US Energy Information Administration, June 2025.
Exhibit 1 Capital efficiency for new wells is declining across basins. Capital eciency for new wells is declining across basins.
Normalized capital eciency for new wells by basin, IP1/capital expenditures2 (2015 performance = 1)3
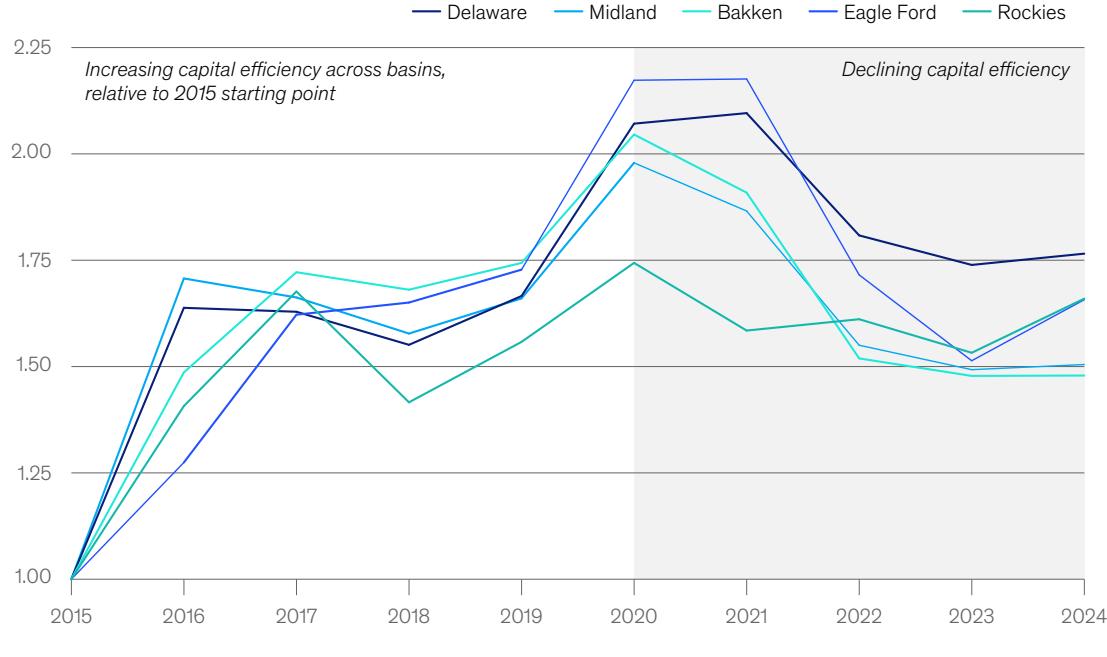
Initial production, dened as highest production over 30 days, in barrels of oil equivalent per day (BOED). Dened in terms of drilling and completion cost per well. Capital eciencies shown are relative to 2015 starting point for each basin, not relative to each basin in year. Source: McKinsey Energy Solutions—North American Supply Model
McKinsey & Company
Exhibit 2
There is finite Tier 1 inventory remaining across basins. There is nite Tier 1 inventory remaining across basins.
Remaining rig-years of Tier 1 inventory, dened as breakeven price <$40 per barrel of oil, based on current rig counts,1 years (range)
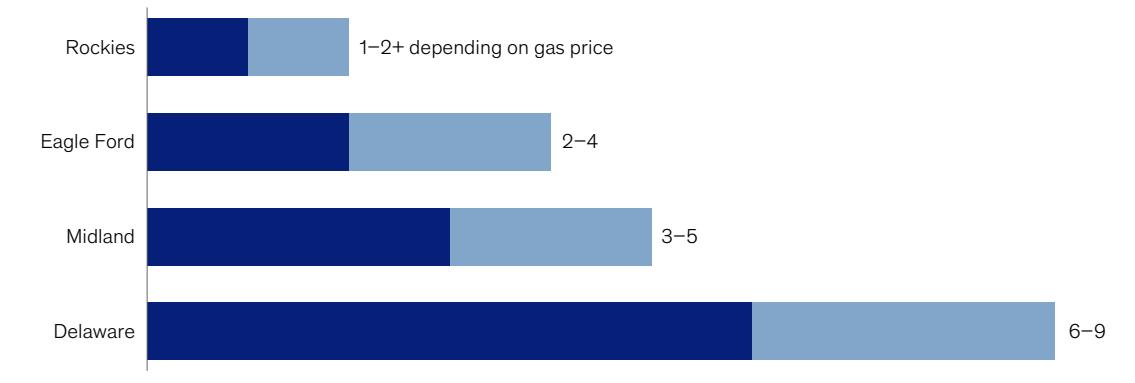
Calculated based on drilling inventory of wells with breakeven price <$40 per barrel divided by number of well spuds in 2024. Source: McKinsey Energy Solutions—North American Supply Model
McKinsey & Company
The pace of technological innovation, which is even more vigorous today than it was during shale's early growth period, could counteract these headwinds. For example, lateral lengths which pushed the envelope only five years ago are now routine (Exhibit 3), and horseshoe wells will soon be commonplace. Together, scale and technology are creating the conditions for a substantial drop in breakevens, similar to the 30 to 40 percent drop that occurred over the 2014–18 period.8 This could transform today's Tier 2 or Tier 3 locations into tomorrow's Tier 1, and rejuvenate mature areas, for example, Rockies, Eagle Ford, and Bakken.
If breakevens reduce by only 30 percent over the next five years, approximately 60,000 locations currently classified as Tier 2 ($40 to $50 per barrel of oil equivalent [BOE] breakeven) could achieve the same breakevens as today's Tier 1—less than $40/BOE, in the absence of inflationary pressures.9 This could increase the overall Tier 1 count by 150 percent. A range of innovations, such as horseshoe wells and other next-generation designs, frac efficiency gains such as trimulfrac, and other novel breakthroughs yet to be developed, could all contribute to this movement, alongside the cost efficiencies coming from expanded scale.
9 Tier 1 and Tier 2 acreage classifications are based on breakeven oil prices, or the minimum price at which a well can be drilled profitably. McKinsey analysis of well breakevens, based on data from McKinsey Energy Solutions, North American Supply Model.
Exhibit 3 Lateral lengths continue to increase. Lateral lengths continue to increase.
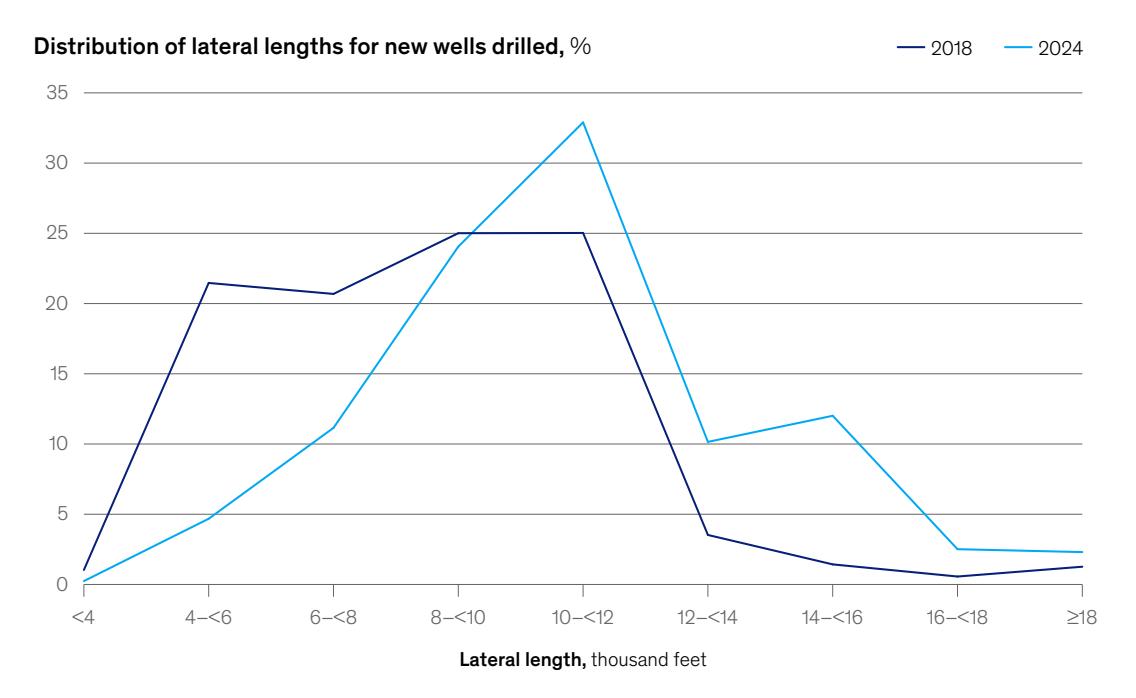
Source: McKinsey Energy Solutions—North America Supply Model
McKinsey & Company
8 Breakeven price observed in the Permian Basin. Marc Stocker, John Baffes, and Dana Vorisek, "What triggered the oil price plunge of 2014–2016 and why it failed to deliver an economic impetus in eight charts," World Bank Blogs, January 18, 2018; McKinsey Energy Solutions, North American Supply Model.
Together, scale and technology are creating the conditions for a substantial drop in breakevens, similar to the 30 to 40 percent drop that occurred over the 2014–18 period.
Delivering the next S-curve of performance and cost
The pace at which today's Tier 2 becomes Tier 1 is uncertain, but what we do know is that those who can make pushing the operational envelope a business-as-usual practice could get ahead of the competition and lengthen their inventory runways. All facets of field operations offer advantages of scale, including development,
production operations, maintenance, logistics, and supply chain, with potential for compounding efficiency gains (versus companies that focus on only a few priority areas).
For example, one operator made it a priority to use its expanded scale as a catalyst to rethink operational limits (Exhibit 4). This operator leaned heavily into remote operating centers to
Exhibit 4
A best-in-basin operator leveraged new scale to increase cash flow and Tier 1 runway. A best-in-basin operator leveraged new scale to increase cashow and Tier 1 runway.
| Operator analysis | Production gain | Capital expenditures | Operating expenditures | Realized price | ||
|---|---|---|---|---|---|---|
| Increase in free cashow, % | Breakeven reduction, $/BOE1 | Description | ||||
| Reservoir 2–4 | 0.50–0.65 | Analytics-driven completion and spacing optimization across all tiers of inventory | ||||
| D&C2 | 3–5 | 0.45–0.60 | Horseshoe wells, trimulfrac, remote frac, rig standardization | |||
| Facilities | 1–3 | 0.15–0.25 | Capital scrubs, modularization, contracting, and execution | |||
| Production operations | 5–10 ~1 | 0.45–0.60 | Remote operations centers, streamlined 'eld maintenance | |||
| Commercial | ~1 2–5 | 1 | 0.45–0.60 | Optimized path to market and takeaway strategy, improved marketing and trading capabilities | ||
| Total | 8–15 | 4–8 2–5 | 15–30 | 2.00–2.70 | +1–2 rig-years of Tier 1 inventory | |
| ~1 | ||||||
Note: Figures may not sum, because of rounding. Barrel of oil equivalent.
Drilling and completions.
McKinsey & Company
Operators that can make pushing the operational envelope a business-as-usual practice could get ahead of the competition and lengthen their inventory runways.
streamline field operations and set high targets for drilling and completions performance and production downtime, areas where they were already basin leaders. By simultaneously pulling value levers across capital expenditure, operational expenditure, production, and pricing, this operator was able to reduce breakeven by 25 percent across inventory, build a plan to increase free cash flow by 40 percent, and prolong its Tier 1 inventory runway by approximately two years.
More specifically, the supply chain function can help operators to capitalize on scale in the current environment of tariff-related cost pressures, guided by three considerations:
- Supply chain functions can serve as value centers (instead of cost centers). Companies are shifting away from a cost center mindset by empowering the supply chain function with resources and a voice in decision-making to fully capitalize on new scale. Practices such as should-cost modeling, scenario-based demand modeling, and strategic spot-versus-term balancing have helped leading organizations reduce costs and enhance resilience.10 The topic of water management in the Permian is a timely example, where leading operators are rethinking the water value chain to enable value creation, beyond simply avoiding disposal costs.
- Total cost of ownership (TCO) can serve as the North Star. Operators are moving beyond upfront costs to consider long-term factors such as maintenance, efficiency, and reliability.
Historically, cost-focused operators have been hesitant to consider performance-based structures or long-term agreements that align incentives with service providers, but leading operators are rethinking this paradigm to create value at scale.
— Analytics or AI can be embedded into supply chain workflows. Operators are using digital tools, such as AI-driven contract monitoring, to detect leakage points and source-to-pay optimization to build smarter, more resilient operations.
Doubling down on commercial integration
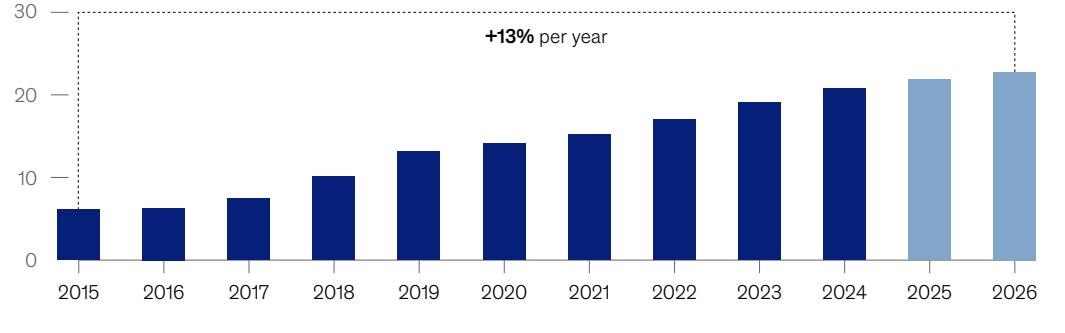
Oil and gas production in the United States has outpaced the infrastructure needed to get products to market, increasing the premium for those who control these flows. This is especially true for gas, due to the large interconnected global market for liquefied natural gas, and exacerbated by the global data center industry increasingly looking to gas as a source of energy.11
Operators are therefore seeking more control over paths to market, both to protect their access and to capture the arbitrage of price dislocations that have become more frequent as volatility grows (Exhibit 5). The increase in midstream consolidation ($180 billion worth of deals in the last three years) speaks to this trend, as midstream organizations rush to maximize their share of this value pool.12
10& quot;Capex excellence in oil and gas: Innovations for market challenges," McKinsey, December 5, 2024.
11 Global energy perspective 2024, McKinsey, September 17, 2024. 12Artem Abramov and Elliot Busby, "Rising data demand puts pressure on US energy grid, boosts gas projects," Rystad Energy, January 15, 2025; Corey Paul, "US LNG feedgas demand hits new record as exports surge," S&P Global, February 24, 2025.
Exhibit 5 Exhibit <6> of <7>
Waha gas prices show high volatility and wide differentials compared to Henry Hub, which is expected to continue through to 2026. Waha gas prices show high volatility and wide dierentials compared to Henry Hub, which is expected to continue through to 2026.
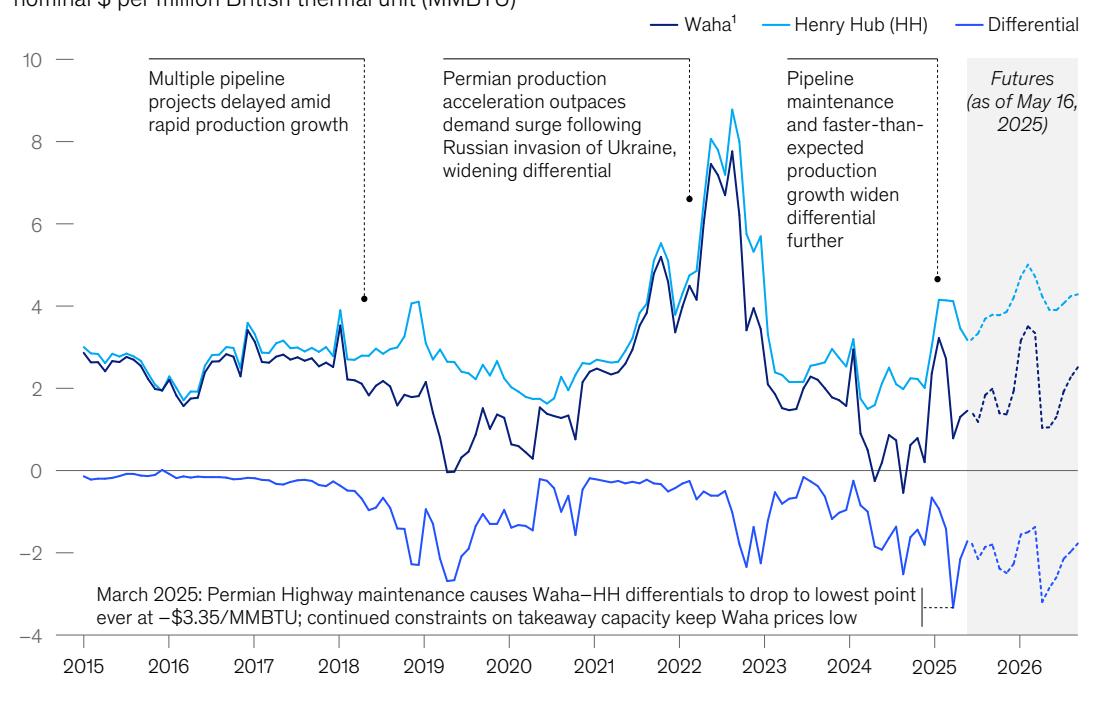
Historical Waha–Henry Hub monthly average spot prices and dierential, nominal $ per million British thermal unit (MMBTU)
Permian sales gas volumes,1 billion cubic feet per day
Sales volumes only; excludes gas used for fuel, ared, reinjected, and other nonmarketable volumes. Source: McKinsey Energy Solutions—North America Supply Model
McKinsey & Company
Operators can stick to the status quo of the traditional exploration and production (E&P) model—that is, focus on optimizing production and cede commercial margins to third parties—but they risk falling behind their peers who are adapting for the new era. Sophisticated operators are integrating information flows into their commercial
approach to optimize their entire system, either through increased midstream participation, enhanced marketing and trading capabilities, or both—and the right mix will vary for each portfolio (Exhibit 6). For some operators, this entails a partial return to the first era of shale, when early companies were more integrated with midstream
Estimate
Exhibit 6
In the new era of shale, operators increasingly participate across the commercial value chain, using information flows to create value. In the new era of shale, operators increasingly participate across the commercial value chain, using information ows to create value.
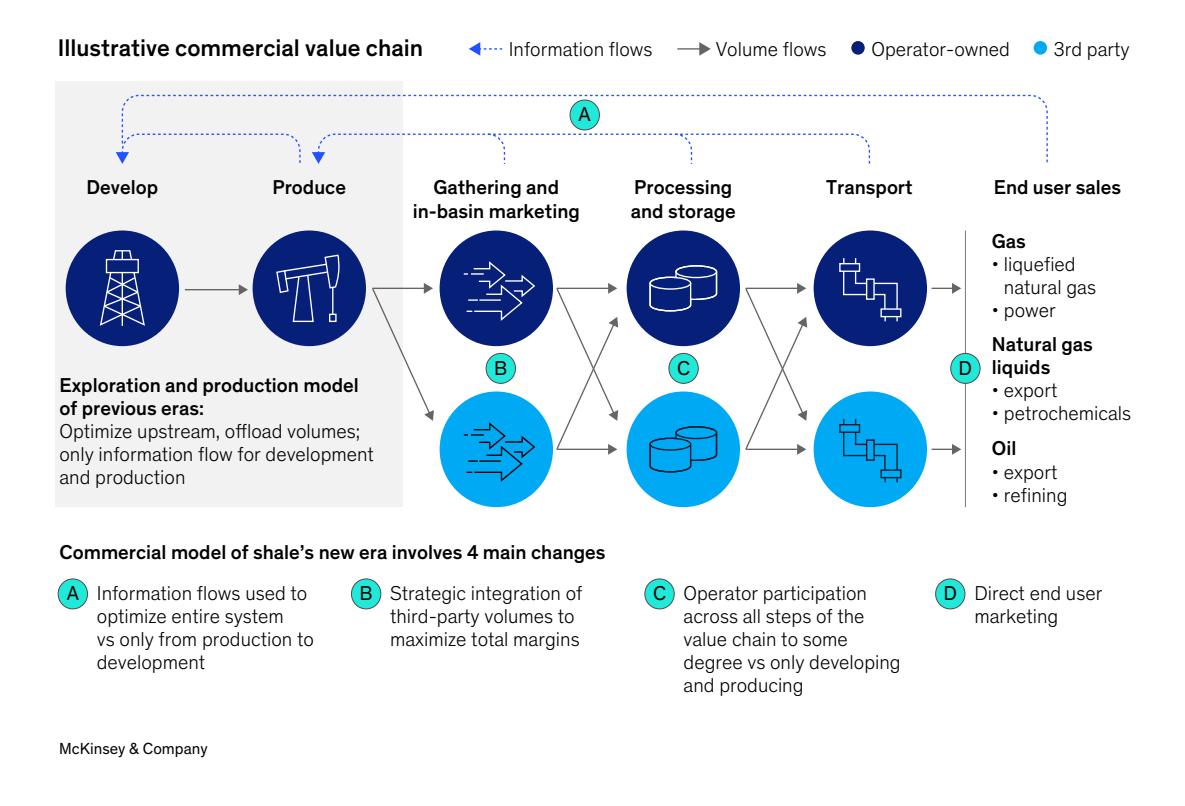
to ensure a path to market. These early companies largely exited during shale's second era to focus on upstream cash flow optimization.
Price/cost discovery is just one example of the many ways that information flows can be used to optimize systems. This can be achieved through
contracting mechanisms, trading functions, or full midstream participation. Those who successfully transform their commercial approach typically see a 3 to 8 percent netback increase (across both pricing and cost)—presenting a very real advantage over peers who are not seizing this opportunity.13
13 McKinsey analysis.
Operators can stick to the status quo of the traditional E&P model—that is, focus on optimizing production and cede commercial margins to third parties—but they risk falling behind their peers who are adapting for the new era.
Rewiring for scale
The scale and uncertainty that characterize shale's new era necessitate operating models fundamentally different than those that have been inherited. The ability to rewire organizations to meet these new conditions will likely be a differentiating factor. The trick will be to take advantage of scale to drive efficiency, while retaining the nimbleness needed to succeed in field development, where complexity will only grow. Of course, this is easier said than done. In the previous era, shale companies successfully reorganized to prioritize cash following extensive production growth, which is a transition common to growing enterprises across all industries. But the current challenge of leveraging a new level of oil field scale is in many ways uncharted territory.
Due to the wide array of portfolio types and sizes, there will be no silver bullet for organizational redesign in the new era. However, the operators that succeed will be those who understand the value centers of their portfolio and build organizations to deliver efficiency at scale across them. Typical value centers include portfolio strategy, field development, production management, and midstream or commercial, with each needing its own capabilities and the right balance of functional versus asset-centric decision-making.
One common theme, regardless of portfolio, will be the importance of standardized workflows to drive efficiency at scale. For some lean E&Ps, standardization will be new to their nimble approach, but many are discovering the importance of consistency in execution across larger portfolios. To create value, standardized workflows must be simple and streamlined. AI may play an increasing role here; although many oil and gas use cases are nascent, the next ten years could see a steady increase in the adoption of AI for key workflows across sectors.14 Operators can future-proof their organizations for these shifts by cleansing and organizing their data and linking to workflows, developing a digital capability-building plan that reaches across the enterprise, and creating a governance framework to manage ethical, legal, and regulatory risks associated with AI adoption.
The next chapter of the shale revolution will be fundamentally different from the previous ones, with a new set of complexities and opportunities. The ability to adapt to this new reality will determine which organizations can successfully scale.
Ashwin Mohandas and Luciano Di Fiori are partners in McKinsey's Houston office, where Nikhil Ati is a senior partner, and Jeremy Brown is an associate partner; and Micah Smith is a senior partner in the Dallas office.
The authors wish to thank Brandon Stackhouse, Dumitru Dediu, Joe Day, Kelsey French, Shane Rowley, Spencer Holmes, and Yuliya Olsen for their contributions to this article.
Copyright © 2025 McKinsey & Company. All rights reserved.
14 "Beyond the hype: New opportunities for gen AI in energy and materials," McKinsey, February 5, 2024.
Find more content like this on the McKinsey Insights App

Scan • Download • Personalize