Senior-and-Above Compensation in Tech
Length: • 15 mins
Annotated by Ben Ackland
How well does tech pay, really? A deep look into almost 1,000 data points sent in by engineering managers, senior+ engineers, VP, and C-level folks in tech, mostly working in software engineering
In April 2023, I invited senior-and-above readers to share their compensation numbers, to research an accurate account of pay at startups, scaleups, and publicly traded companies. The survey was a collaboration with VC firm Creandum, which created an interesting report about early-stage compensation in Europe. Creandum shared a report, based on this data last year: Compensation Decoded: Tech leader salaries at early-stage startups.
I’m delighted to share what – I hope – is the most detailed-possible tech compensation report based on latest-available figures. I’ve taken time to slice and dice the data; so strap in because today we’re talking numbers – lots of them! We cover:
- Overview of sources. 951 data points, mainly from engineering managers and senior+ engineers in the US, EU and UK.
- Base salary, cash compensation, total compensation. A summary of how these compare at the 75th and 90th median percentiles.
- Regional pay comparison. Unsurprisingly, the US pays best by quite a distance. However, other regions pay $200K+ in total compensation at the 75th percentile.
- Compensation by seniority. How seniors with 5-10 years of experience, those with 10+ years, and executives, are paid across the globe: US, UK, EU, India, Asia, Austria and New Zealand, Latin America, Africa.
- Compensation by funding stage. Pay at bootstrapped, early-stage, mid-stage, late-stage and public companies in the US, EU and UK.
- A closer look at the 90th percentile, by funding stage. Something odd is happening to executive packages at late-stage companies: it’s extremely high!
- Outliers. The top 3 data points from each category of founders, non-founder executives, and publicly traded companies execs. It’s interesting a principal engineer takes home more in cash compensation than most executives filling out the survey, in illiquid stock.
- Interesting findings. Bootstrapped companies pay surprisingly well in cash terms, and neither sector nor engineering team size make a difference to how much you earn.
As a related topic, last year we covered Compensation at publicly traded tech companies.
1. Overview of sources
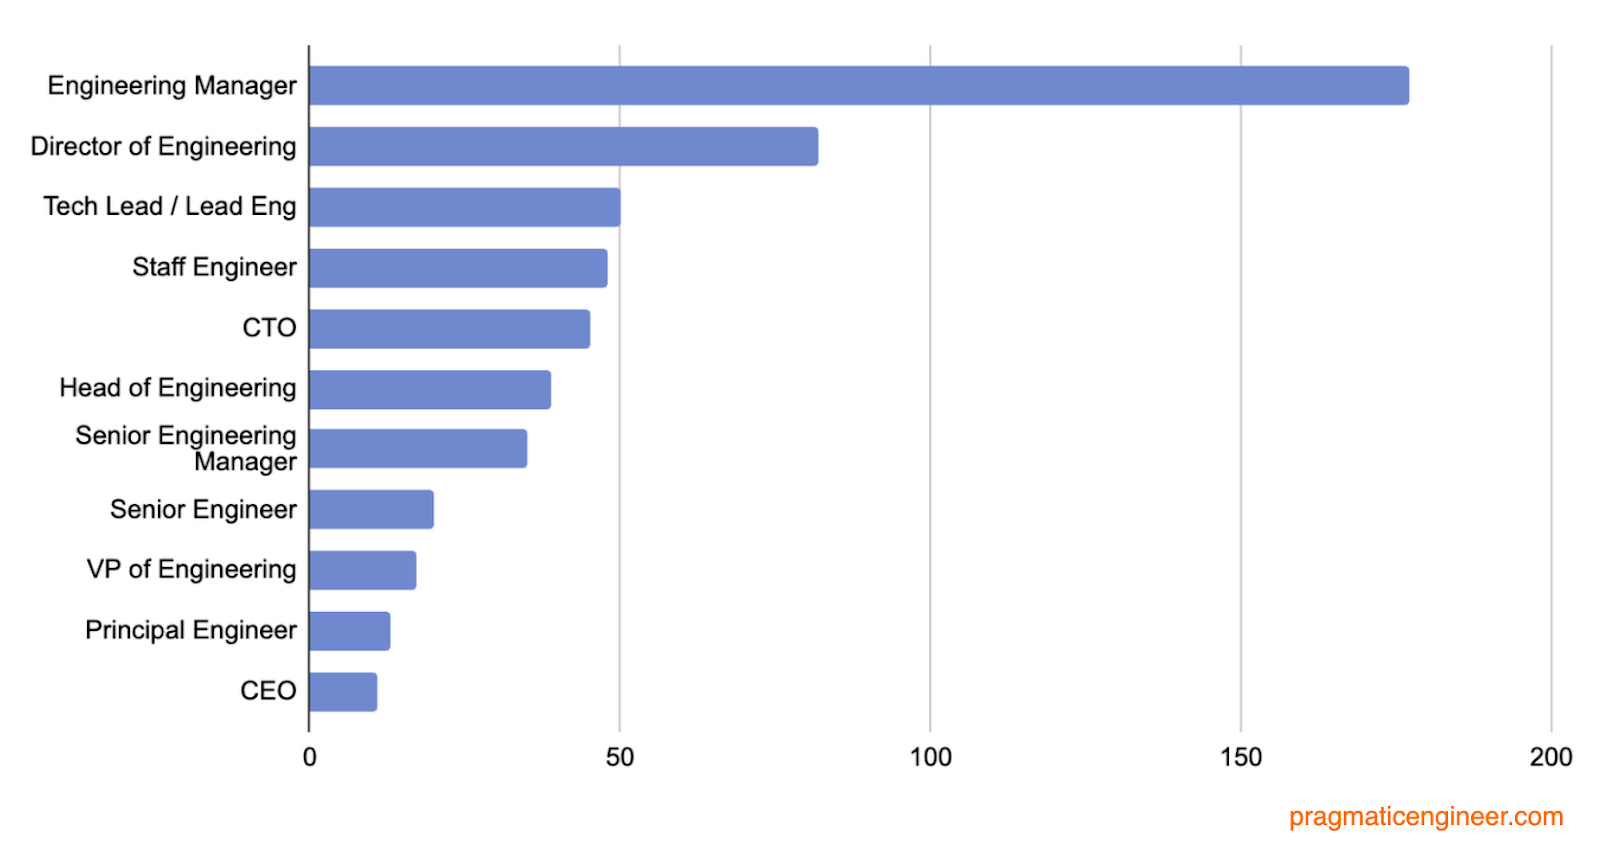
After cleaning the data, the report has 951 data sources. Around two-thirds of respondents work in engineering management or engineering leadership, and nearly a third in software engineering:

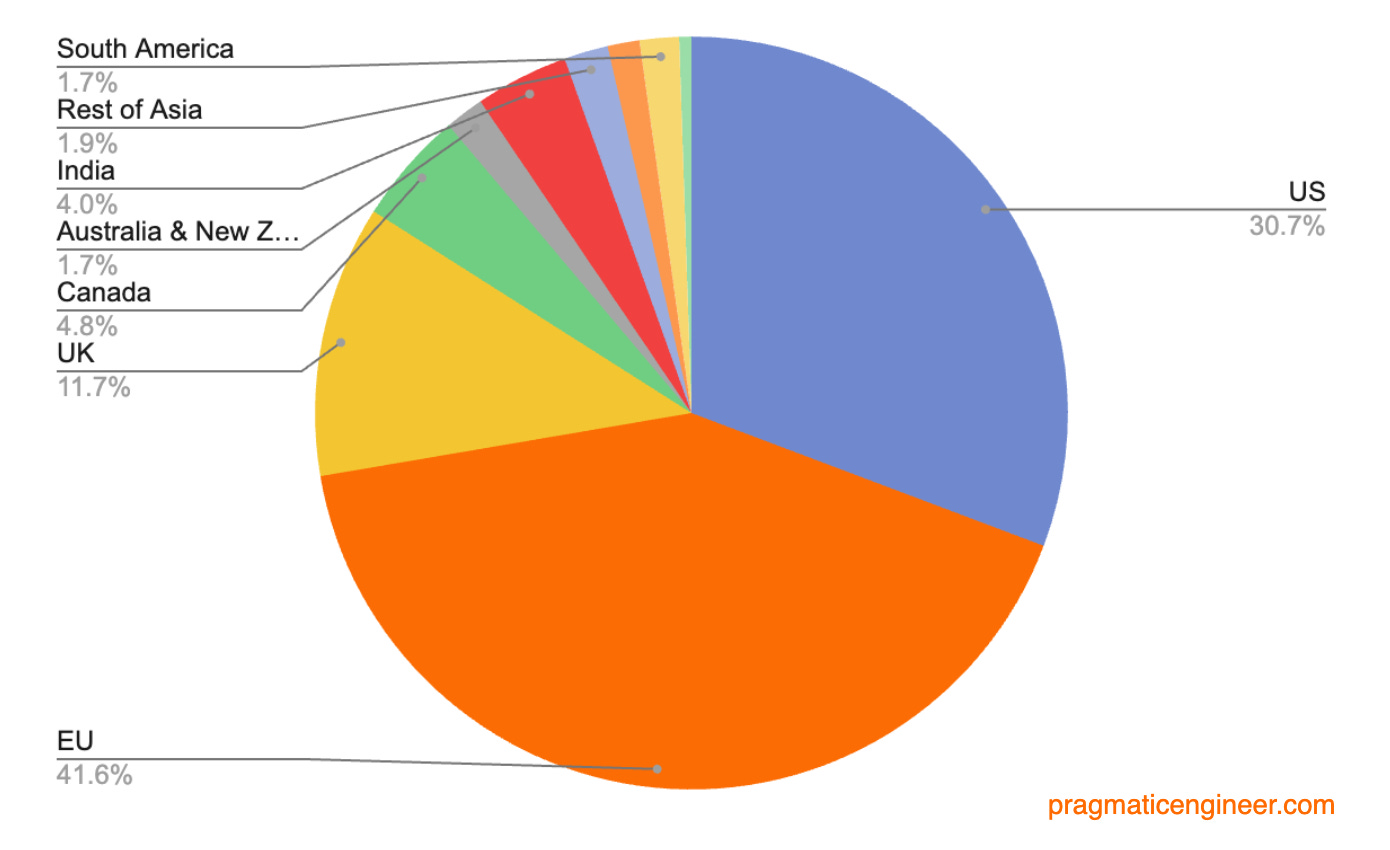
Region-wise, most of the data is from US, EU, and UK readers, but responses came in from every continent on earth – except Antarctica!
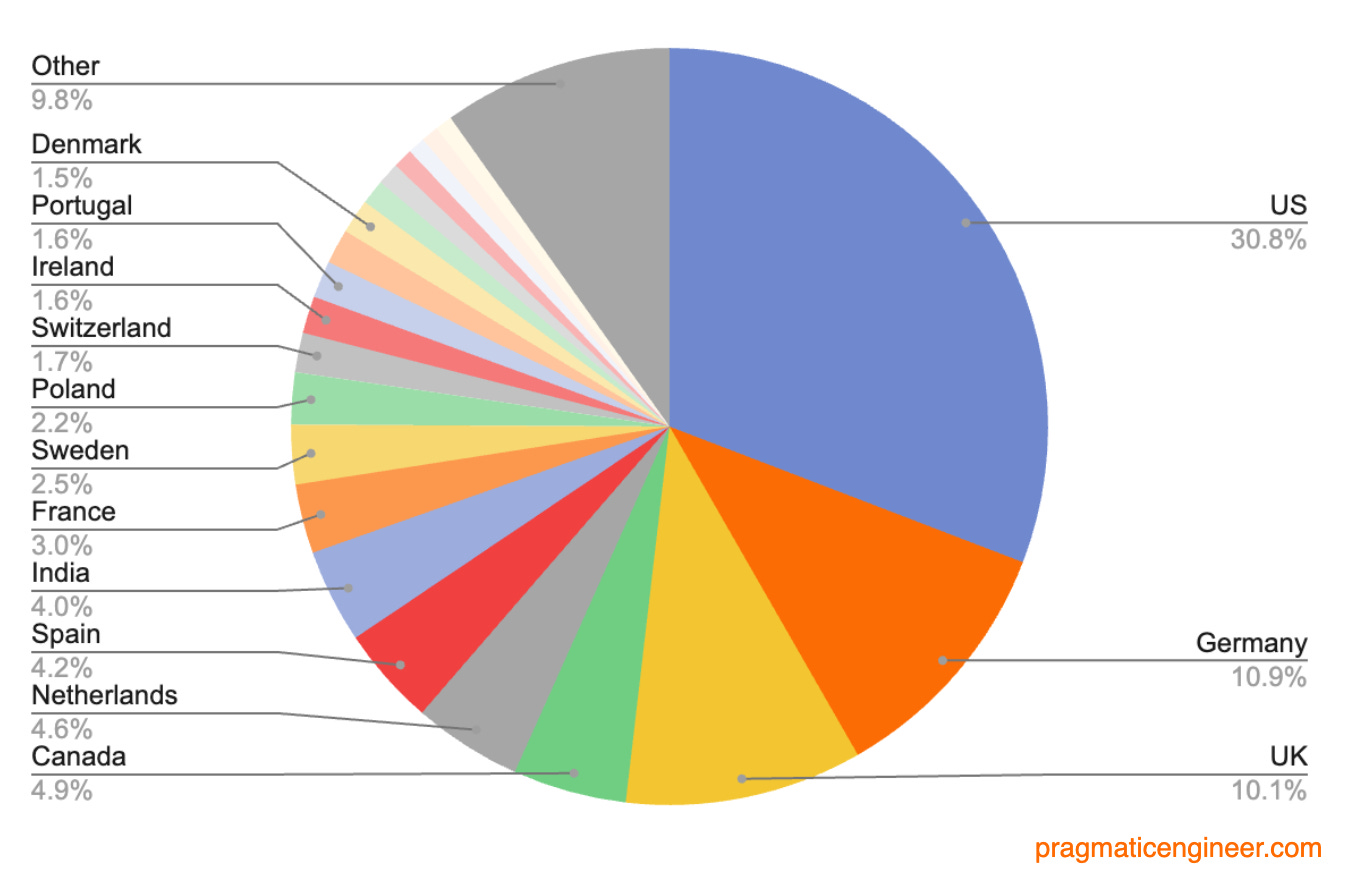
Top 20 countries by response:
2. Base salary, cash compensation, total compensation
Let’s get into the numbers, first by comparing base salary data across all regions. Base salary is the part of your compensation that’s guaranteed, no matter performance or other factors. In the US, Canada, Australia and most of Latin America this is usually paid fortnightly, while in most of the EU and the UK it’s often once per month.
Here’s a cross-region comparison, with the median, 75th and 90th percentiles in US dollars:

Total cash compensation is base salary plus cash bonus (usually at the end of the year) and any sign-on bonus. You can’t guarantee to definitely get your total cash compensation, but knowing some numbers might help in negotiations:
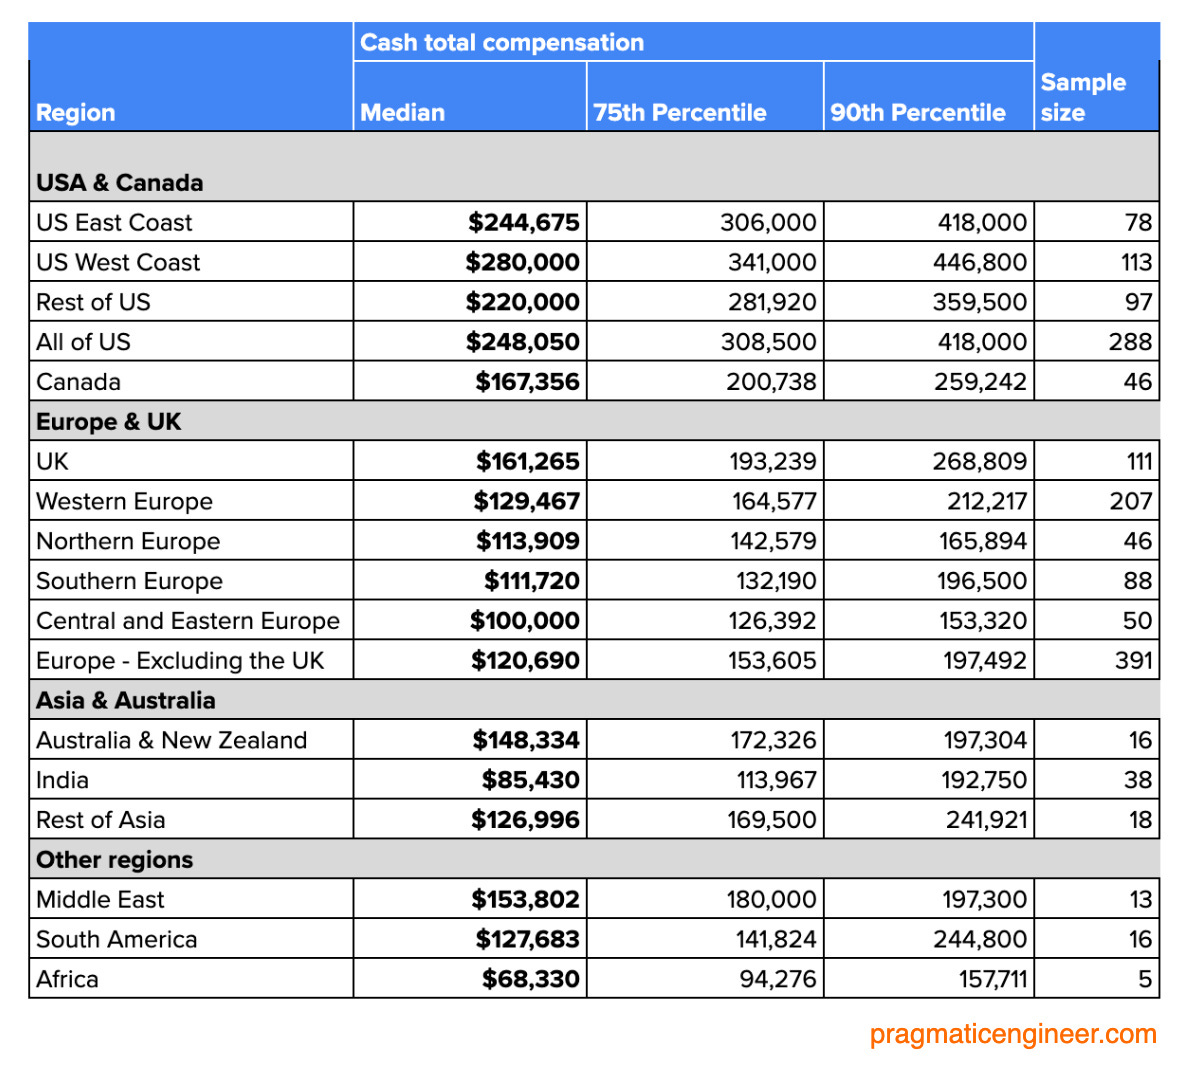
Total compensation is cash total compensation, plus equity grant. This equity can be illiquid at privately traded startups and scaleups, or liquid at public companies. In context, ‘liquidity’ refers to an asset’s ability to become cash. For liquid equity, there’s the option of selling equity on the stock market for cash after it vests – assuming there’s no “blackout” period. Illiquid equity can be sellable at a liquidation event like an acquisition, going public, or a secondary equity sale.
Breakdown by region:
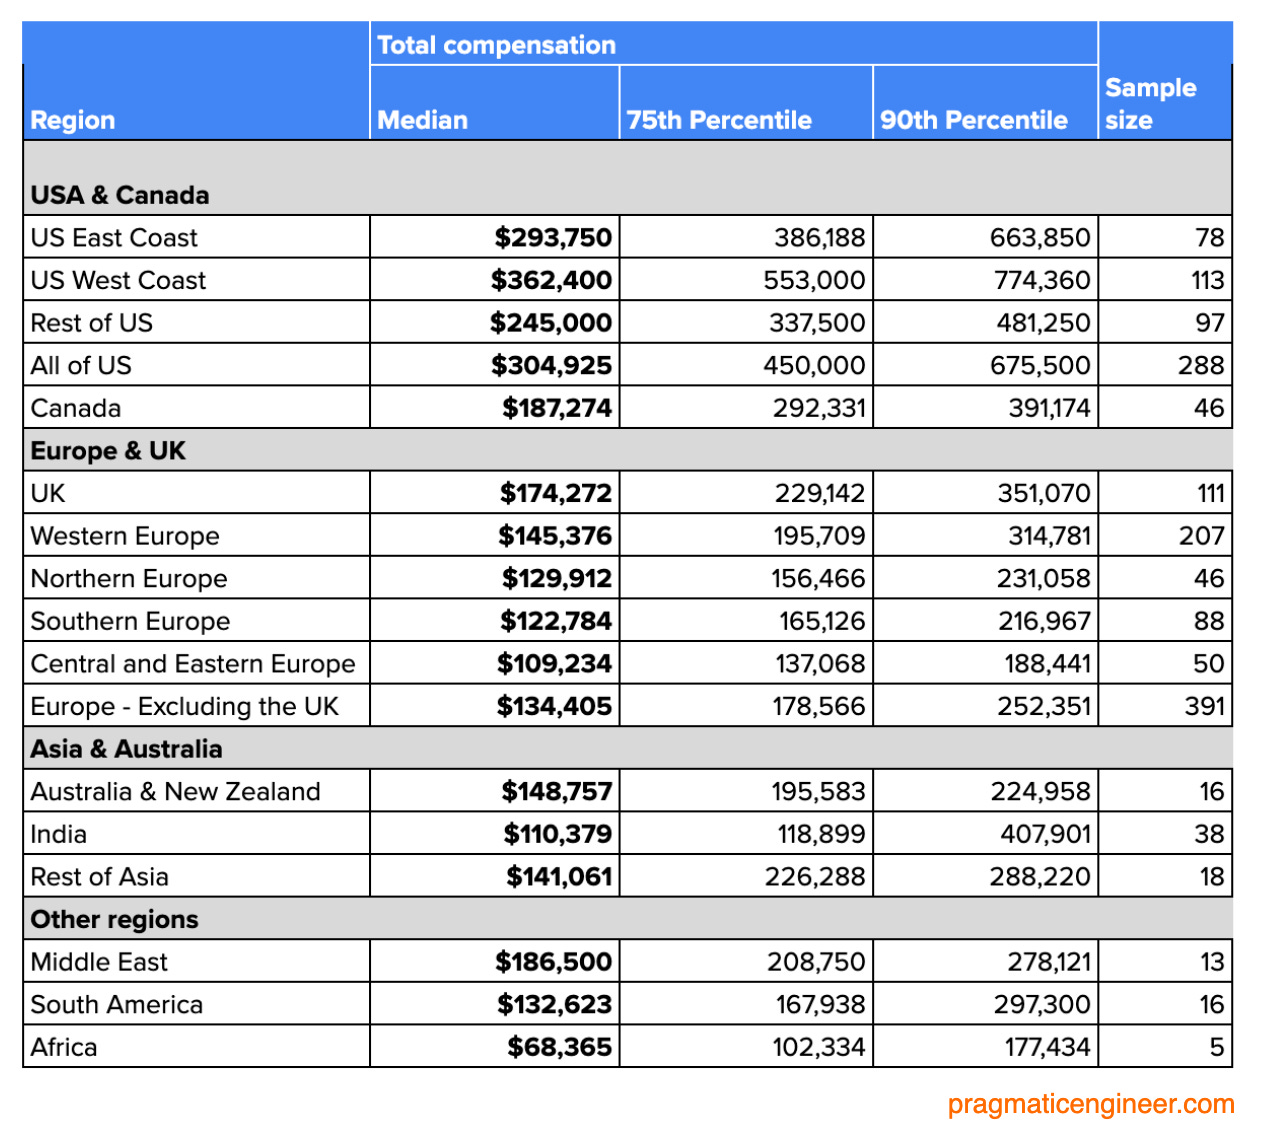
3. Regional pay comparison
Let’s see all these numbers in a single chart for easy comparison:

This chart is packed, and difficult to zoom. For easier browsing, check out this Google Document here.
And here’s the same chart in local currencies.
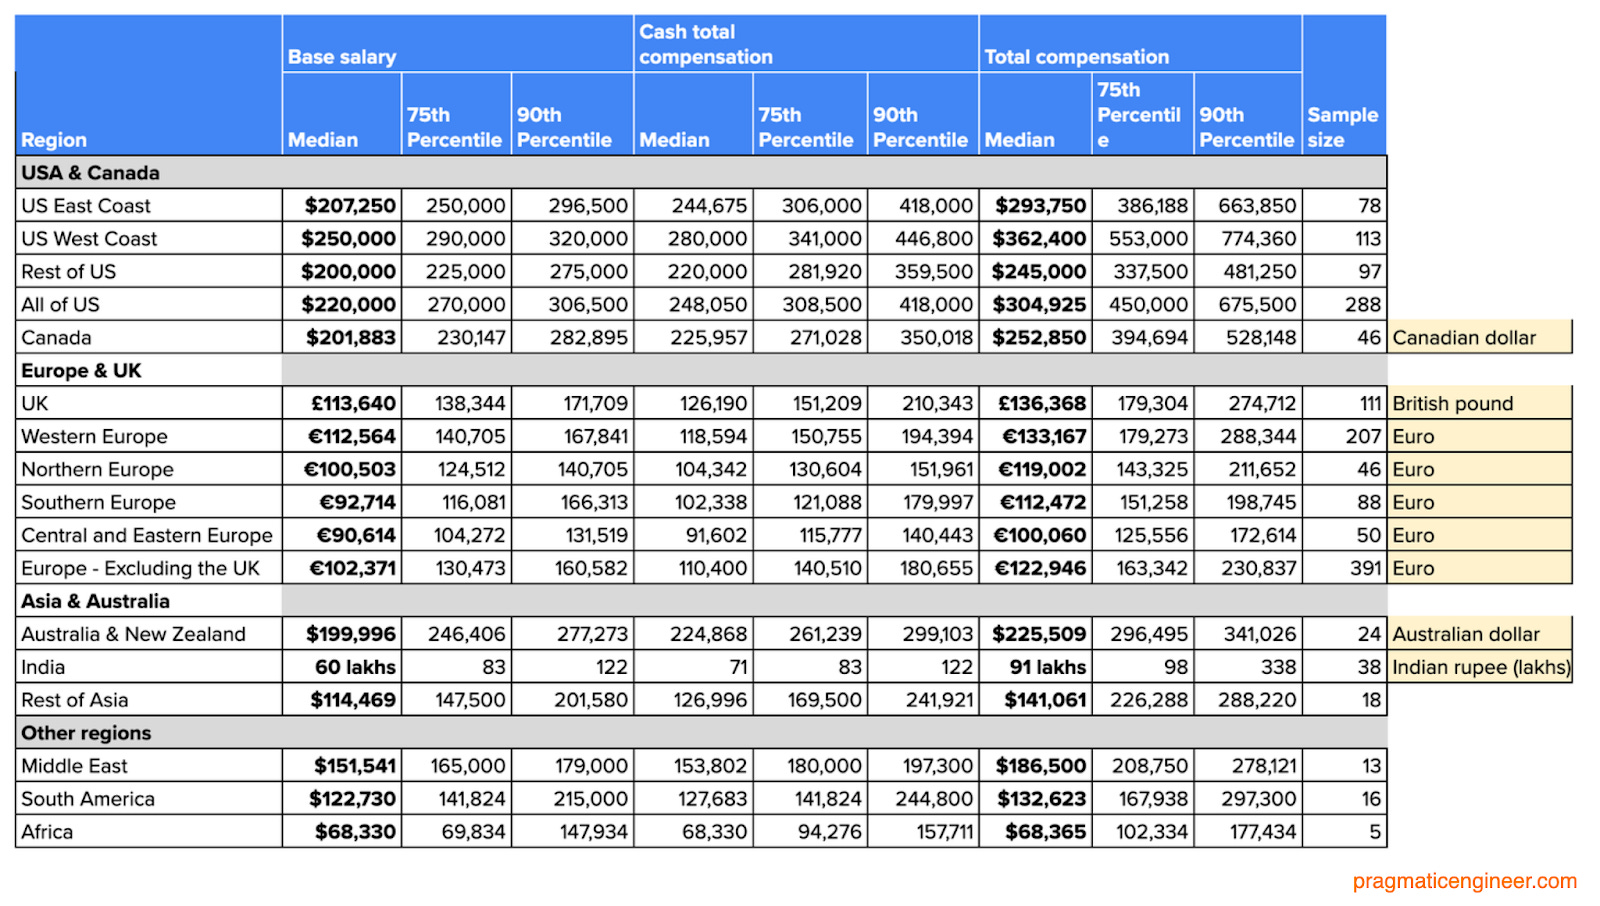
Here are some topline takeaways on pay from across the globe:
- US pays the highest senior+ tech compensation. It has at least 50% higher base salary and total compensation than anywhere else.
- US West Coast offers 2x more total compensation than other countries. By median total compensation, the US West Coast’s numbers are 2x or more higher than Canada, the UK, and Europe.
- The Middle East has higher median numbers than Europe and the UK. Most Middle East data points came from Dubai (UAE,) and Tel Aviv (Israel.) Although there are fewer data points, it’s notable the Middle East has such strong compensation packages.
- UK > Western EU > Northern EU > Southern EU > Central EU. That’s compensation packages by descending order. For base salary and total compensation, I was a bit surprised western Europe packages are higher by median than the Nordics with its higher cost of living.
- India has standout 90th percentile packages. Compensation packages in India are lowest across all regions, but the 90th percentile is higher than in the UK, EU or Canada! This upper percentile is mostly VP, CTO, and CEO packages. It suggests being an engineering executive in India can be very profitable.
- The median salary is at-or-above 6 figures (in USD) almost everywhere. Save for India and Africa, median base salaries for senior+ roles are at or above $100,000.
- In some regions, the 75th percentile total compensation is at or above $200K. In the US, median base salary is at or above $200K for senior+ roles.What I find interesting is that 75th percentile total compensation packages are also at or above $200K in the UK ($229K,) East Asia ($226K – driven by data points from Singapore,) Middle East ($208K), western Europe ($195K,) and Australia & New Zealand ($195K.)
4. Compensation by seniority
So far, it’s been aggregated data. However, some very interesting data points are revealed by breaking down compensation into three buckets:
- Senior-level roles with 5-10 years’ experience. Usually senior engineers, engineering managers, some staff engineers.
- Senior+ roles with 10+ years’ experience. Usually experienced engineering managers, staff, and principal engineers.
- VP and C-level positions: Head of Engineerings, VP of Engineerings, CTOs.
Let’s take a look by region:
United States
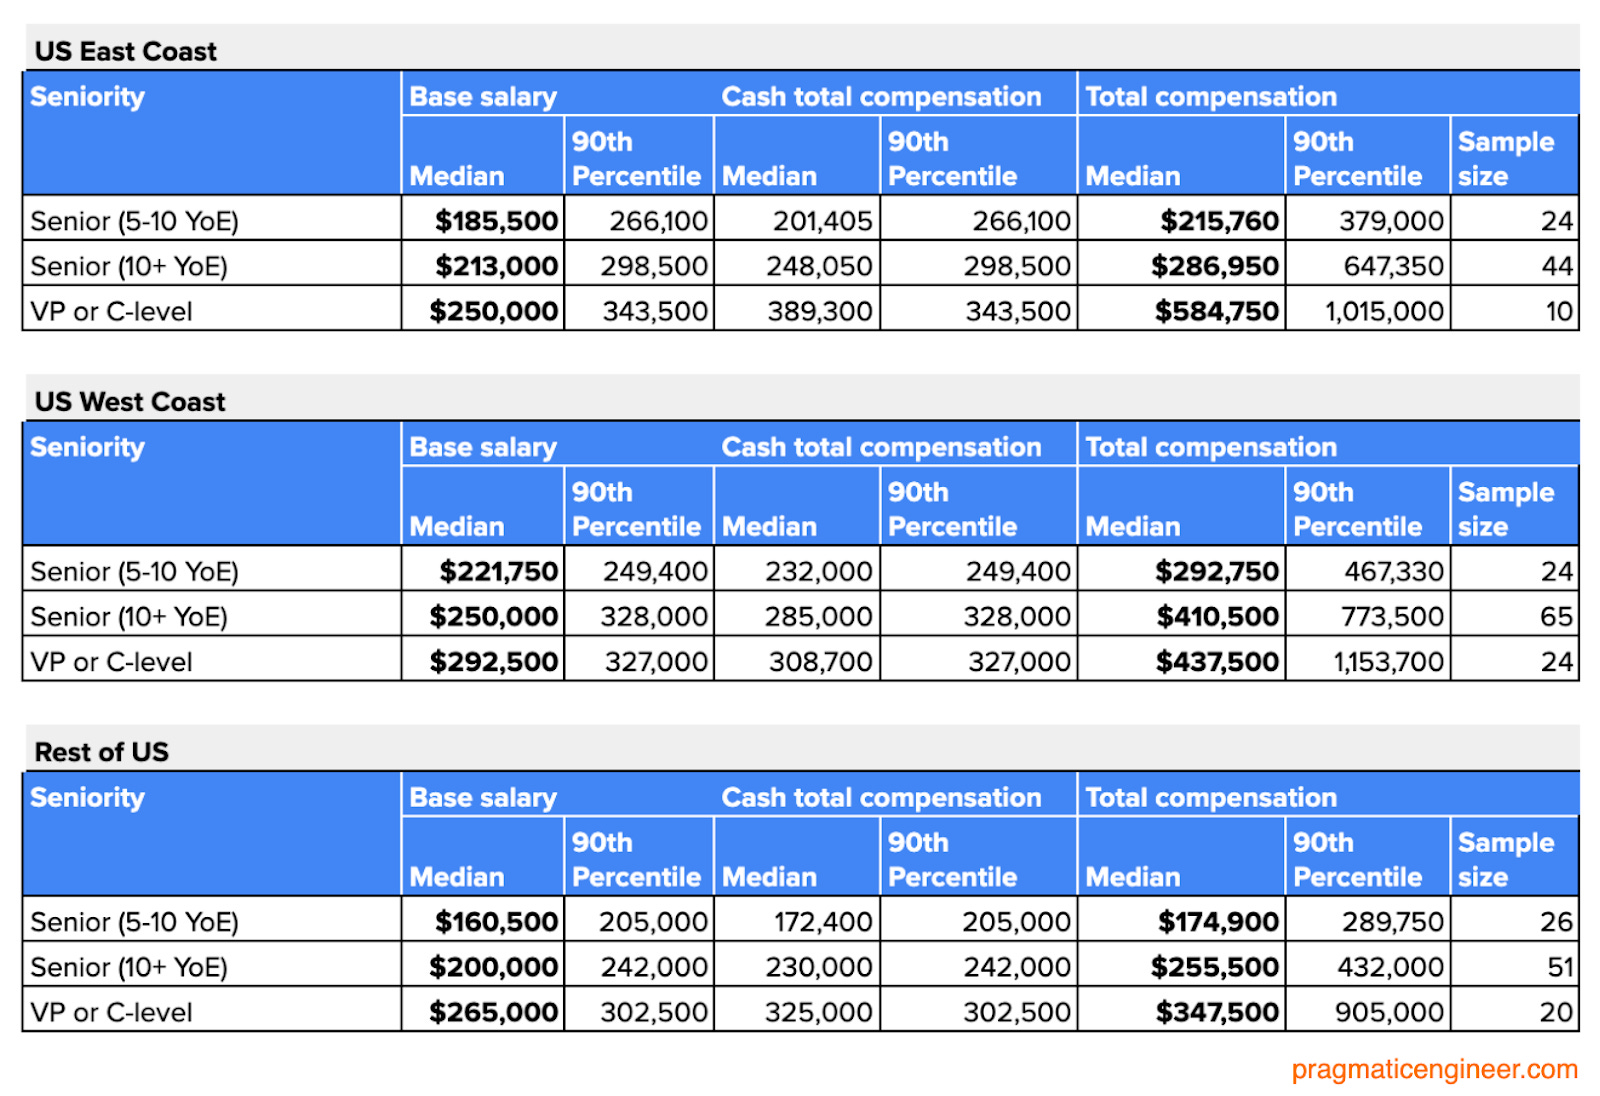
One small surprise is that median compensation for VP/C-level on the East Coast is much higher than on the West Coast! This is likely a sample bias; there’s 10 East Coast data points, and 24 for the West Coast.
In general, West Coast > East Coast > Rest of US for median and 90th percentile compensation packages.
Canada and the UK

One minor surprise is that the 90th percentile in Canada is close across all categories. In the data are:
- Senior (5-10YoE):
- An ML Engineering manager with a CAD $220K base and $1.5M worth of stock vesting over 4 years at a publicly traded company
- A Head of Development with a CAD $250K base salary and a 40% cash bonus target
- Senior (10+ YoE):
- A principal engineer in Vancouver making CAD $220K base, and $1.5M worth of stock vesting over 4 years at a Series B company
- An engineering manager in Ottawa with CAD $220K base and $1.2M of stock vesting over 4 years at Series D company
- VP & C-level
- A VP of Engineering in Toronto making CAD $375K in base salary + 30% cash bonus at a non-venture-funded company
- A CTO at fintech making USD $275K in base salary, a 40% cash bonus target and $150K per year vesting in stock
From these details, it’s clear the 90th percentile numbers are all managers, some with under 10 years’ experience.
The EU


A minor surprise in these numbers is that the VP or C-level median compensation in the Nordics looks out of place being lower than southern Europe, and on a par with Central and Eastern Europe (CEE). Or perhaps this is the CEE region punching above its weight? The 90th percentiles do paint the clear picture of western Europe > Nordics > southern Europe > Central and Eastern Europe, though.
It’s worth keeping in mind there are fewer data points from northern Europe, and Central and Eastern Europe, than other regions.
Australia, India, Asia, Latin America, Africa
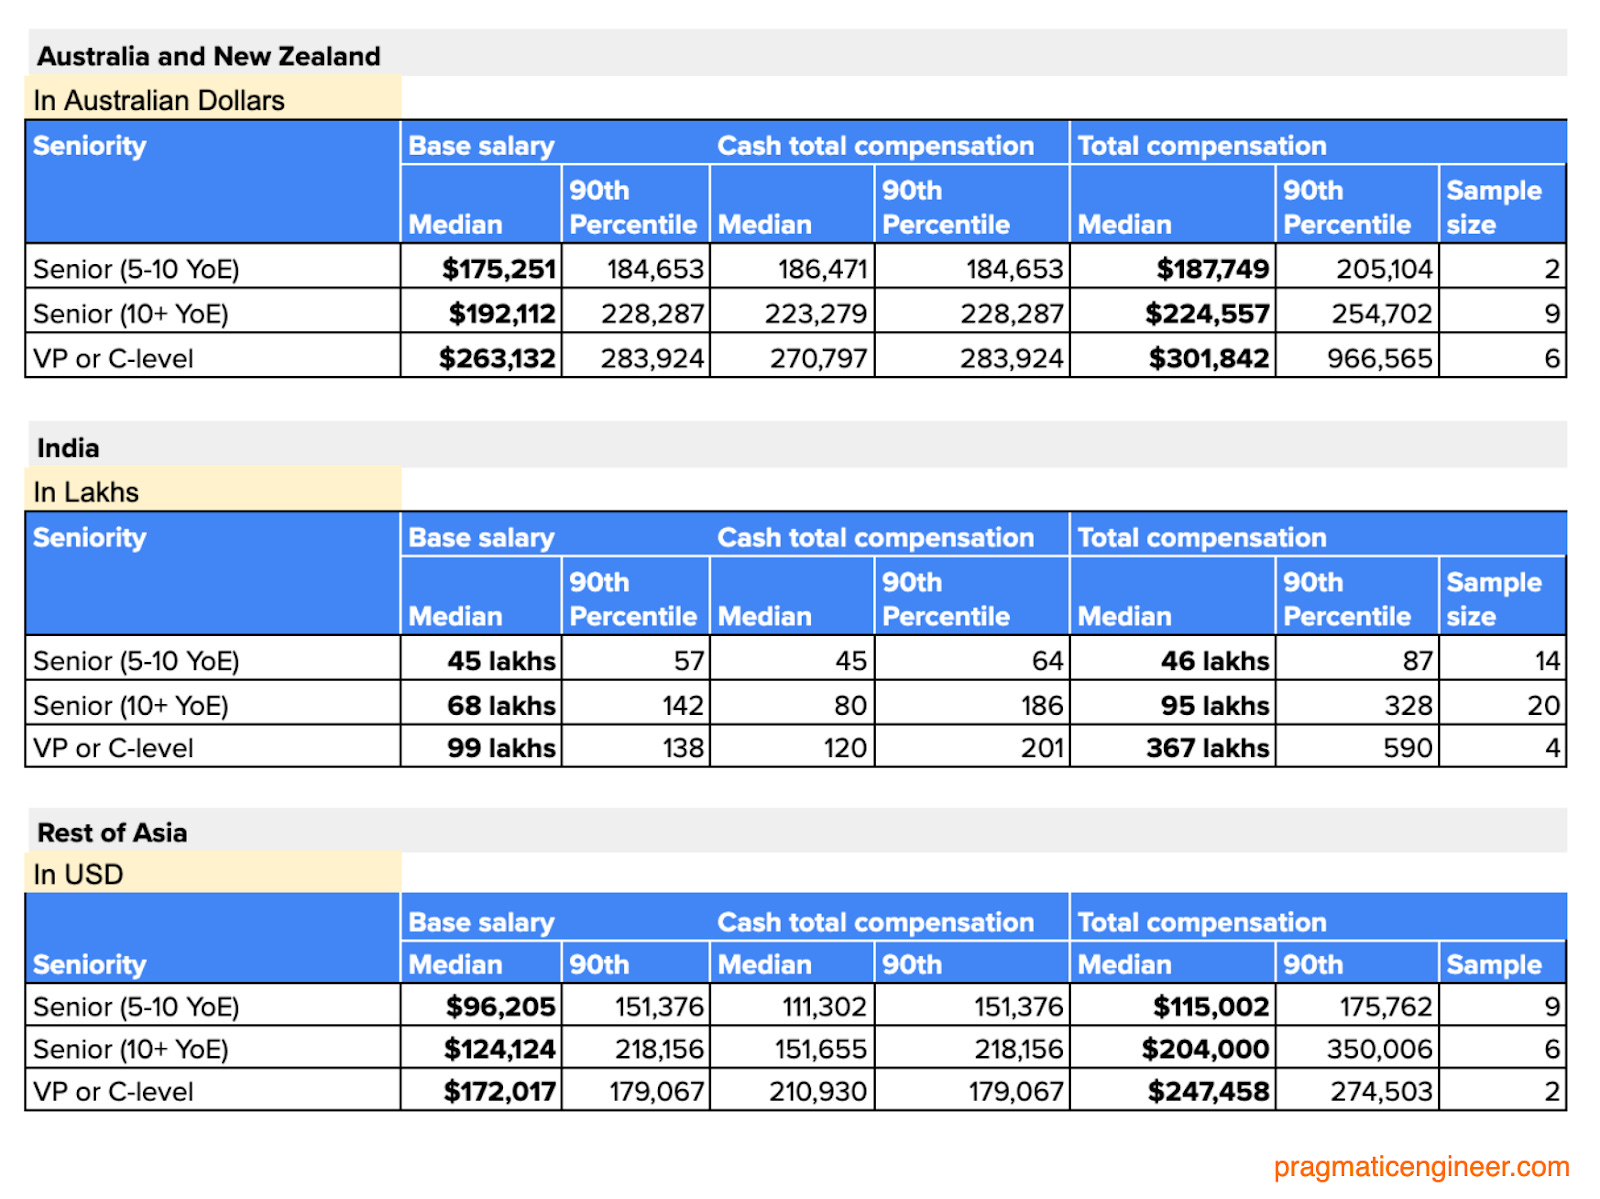

There were fewer responses from the regions above, than from the US, EU, Canada and UK; meaning there’s a higher chance they’re outliers. Still, the data points seem to fit expectations: compensation is higher in the Middle East, Australia and East Asia, and lower in India, South America and Africa.
Australia is an outlier, where a cofounder and CTO at a late-stage company reports earning close to AUD $300K in base salary, with an equity package worth more than $5M.The company in question has raised more than $50M in funding, and the data point could be seen to show the scope and influence of company founders in negotiating their own equity packages. I calculate this package vests over 4 years, but it’s equally possible this cofounder vested, already.
5. Compensation by funding stage.
Let’s see how compensation differs by funding stage:
- Bootstrapped companies. These don’t raise venture funding and have no plans for an exit, meaning they usually don’t issue equity. Note, it’s not just small companies in this category, but also giants like Bloomberg and IKEA.
- Early-stage startups. These have raised pre-seed or seed rounds. At this stage, companies have usually raised a few million dollars, earn little revenue, and are working on a product-market fit. These places are often riskier from a job security standpoint because they could run out of money. However, they also offer a lot of upside thanks to equity; there’s the opportunity to be part of something potentially big.
- Mid-stage startups. These have Series A and Series B funding, and are expanding after finding their product-market fits. They may be loss-making, due to investing heavily in growing market share and gaining customers. Often, they’ve raised tens of millions of dollars, and are valued at hundreds of millions of dollars.
- Late-stage startups, These are at the Series C funding round, or have recently passed it. These companies are aggressively expanding market and customer bases, and may hope to go public, sooner or later. Most have raised $50M or more in funding, and are often valued in the billions of dollars.
- Publicly traded companies. These are listed on the stock market. From an employee’s perspective, the biggest difference is that the equity part of their compensation packages is liquid (they can sell shares when those shares vest), unlike other types of companies!
US


EU


UK

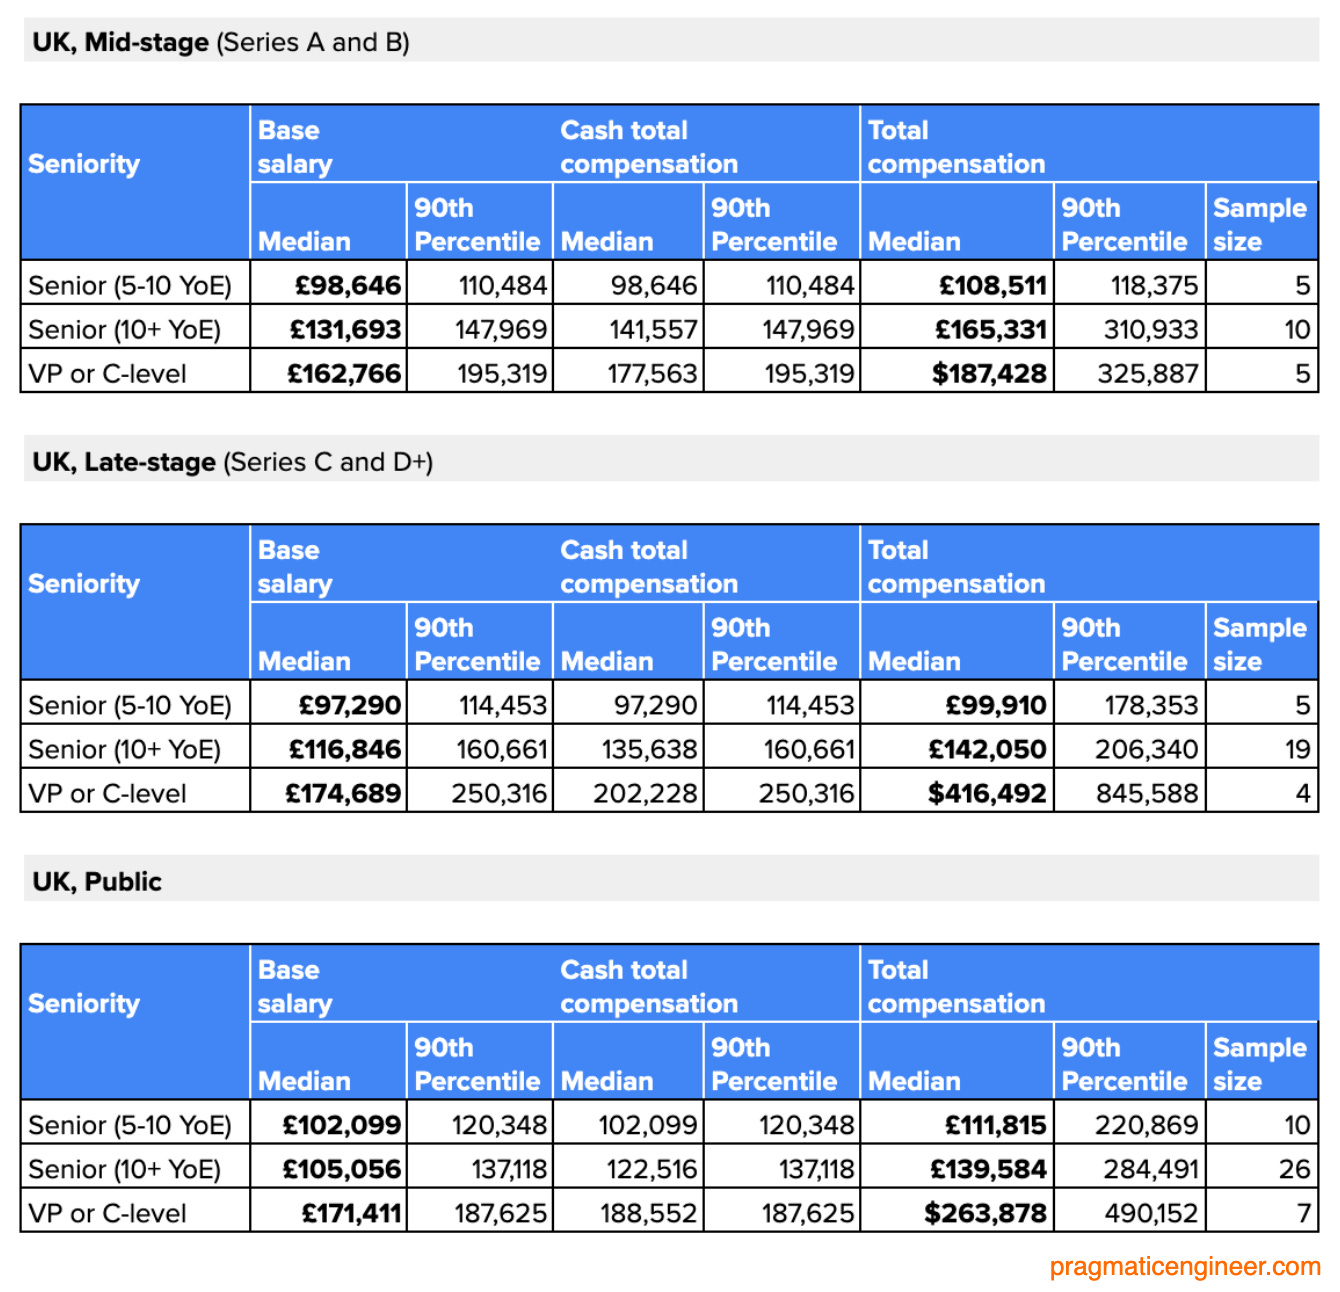
6. A closer look at the 90th percentile, by funding stage
Ninetieth percentile packages are outliers, by definition. In the survey this group provided equity compensation numbers in a digestible way. As a result, the 90th percentile gives insight into theoretically achievable total compensation levels at the top of the market, and the breakdown between base salary and equity.
Senior managers & engineers (10+ years’ experience)
First, the US senior (10 YoE+) group:

A surprise: bootstrapped companies pay more in total cash compensation than any other group at the 90th percentile! I assume that 90th percentile data points may be hedge funds, or other non-VC funded fintech companies.
Early-stage companies offer least in cash compensation and total compensation, and publicly traded companies the most. No surprise there.
It’s a slightly different picture in the UK and EU:
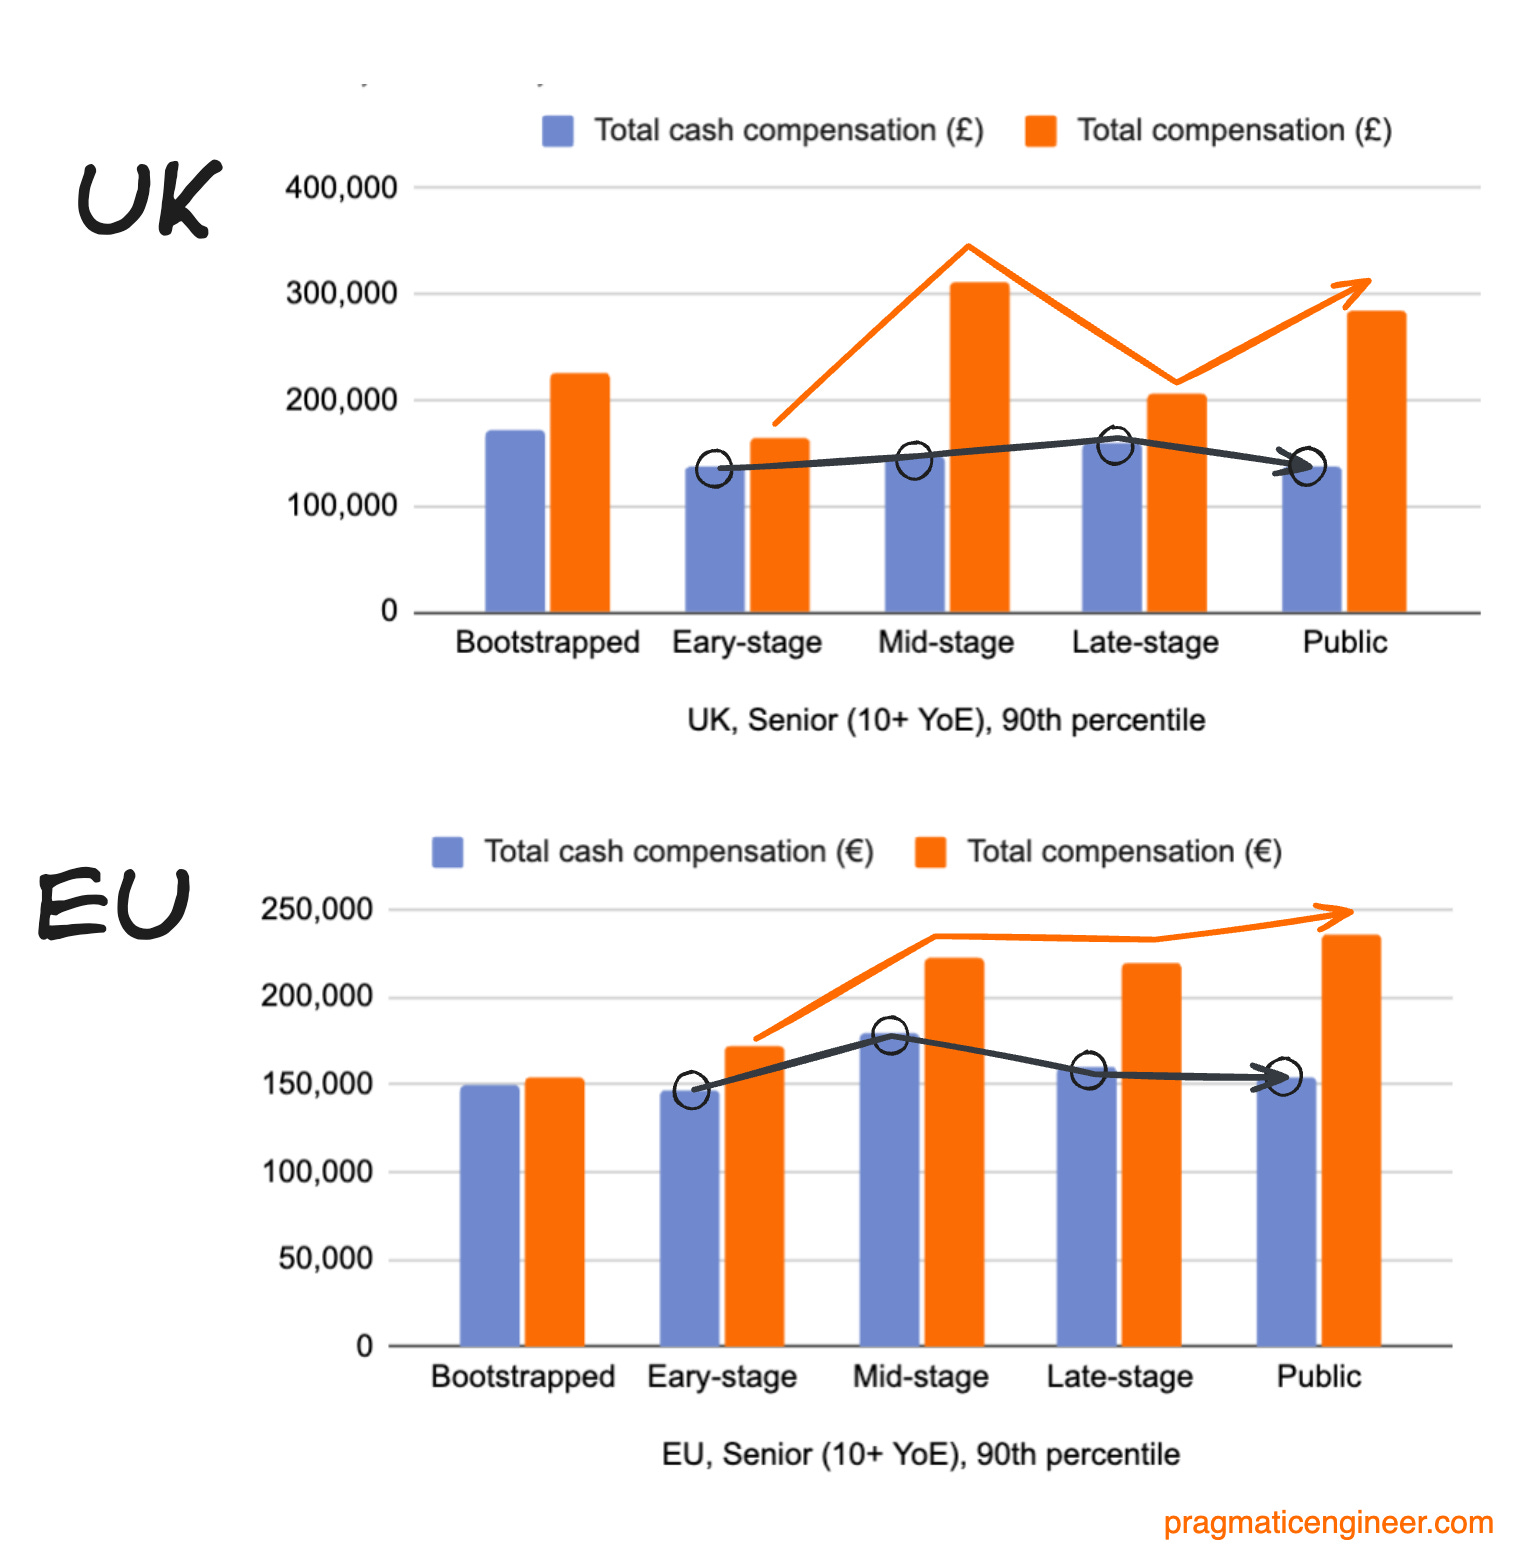
Bootstrapped companies pay on-par cash compensation with other types of business. In the UK, mid-stage companies offer more equity than later-stage ones. In the EU, it’s roughly equal from mid-stage and beyond.
I was surprised by the lack of equity at mid and late-stages. The thing about equity is that it’s a form of risk as mid to late-stage scaleups might never go public. You’d imagine they’d compensate for this by offering more equity than publicly traded companies, but they don’t seem to. And at the 90th percentile, the data points are mostly “top” performers and hires.
Why are publicly traded companies offering more in total compensation for the 90th percentile senior (below executive) than private startups and scaleups? Possible reasons:
- Publicly traded companies are willing to handsomely compensate “top hires” and match private company stock packages.
- Below executive levels, cash compensation is much more important, so people negotiate for cash, not equity. For startups and scaleups that don’t go public, this is a better overall strategy.
- Mid and late-stage startups don’t want to offer more equity than publicly traded companies do. They sell the story that there's plenty of growth to come.
VP and C-level
These assumptions get interesting when we check executive compensation, which is highly varied in the 90th percentile. Let’s start with the US:

Wow, late-stage firms push total compensation to nearly double that of publicly traded companies! At the same time, total cash compensation is similar across all stages, and mid to late-stage companies offer a lot more equity compensation.
Is the US market an anomaly? Let’s check the UK and EU:

At mid-stage, there’s no similarity in the UK and the EU. But for late-stage companies, this pattern is more even pronounced: total compensation for VP and C-level folks at the 90th percentile is nearly triple in the EU, versus publicly traded companies in the region. Across the Channel, it’s closer to double in the UK. What’s the reason for late-stage companies paying so much more in equity at the 90th percentile?
Executives are likely savvy enough to weigh the risk of equity during pay negotiations at late-stage companies. At publicly traded companies, equity carries very little risk because it can be sold. It can’t at late-stage companies and this has risk:
- Company valuation may be significantly down when it floats on the stock market. Instacart was valued at $39B in 2021, and has a $9B market cap today.
- The company might not go public. Stripe is a strong business and still private, 13 years after being funded. Its valuation is down from around $95B in 2021, to $50-65B at time of publication.
It seems the 90th percentile of C-levels and VPs know the risks and negotiate packages that reflect this; companies give them this additional equity. Good on them! At the same time, it is striking that it’s only the executive level that negotiates this package.
I showed these graphs to two CTOs at scaleups who confirmed this reasoning. What has changed in 2024 is that the differences in compensation packages are less pronounced: late-stage companies are less willing to offer such a premium on their equity. A lot of this has to do with how the job market for engineering executives has become an “employers’ market.”
7. Outliers
The biggest total compensation packages are “cash-light.” Top-of-the-top data points are obviously outliers, but still I’m sharing them as they illustrate that the highest total compensation numbers often contain risk.
Here are the top 6 submitted data points: 3 founders whose equity compensation is expected to be high, and 3 non-founders.
Founders
- CEO of a Series B company, $50M+ raised. Based in the Southwest of the US, their company has around 30 staff, and all are in engineering. $3.3M in annual total compensation, split as:
- $275K base salary
- 25% cash bonus
- $12M in stock as RSUs (vesting over 4 years).
- CEO of a Series C company with a consumer focus, $20-50M raised in total. Based in Germany, their company has around 160 staff, of which around 100 are in engineering. $1.8M annual total compensation, split as:
- €230K salary ($251K)
- No cash bonus
- €6M ($6.5M) in stock as phantom shares vesting over 4 years.
- CTO a Series A, B2B SaaS company, $4-10M raised. Based in France, their company has 70 employees, 20 of whom are in the tech org. $1.7M in annual total compensation, split as:
- €60K salary ($65K – yes, this is low!)
- No cash bonus
- €6M ($6.5M) in stock (vesting over 4 years)
No founders have liquid stock, meaning most of their total compensation is on paper; such as the Series A company CTO in France with a base salary of Є60K cash and millions in stock. This is what “cash poor, equity rich” looks like.
This founder CTO is, without doubt, paying themself less than the market rate; most likely on purpose to lengthen their company’s runway. At the same time, as a founder it’s easier to sell some shares during a fundraise as a secondary transaction, than it is for an employee to do that. Indeed, they may have done this already, and so drawing a very modest salary works for them.
At the early stage, success is far from guaranteed, so the actual value of that €6M stock package could be anywhere from zero, to the moon. It all depends on whether the company has an exit in future, or shuts down.
Non-founders
- Head of Engineering at Series D company, $50M+ raised. The company has 210 staff, 85 of whom are in tech. $2.8M in annual compensation, split as:
- $300K base salary
- 33% cash bonus
- $10M stock as ESOP stock options, vesting over 4 years
- SVP Engineering at Series D+ company, FinTech, $50M+ raised. Their company has 210 staff, 85 of whom are in tech. $2.7M in annual compensation, split as:
- $375K base salary
- $100K sign-on bonus
- No cash bonus
- $9M stock as stock options, vesting over 4 years
- CTO at Series D+ company, FinTech, $50M+ raised. Their company has 210 staff, 85 of whom are in tech. $1.5M in annual compensation, split as:
- $310K base salary
- No cash bonus
- $5M stock, vesting over 4 years
Top cash compensation data points
Predictably, these are publicly traded tech companies. These are the 9th, 11th, and 12th highest total compensation data points from 951 submissions:
- Engineering Manager in New York with a $1.26M annual package:
- $315K base salary
- $100K sign-on bonus
- 25% cash bonus ($78K)
- $3.1M in RSUs, vesting over 4 years
- Software Engineering Manager in San Francisco with a $1.22M annual package:
- $300K base salary
- $100K sign-on bonus
- 25% cash bonus ($75K)
- $3M in RSUs, vesting over 4 years
- Principal Engineer in Seattle with a $1.2M annual package:
- $475K base salary
- 7% cash bonus ($33K)
- $2.8M in RSUs, vesting over 4 years
We didn’t ask for company names, but I assume these data points are Big Tech (possibly Meta or Google, given the size of comp packages,) or tech companies that compete with Big Tech packages.
What is interesting is that the top three top packages by liquidity belong to non-executives! All three readers who submitted this data have 10+ years of experience, are not at VP or C-level, and yet they take home more in liquid compensation than many executives do in illiquid compensation. No wonder Big Tech and publicly traded companies continue to appeal to standout engineers and managers!
8. Other interesting observations
Near the end, here are some more interesting things in the data.
Bootstrapped companies can – and do! – pay competitively. I was genuinely surprised how well bootstrapped companies perform in this comparison. In almost all categories, they pay total cash compensation on a par with venture-funded companies, and also tend to pay significantly more than early-stage startups.
At the executive level, it’s common for the 90th percentile to offer hefty cash bonuses: 30-50% of salary, with an outlier offering 200% of salary. It’s good to remember that many finance companies, hedge funds, and Bloomberg, are in the “bootstrapped” category, and likely pay at the top of the market.
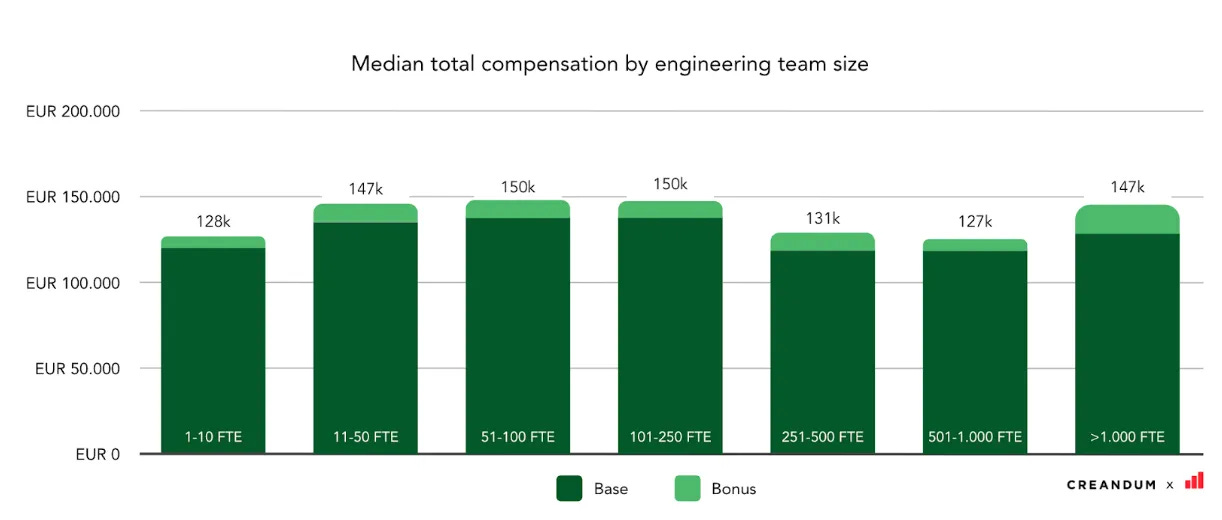
Neither sector nor engineering team-size seem to matter much in comparing compensation, based on slicing and dicing the data by sector (B2B, SaaS, Consumer, Fintech. Here’s how Creandum visualizes this in the European numbers:

Similarly, the survey asked respondents the size of their engineering team, and the numbers don’t seem to correlate with compensation levels. Again, from the European numbers:
There are even larger compensation numbers. Big Tech is present, but I don’t think it has many data points. We didn’t ask for company names in order to provide some anonymity, but in somes cases the numbers speak for themselves. For example, an engineering manager working in Los Gatos, with 10+ years experience shares they have a $650,000/year base salary; no bonus; no equity. This must be Netflix, as one of the company’s main office is there, and this is how the company does compensation: all cash, some of which can be converted to equity, and no cash bonus. There are many unique things about Netflix, including pay. A single engineering level for 25 years used to be another.
Still, there were few to no staff+ and director+ Big Tech compensation packages, tend to break though the $800K level of total compensation in the Bay Area. This is considered the absolute top of the market, and very challenging to get – increasingly so in today’s market! But they do exist.
Don’t forget all these numbers are engineering leadership-heavy. I’d like to close by stressing they overwhelmingly are for engineering leadership positions. The median figures speak to what may be realistic to expect in offers from scaleups, startups, or publicly traded companies.
The 90th percentile is the “outlier,” but the numbers are real and indicate where the top of the market probably is. These represent the top 10% of respondents, and were already in a pretty “elite” group of highly paid professionals!
I suggest not obsessing too much about numbers, but to use them for reference. The reality is that you can’t do too much if your current numbers are a bit lower. Also, the market keeps changing, and right now we’re seeing downward pressure on compensation for engineering leaders. Hitting these numbers could get harder!
Still, I believe that information transparency is helpful, and I hope this data helps you in future salary negotiations, or when revisiting your organization’s benchmarks.
But don’t forget that just because compensation is measurable, it’s not the only thing that matters! Many other things define whether one job is “better” than another, as illustrated below:
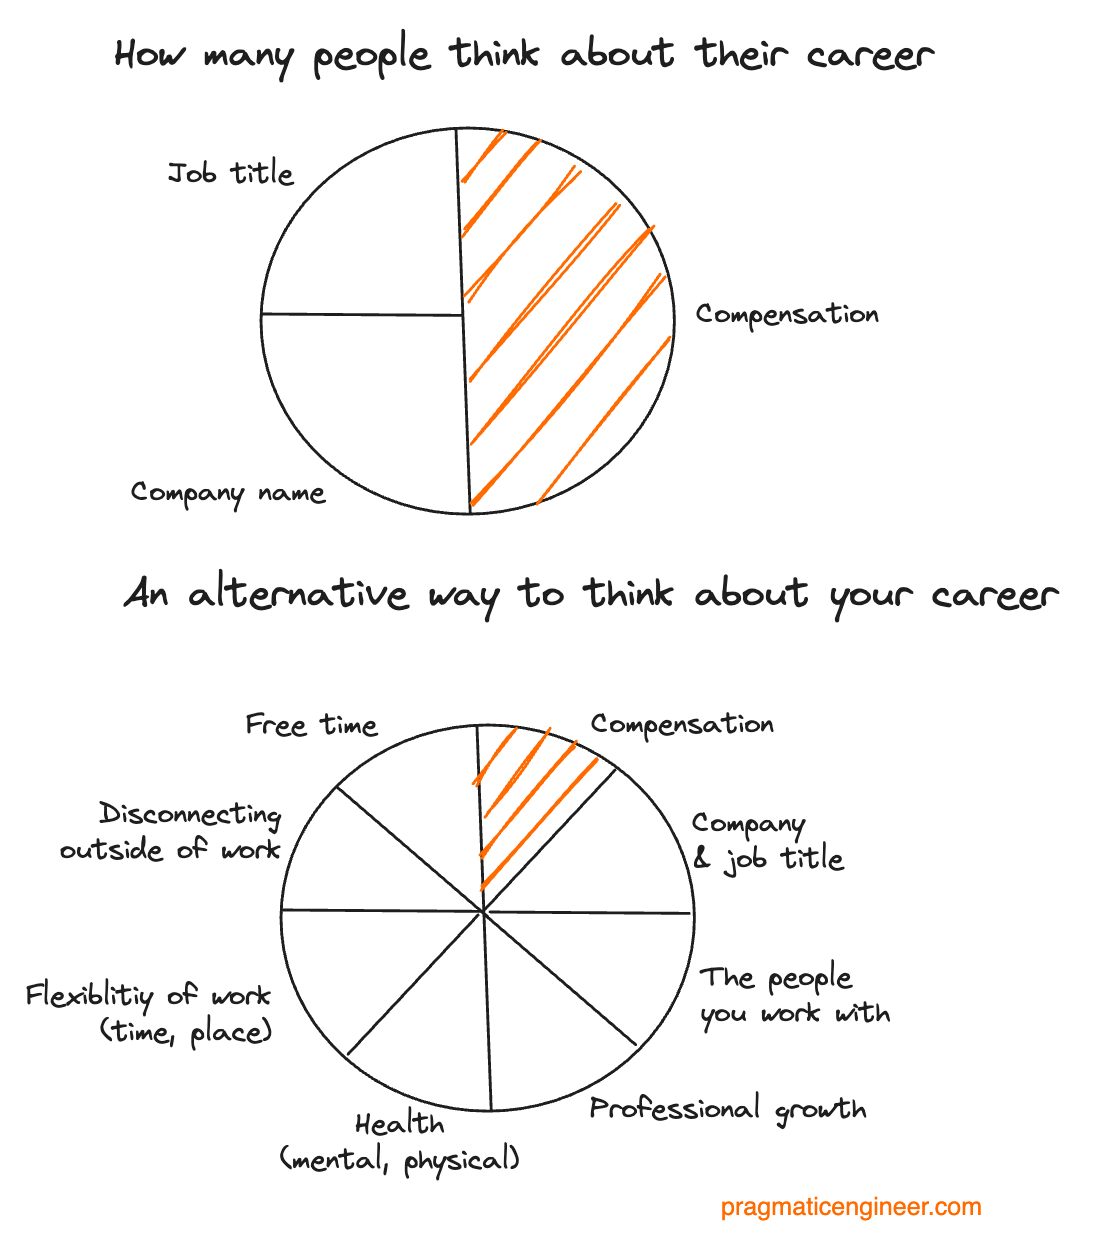
I hope you found these numbers useful! Browse all data in a Google Sheets document, here.