Investor Perspectives #2: How to Beat the Market?
Length: • 6 mins
Annotated by Andrew
Investor Perspectives #2: How to Beat the Market?
Hi there —
Welcome back to Investor Perspectives by Market Sentiment. This is the second report from our exclusive 7-part series focused on making you a better investor. In this issue, we will try to find an answer to a puzzling question in investing:
If you look closely, the S&P 500 strategy is as simple as "buy big stocks." Yet, only 6% of actively managed funds beat the S&P 500 over a 20-year period. Why does this simple strategy work so well? And also, what will it take to outperform it?
Let's dig in:
Nothing in the world can take the place of persistence. Talent will not; nothing is more common than unsuccessful men with talent. Genius will not; unrewarded genius is almost a proverb. Education will not; the world is full of educated derelicts. Persistence and determination alone are omnipotent. - Calvin Coolidge
Passive index fund investing is a relatively new phenomenon. The New York Stock Exchange traces its origins to the Buttonwood Agreement signed in 1792. Only after 200 years did Jack Bogle invent the world’s first index mutual fund in 1975. In fact, just two decades back, active funds held 6.5x more assets under management than passive funds. By 2007, passive funds had picked up and had $1 Trillion invested compared to the $3 Trillion in active funds. The 2008 financial crisis made investors lose faith in the financial industry in general and only accelerated the shift to passive funds. Finally, history was made in 2019 when passive funds overtook active funds for the first time!
The success of passive funds is driven by the shoddy performance of active funds, the impact of fees on long-term performance, general distrust in the system, and blessings from legendary investors such as Warren Buffett, Jack Bogle, Charlie Munger, etc. To put the performance difference in context, only 6% of the actively managed large-cap funds managed to beat the S&P 500 over a 20-year period.
Think about that for a minute: Only 1 in 16 managers with access to million-dollar data streams, teams of quants, and whose only job is to outperform the marketwere able to do so consistently. It becomes ludicrous when you break down the S&P 500 strategy - “buy big stocks”! That’s it - Simply put, the S&P 500 index just tracks the top 500 profitable companies in the U.S. stock market.
So why does this seemingly simple strategy outperform the majority of fund managers?
Why index investing works
For a company to be included in the S&P 500 index, it has to satisfy the following criteria
- The company should be from the U.S, and shares should be highly liquid
- Market cap > $8 Billion
- Positive earnings in the recent quarter and positive total earnings in the previous year
The strategy is as simple as it gets. The index committee meets every quarter, reviews the companies on the existing list, and sees if there are any new companies that can replace the existing ones using the above 3 rules. That’s how Tesla entered the S&P 500 by replacing Apartment Investment and Management Co in December ’20.
If you look at it closely, the S&P 500 is a momentum strategy. They eventually cut companies that don’t grow at the rate of the market (companies that fall out of the list) and add companies that are growing above market rates, which become big enough to be included in the top 500 list.
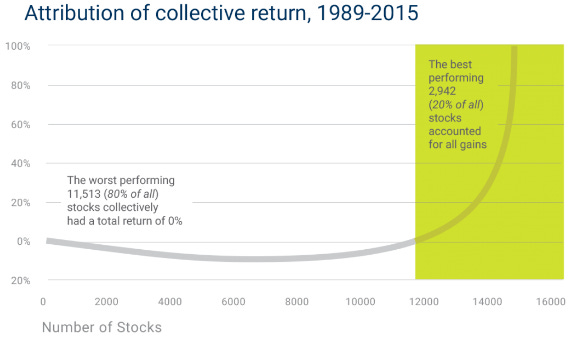
Source: AWealthofCommonSense
80% of the stocks in the total stock market had a real return of 0% during the last 25 years. It's the other 20% that are driving the gains that we attribute to the market. The very nature of a market-cap weighted index means that the best companies eventually rise to the top and get added to the index, and the losers fall out. The cherry on top is that they let the winners ride as long as they are present in the top 500 list and are profitable!
The strategy works because they have remained consistent with it over the past five decades. The index committee does not change strategy based on what’s happening in the market. They don’t wake up one day and say, “you know what, tech stocks are booming, and we should pivot to tech” or “The Fed is planning to increase interest rates - we should cash out and wait for the dip” - They have consistently stuck with the strategy of just buying the 500 biggest profitable stocks in the market!
The power of persistence
Value Line Funds is a classic example of how hard it is to stick to a well-established strategy. The company has been around since the 1950s and runs one of the oldest mutual funds. But when the Wall Street Journal evaluated its performance back in 2005, they found something fascinating.
Value Line company runs two services. One is their investment survey which identifies top value stocks that you should invest in. The company also runs a mutual fund that follows a similar strategy. Investors who followed their stock picks had an amazing gain of 76% over a five-year period (inclusive of the dot com crash!), but those who invested in their mutual fund lost 19% during the same period.
The problem was that the fund never stuck to its own strategy and churned around its management team multiple times. The new managers, hoping to outperform the company’s strategy, dipped into stocks that were lower rated by the company’s own algorithm in the hope of finding “hidden gems” - The results were disastrous!

How to beat the market!
If the market benchmark is based on “buy the biggest companies that are profitable”, shouldn’t we be able to do better by just going one or two steps deeper? That’s exactly what Jim O’Shaughnessy analyzed in his book What Works on Wall Street. He used stock market data from 1926 to 2009 to backtest strategies that reliably beat the market benchmarks.
He just added one more layer to the stock selection process, and the results were stunning:
1. Market Leaders: Invest in companies that are in the top half of the field - That is, greater than average in market cap, shares outstanding, cash flow, and sales. Market Leaders were able to give close to double the return of the S&P 500 while having slightly higher risk (Std deviation and Sharpe ratio). Intuitively, this strategy makes sense, as we are picking the best-performing companies from the biggest companies. Over the long term, this outperformance should be reflected in the stock price, and that’s exactly what we see below!
$10K invested in Market Leaders grew to $536K compared to only $288K if you had invested in the S&P 500.
Returns (1979 to 2009) Source: What Works on Wall Street
2. PE Ratio: If you want to know how irrational we all were in 2020-21, take a look at the following chart.
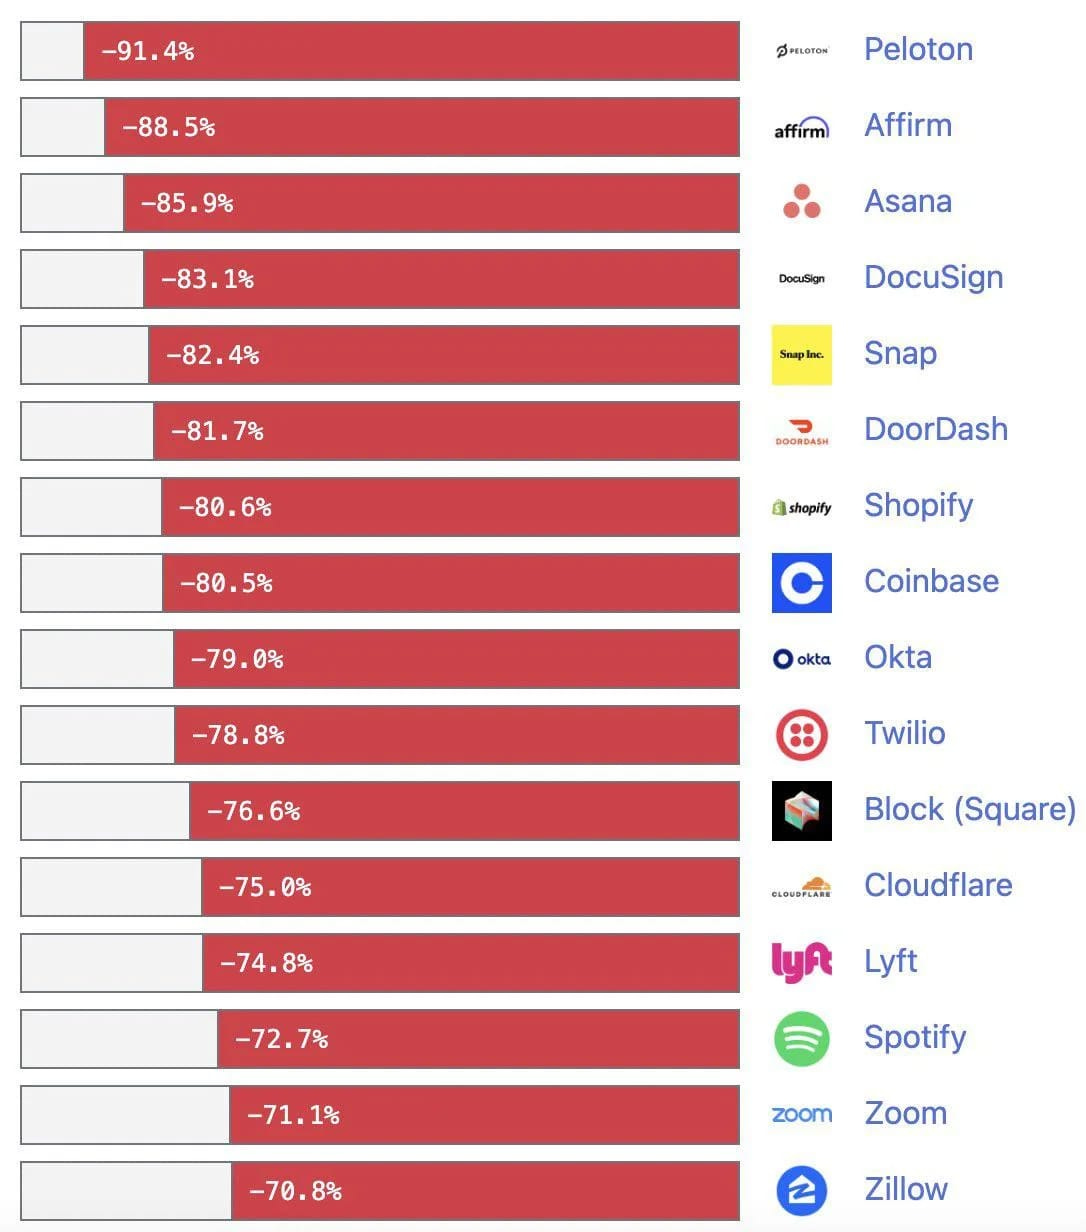
Drop from ATH once the Fed started raising rates
Most growth companies dropped like flies once the interest rates started going up. When you buy into companies due to an amazing story and an expectation of future growth, you are most likely bound to be disappointed in the end. O'Shaughnessy’s analysis proves the same - (emphasis added throughout, edited for clarity):
Both All Stocks (comparable to the Total Stock Market) and Large Stocks(comparable to the S&P500) with high PE ratios perform substantially worse than the market. Companies with low PE ratios from both the All Stocks and Large Stocks universes do much better than the universe. In both groups, stocks with low PE ratios do much better than stocks with high PE ratios. Moreover, there’s not much difference in risk. All the low PE groups provided higher returns over the periods, with lower risk than that of the universe. - Excerpt from What Works on Wall Street.
Returns (1964 to 2009) - Source: What works on Wall Street (Note - Earnings/Price decile 1 would be the stocks having the lowest Price/Earnings)
Most Wall Street and investment experts often use mental heuristics for making important investment decisions. When confronted with vast amounts of data, our brain has a funny way of taking shortcuts to help make decisions. This can be based on the story that we hear about the company, our personal bias towards the founders, or our experience with the product - and in most cases, we would be wrong!
The only way to overcome this is by not letting subjective judgments into our analysis and letting data guide us. Only the empirical relationships between data and the outcome must be used to reach conclusions.
Who knew beating the market would be as simple as adding one more layer to the market indices, proving the outperformance by backtesting it over decades of data, and then just sticking to the plan?!
That's all for this report! We hope you enjoyed it.
Tomorrow, we will be covering one of the most important investing ideas you've never heard of: Shannon's Demon.
See you tomorrow! Hit reply to this e-mail to let us know what you think. If someone forwarded this email to you, you can subscribe to Market Sentiment here.
Further Reading
651 N Broad St, Suite 206, Middletown, Delaware 19709
Unsubscribe · Preferences