The TV industry's own figures suggest most under-40s are no longer watching
Length: • 4 mins
Annotated by Andrew

Welcome to a midweek update from Unmade. Today we dig into the first months of Total TV data to look for audience trends. Further down, a good day for the radio players on the Unmade Index.
You won’t read this content elsewhere. You can support Unmade by becoming a paying member. Upgrade today.
Will broadcasters ever reach 20m weekly viewers again?

Back in May, the TV industry finally started sharing a new metric: Total TV. Combining viewing numbers not just for linear television broadcast over the airwaves, but also ad-supported streaming, the number helps the broadcasters put their best foot forward.
Intended to counteract the headlines about falling overnight audiences, the Total TV number is a way for the industry to credibly argue that it retains reach and relevance. Which is fair enough: overnight linear viewing is one part of the puzzle; live streaming is another, while catchup and on-demand viewing is yet another piece.
Data driven marketers primarily want to know how many people in their target demographic they can reach, and to be able to calculate whether the price is worth it.
Among the data being published by OzTAM, the element that optimises the industry’s story is that of its cumulative weekly reach. It captures live viewing over the airwaves, both in metro and regional markets, live viewing via streaming, plus catchup viewing via streaming and PVRs (remember them?).
Along with Seven, Nine, Ten and SBS, the Total TV also includes viewing of the ABC’s output. (Incidentally, there’s a case here of the commercial sector trying to have its cake and eat it. ABC viewing contributes to a bigger headline reach number for Total TV, even if its not an audience accessible to advertisers. But in much of their own analysis, they then exclude ABC and SBS data and focus only on commercial share.)
Yet, with all those caveats, the Total TV data has now been around long enough to start spotting trends. That data will be even more useful once it hits the one-year mark. There are now 37 weeks worth of published data available.
First the impressive bit:
Take Week 2 of the 2024 ratings year, covering January 7 to January 13. Of the estimated 27m population, the Total TV weekly reach number is 18.635m. In other words, 69% of Australians watched the output of the broadcasters, either online or over the air. That’s good evidence that TV remains a major medium.
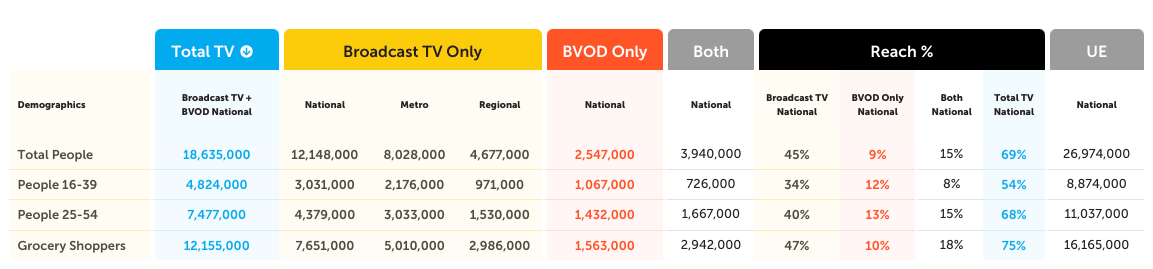
Reach in the key advertising demographic of 25-54 was 7.477m last week, out of a universe of 8.874m - that’s 68%. Still not bad.
More concerning though is the 16-39 demographic - reach was 4.824m, or 54% of that universe. Take out ABC viewing, and that number would likely fall below 50%. In other words, the majority of people under the age of 39 had nothing to do with Australia’s commercial TV networks last week, online or on air.
That of course is just a snapshot of last week. I’ve charted all 37 weeks of data to see what trends that shows.
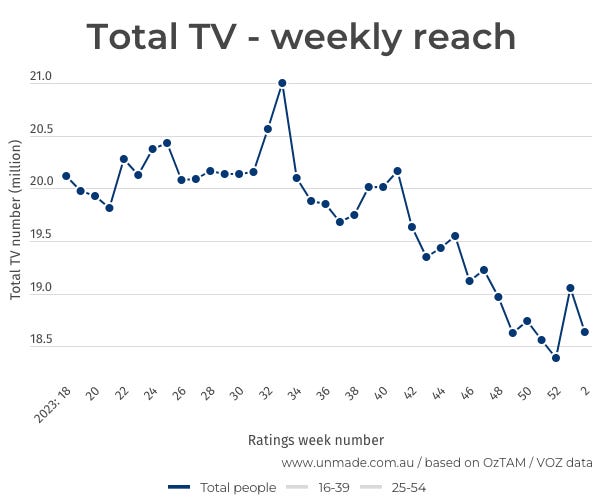
We’ll start with total people.
The biggest week last year was Week 33 (August 13-19), when our broadcasters reached an estimated 21.005m, based on the OzTAM data. You probably guessed correctly - yes, it coincided with the Matilda’s World Cup efforts. As it happens, because OzTAM doesn’t capture most out of home viewing, that number probably deserved to be higher.
How Unmade covered the Matilda’s viewing data:

But as the chart above shows, Total TV viewing has been in decline since then. The last time the industry delivered a weekly reach number above 20m was in Week 41. I wonder if we’ll ever see that number again, even with the Olympics coming down the track.
That Total TV downwards trend is even more obvious in the advertiser friendly demographic of 25-54.
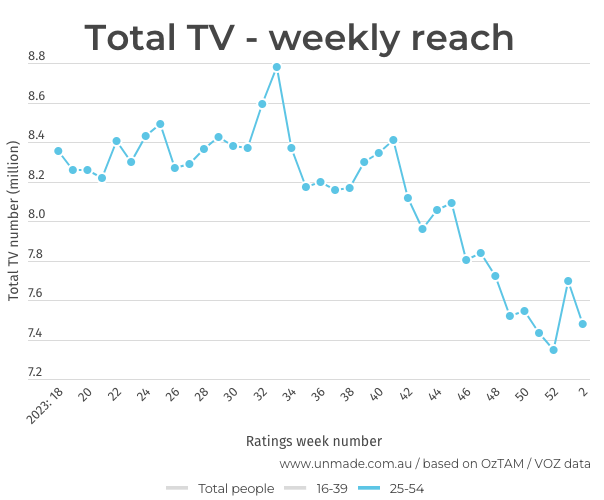
Back in May, when the Total TV number began, the weekly reach was 78% of the 25-54 population. Last week (admittedly in a mostly dead ratings week of summer) it was 68%. The broadcasters haven’t reached more than 8m 25 to 54-year-olds across a week since mid-November.
And the dropoff is even clearer in the 16-39 segment.
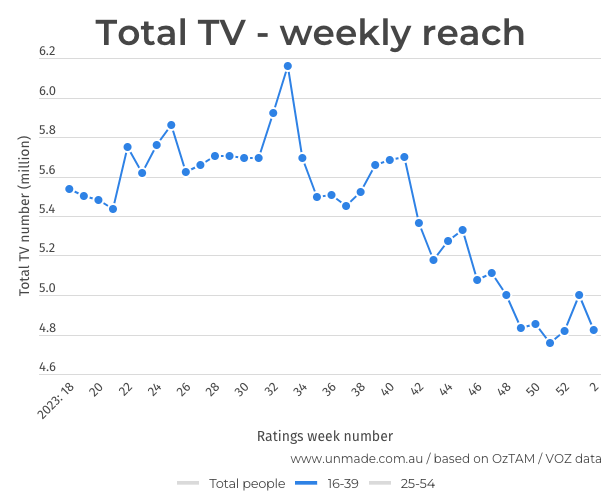
Until we have a full year of data, so we have proper period-on-period comparisons, it’s worth being cautious in drawing too many conclusions. The next big signal to look out for will be in mid-February when the official ratings year resumes in Week 7, after the end of the tennis and cricket.
Stay tuned.

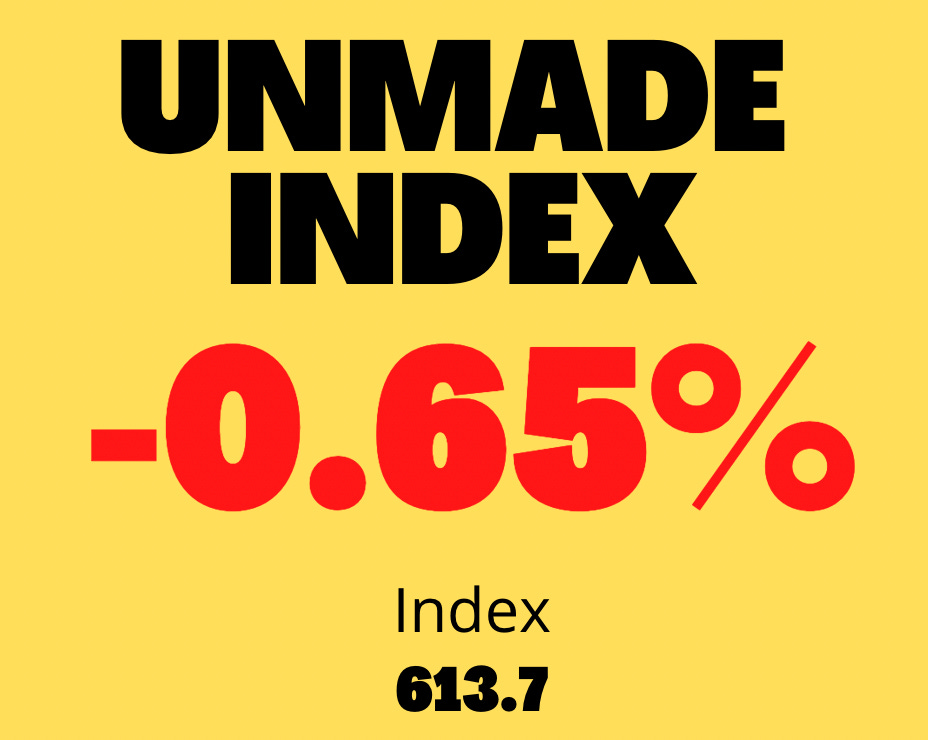
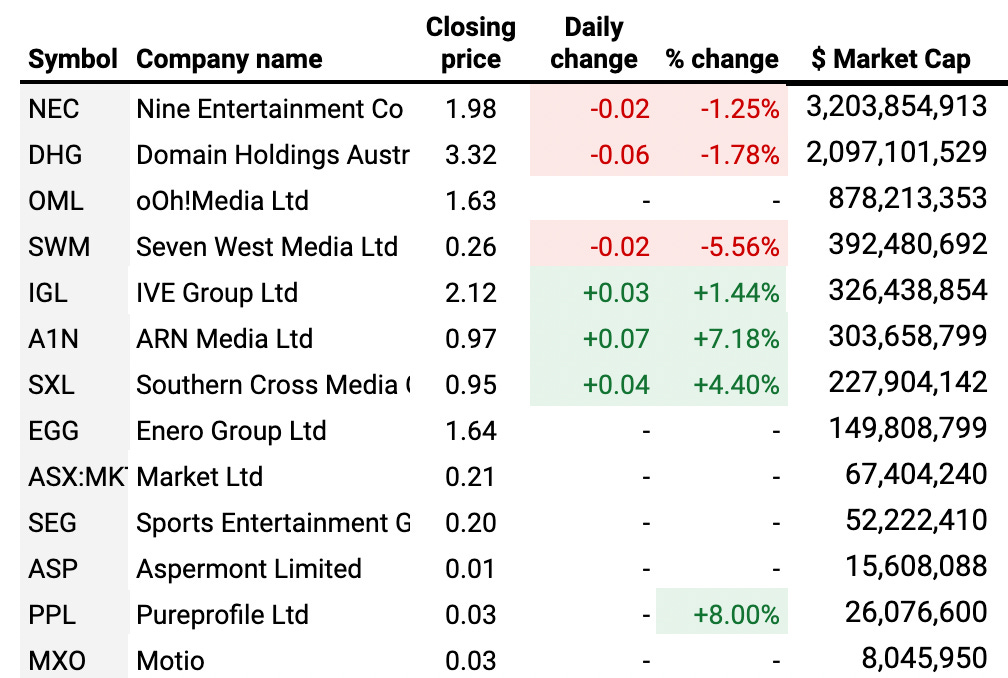
Audio players lead the Unmade Index
The big two audio companies Southern Cross Austereo and ARN Media, had a good day on the ASX yesterday, rising by 4.4% and 7.18% consecutively, even as the Unmade Index dipped downwards.
The biggest fall on the Unmade Index, which charts Australia’s listed media and marketing companies, was Seven West Media, down by 5.56%, taking its market capitalisation back below $400m.
Time to leave you to your Wednesday.
We’ll be back in audio form tomorrow, with highlights from the Sydney panel of Unmade’s Compass 2024 predictions event, held late last year.
Have a great day.
Toodlepip...
Tim Burrowes
Publisher - Unmade