Bond math is now key to today's financial markets
Length: • 2 mins
Annotated by Chris Herrera
Bond math is now key to today's financial markets
Let know if you'd like the sheet.
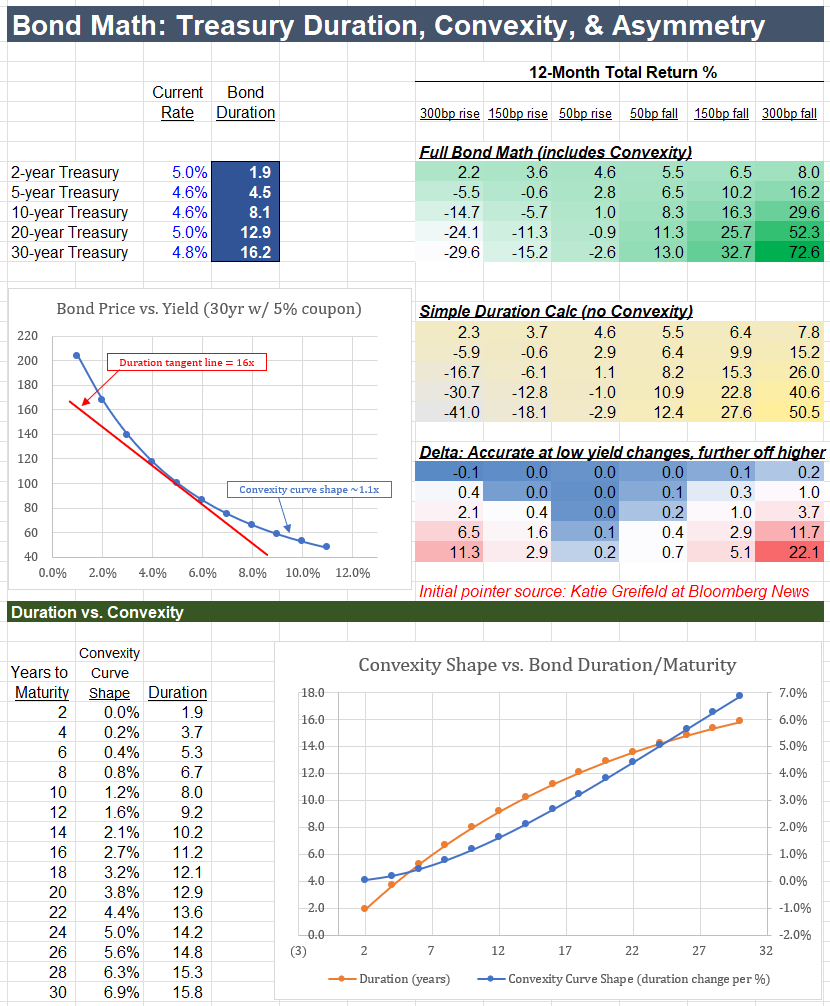
The table on the right reflects a powerful new dynamic:
If rates fall 50bps, 20yr Treasuries earn 11.3% over the next year.
But if rates rise by 50bps, they lose just 0.9% -- an 11:1 up/down ratio.
The 5 year-average 20yr yield is just 2.5%, compared to today's 5%+ yield.
At that lower history, the same 50bps up/down math sat at just 2:1, much less skewed.
So in the context of recession fears, commodity shock, and mixed econ data, that return skew is drawing cross-asset investors -- hedge funds & asset managers normally less involved in Treasuries.
This competition for capital is one of many mechanisms by which higher rates challenge equity returns.
Several items are pushing long rates up: the rise of JGB long rates, US deficits, persistent inflation, the dollar, and others.
But implicit in the new investor framing of long-bond risk/reward is also the changing impact of the duration math, and the role of convexity across the curve.
Which is worth understanding.
Duration describes the average time it takes to receive any set of cash flows.
Whereas a bond's maturity is simply the date principal is repaid.
As a result, maturity and duration differ if there is a coupon: the larger the coupon relative to the principal (& price), the shorter the relative duration.
So, if a 10yr bond at par has no coupon, its duration is 10 years.
If the same bond has a 10% coupon, its duration is 6.5 years, since much of the total cash investors get comes in every year via coupon.
But the duration has another very useful property:
It also exactly equals the bond price change associated with a 1% change in its yield.
Thus, for the same 6.5 year duration bond, if the yield falls to 9%, the price rises from 100 to exactly 106.5.
The next question is how duration changes:
Is the 6.5 duration constant as yields move from 10% to 9% to 8%?
No -- because the weighted average life has changed at each increment.
This change is the bond's "convexity."
And it is the driver of why a 3% rate fall means a gain of 70%+ while a 3% rise means a loss of just 30%.
You can see that difference in the first chart below:
Red is the duration of a 5% coupon / 5% yield 30-year bond: 16 years.
Blue is the actual bond price across yields.
The difference between the two lines is the effect of convexity:
The price change slows as yields rise
And rises steeply as yields fall.
Next shows the curve of convexity itself shifting across maturities.
Directional views on Treasuries here are a function of growth path, fed policy, and a host of other factors.
Sometimes you make that bet.
But other times, or if you're restricted to markets competing for scarce capital,
Knowing the asymmetries & reaction functions across markets
Improves your ability to anticipate and act
In your area of focus.
That's all for now.
Let know if you'd like the math.
