Average Global Income [2023]: What Is The Median Income Worldwide?
Author: Zippia
Length:• 7 mins
Annotated by Peter
Research Summary: Whether you live in the US or not, it can be hard to imagine what the average global income of the world’s collective population would be. Though the average can be skewed by the highest or lowest income individuals, it’s still fascinating to examine the global statistics.
Overall, here are the insights our extensive research uncovered:
The average global personal income is $9,733 per year.
The average global household income is $12,235 per year.
The median per-capita household income is only $2,920 per year.
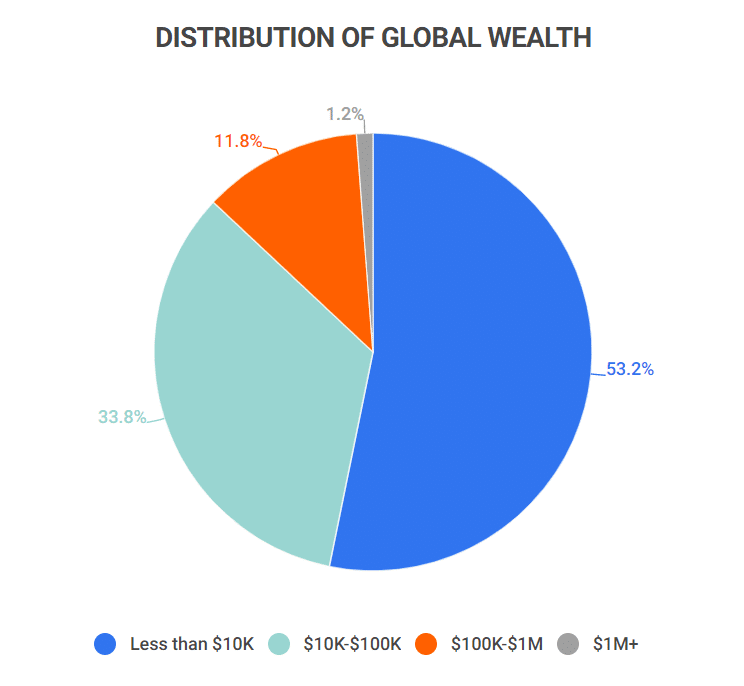
Making over $100,000 puts you in the top 10% of global earners, while making over $1 million puts you in the top 1%.
Average annual income varies a lot by country, with the average global income in some being very little and others exceedingly rich. To find out more, here are some of the most interesting findings:
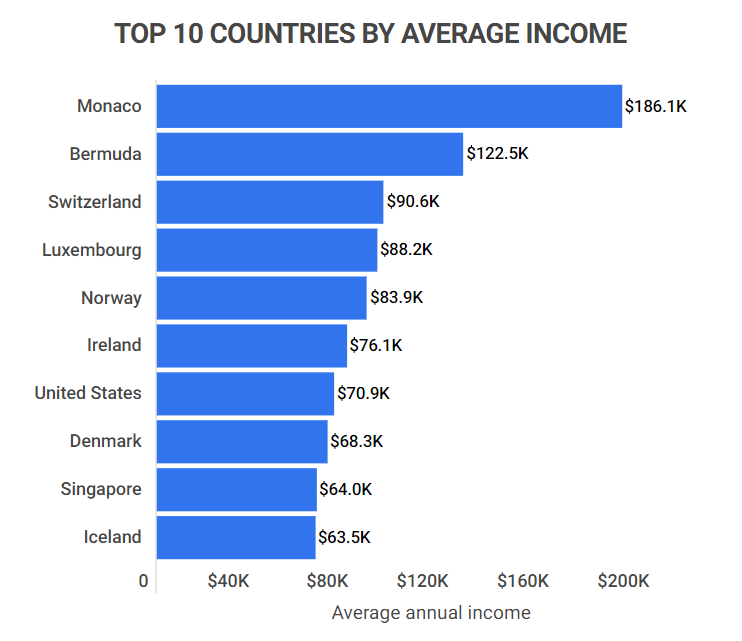
Monaco has the highest average annual income of $186,080. That means the average person in Monaco is in the top 10% of earners globally. Additionally, other counties among the top five include: Bermuda ($122,470), Switzerland ($90,600), Luxembourg ($88,190), and Norway ($83,880). Top 10 Countries By Average Income
Country
Average annual income
Monaco
$186,080
Bermuda
$122,470
Switzerland
$90,600
Luxembourg
$88,190
Norway
$83,880
Ireland
$76,110
United States
$70,930
Denmark
$68,300
Singapore
$64,010
Iceland
$63,460
The US ranks as the country with the 7th highest average income globally. This may very well be skewed, given that over 30% of all billionaires live in the US, and over 28% of households make less than $25,000 per year.
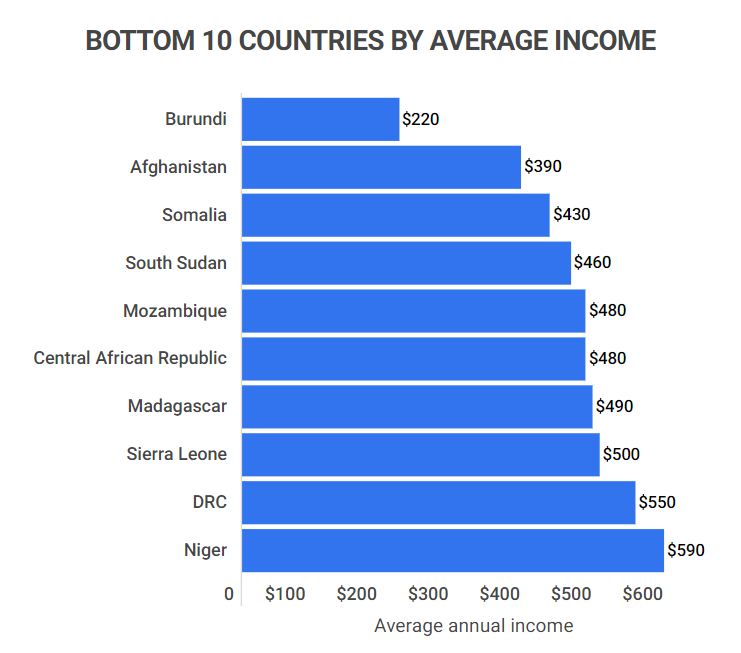
Burundi has the lowest average annual income of $220. That equates to citizens earning only $18 monthly, or less than a dollar daily. Other counties among the bottom five include: Afghanistan ($390), Somalia ($430), South Sudan ($460), and Mozambique ($480). Bottom 10 Countries By Average Income
Country
Average annual income
Burundi
$220
Afghanistan
$390
Somalia
$430
South Sudan
$460
Mozambique
$480
Central African Republic
$480
Madagascar
$490
Sierra Leone
$500
Niger
$590
Average Purchasing Power Parity (PPP) by Country
While it might be shocking to analyze the disparities between average incomes worldwide, it’s important to note that average income on its own doesn’t tell the whole story. For instance, even if people of one country have higher than average incomes, this benefit would be negated by low purchasing power. Consider these interesting statistics:
Luxembourg has the highest PPP by median annual income of $26,321. PPP, or Purchasing power parity, is highest in Luxembourg, meaning that the wealthier than average citizens in this country are also getting the most out of their income. Other countries with high PPP include: UAE ($24,292), Norway ($22,684), Switzerland ($21,490), and the United States ($19,306). Top 10 Countries By Median Annual Income PPP
Country
PPP (Purchasing power parity)
Luxembourg
$26,321
Norway
$22,684
Switzerland
$21,490
United States
$19,306
Canada
$18,652
Austria
$18,405
Sweden
$17,625
Denmark
$17,432
Netherlands
$17,154
DRC has the lowest PPP by median annual income of $395. The DRC is one of the largest countries in Africa and has been struggling with poverty for some time. Other countries with low PPP include: Madagascar ($398), Burundi ($475), Malawi ($484), and Guinea-Bissau ($486). Bottom 10 Countries By Median Annual Income PPP
Country
PPP (Purchasing power parity)
Madagascar
$398
Burundi
$475
Malawi
$484
Guinea-Bissau
$486
Central African Republic
$491
Mozambique
$529
Zambia
$545
Uzbekistan
$591
Rwanda
$621
Luxembourg has the highest GDP per capita PPP of $133,330. Luxembourg also has the highest GDP per capita PPP, which is the final value of all goods and services produced within the year, divided by the average population. Other countries with high GDP per capita PPP include: Singapore ($116,486), Ireland ($105,355), Qatar ($102,018), and Bermuda ($88,185). Top 10 Countries By GDP per capita PPP
Luxembourg
$133,330
Singapore
$116,486
Ireland
$105,355
Qatar
$102,018
Bermuda
$88,185
Norway
$80,535
Switzerland
$77,121
Cayman Islands
$74,155
Burundi has the lowest GDP per capita PPP of $774. Burundi has the lowest income and lowest GDP per capita PPP on earth, highlighting the county’s deep struggle with poverty. Other countries with low GDP per capita PPP include: the Central African Republic ($920), DRC ($1,179), South Sudan ($1,182), and Somalia ($1,249). Bottom 10 Countries By GDP per capita PPP
Burundi
$774
Central African Republic
$920
South Sudan
$1,182
Somalia
$1,249
Niger
$1,304
Mozambique
$1,348
Liberia
$1,564
Chad
$1,566
Madagascar
$1,608
Global Income Over Time
Despite many countries still struggling with poverty, global income has increased exponentially over time. Here are some examples of how the global economy has grown:
Average global income grew 2.7x richer between 1950-2023. The average income in 1950 was only $3,300 per year. This hit one of its highest peaks in 2016 when average global income reached $14,574 (4.4x richer. Today, the average global income is around $12,235 per year.
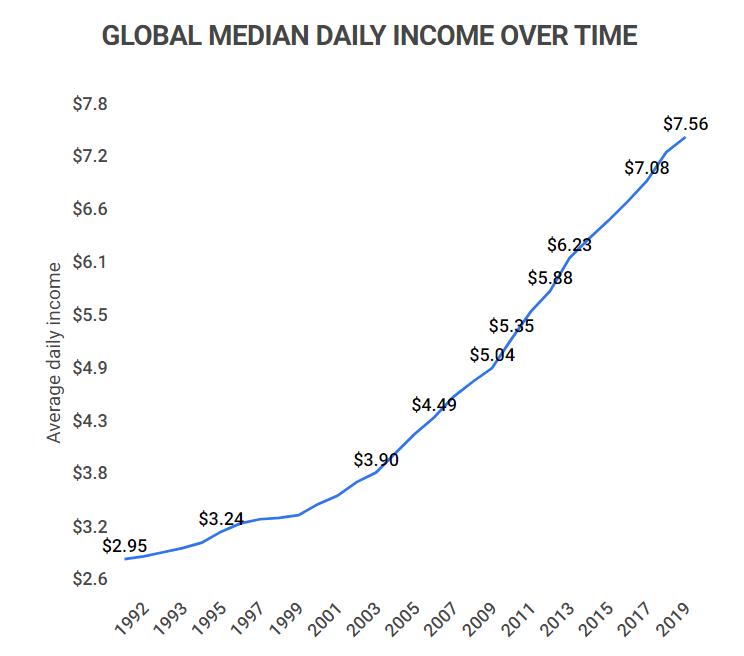
Global median daily income increased by over 150% between 1990-2019. The global median daily income was only $2.95 in 1990. By 2019, that median reached $7.56, and while this might not seem like a lot, it’s a huge relative increase. Global Median Daily Income Over Time
Year
Median daily income
2019
$7.56
2018
$7.40
2017
$7.08
2016
$6.85
2015
$6.65
2014
$6.45
2012
$6.23
2011
$5.65
2010
$5.35
2009
$5.04
2008
$4.88
2007
$4.72
2006
$4.49
2005
$4.32
2004
$4.10
2003
$3.90
2002
$3.79
2001
$3.63
2000
$3.55
1999
$3.42
The income of the top 1% of earners has grown 100x faster than the bottom 50%. The top 1% of earners have seen an $800,000 increase in average wealth within the past 50 years. That’s an astonishing 100x more than earners in the bottom 50%.
GDP per Capita by Country
GDP per capita isn’t the same as the average income, but it can provide some important insights as it relates to income. This is because GDP per capita measures the economic output of a nation per person. To find out more about where each country stands, here are the facts:
Monaco has the highest GDP per capita of $234,315 Though not the most affordable, Monaco is a very wealthy country. Others among the bottom five countries with the highest GDP per capita include: Liechtenstein ($157,755), Luxembourg ($133,590), Bermuda ($114,090), and Ireland ($100,172). Top 10 Countries By GDP per Capita
Monaco
$234,315
Liechtenstein
$157,755
Luxembourg
$133,590
Bermuda
$114,090
Ireland
$100,172
Switzerland
$91,992
Norway
$89,154
Cayman Islands
$86,569
Burundi has the lowest GDP per capita of only $221 Burundi yet again tops our list, and not in a good way. Others among the top five countries with the lowest GDP per capita include: Afghanistan ($369), Somalia ($447), the Central African Republic ($461), and Sierra Leone ($480). Bottom 10 Countries By GDP per Capita
Burundi
$221
Afghanistan
$369
Somalia
$447
Mozambique
$492
Madagascar
$500
Niger
$591
Average Household Income by Country
Average household income tends to be higher than personal income, as it’s typically the combination of two or more incomes. To find out which countries have the highest and lowest household incomes, here are some comprehensive facts:
Luxembourg has the highest average household income of $52,493. Luxembourg has the highest average income for families, with others among the top five including: Norway ($51,489), Sweden ($50,514), Australia ($46,555), and Denmark ($44,360). Top 10 Countries by Average Household Income
Country
Average household income
Luxembourg
$52,493
Norway
$51,489
Sweden
$50,514
Australia
$46,555
Denmark
$44,360
Canada
$41,280
Netherlands
$38,584
Finland
$34,615
Germany
$33,333
Burundi has the lowest median household income of only $673. Others among the bottom five countries with the lowest household incomes include: Liberia ($781), Madagascar ($1,013), Rwanda ($1,101), and Zambia ($1,501). Bottom 10 Countries by Average Household Income
Burundi
$673
Liberia
$781
Madagascar
$1,013
Rwanda
$1,101
Zambia
$1,501
Benin
$1,502
Burkina Faso
$1,530
Togo
$1,571
Mali
$1,983
Sierra Leone
$2,330
Global Income FAQ
What is the average income globally?The average income globally is $12,235 per year. This number relates to GDP per capita, being a measurement of the per-person contribution to a country’s economy. Household income is another measurement that can be used to estimate the average global income. The average household income worldwide is $9,733 per year.
What income is in the top 1% worldwide?An income of $1 million or more puts you in the top 1% worldwide. In the US, you need to make $1.697 million to be in the top 1%, which is fairly similar to the global average. The vast majority of the population, 87%, make less than $100,000 per year worldwide.
What country has the highest average income in the world?Monaco has the highest average income of $186,080 per year. This country also has the highest GDP per capita of $234,315, making it one of the richest countries on the planet. The only other country that sometimes tops the charts in this regard is Luxembourg, which has the highest average household income of $52,493, as well as the highest PPP by median annual income of $26,321.
What country has the lowest average income in the world?Burundi consistently ranks as having the lowest income in the world, with an average annual income of only $220 per year. Burundi is at the bottom by almost every metric, including:
A GDP per capita PPP of $774
A GDP per capita of $221
A median household income of $673
The only other country that ranked on the bottom was the DRC, which has the lowest PPP by the median annual income of only $395.
Conclusion
Many measurements can determine the average income in a country. From household income to GDP per capita, the disparity between different countries across the globe is massive.
Countries like Monaco and Luxembourg have some of the wealthiest citizens in the world, with averages of well over $100,000 per person. While countries like the DRC and Burundi still struggle with crippling poverty.
The US, while being among the richest countries, still only has the seventh-highest average annual income in the world.
While we still have a long way to go in terms of battling poverty, it’s also important to highlight just how far we’ve come. Average global income grew 2.7x richer between 1950-2023, from only $3,300 per year to $12,235 today.