What Does it Take to Optimize a Complex System?
Length: • 6 mins
Annotated by Zakhar
Using Systems Engineering and cadCAD to Manage Difficult Trade-Offs
This is a short piece to walk the reader through the theoretical design of a complex, multi-stakeholder system — in this case, a bridge over protected wetlands. Through this hypothetical engineering feat, we look at some common challenges faced by systems designers and offer a glimpse into strategies and considerations in a high level introduction to computer-aided design of complex systems.

Measuring the Utility of Multi-Stakeholder Systems
Imagine building a bridge between two existing roads, currently separated by ecologically-diverse wetlands. The raison d’être for the bridge is to create a stable, safe traffic connection between the two roads, but there is a community ‘common good’ desire to disrupt the wetland ecosystem as little as possible. Out of all of the possible bridge designs, selecting one that balances these goals is a daunting task, particularly since, once the bridge is built, it’s usually difficult or impossible to change the bridge’s fundamental characteristics.
To make matters even worse, the wetlands themselves are subject to occasional (but random) flooding. Although outside of the control of the bridge builders, bridge construction is constrained by the severity and duration of flooding that might occur in the future.
What’s the best way forward?
Modeling and Simulation
Systems modeling allows us to think through the design process without introducing a priori decisions about design that are (at first) untested. For instance, because we can model both the bridge’s stability and the wetland ecosystem, it’s possible to simulate a variety of different bridge designs, and assess the impact of each design with metrics that, while quantitative, are linked to the overall goals of the bridge’s construction. Simulations also provide an arena to create different “universes” of conditions outside of the designer’s control (such as flooding), by allowing one to create multiple random scenarios, such as flooding outcomes, and to create metrics for different designs for each scenario.
What is cadCAD?
cadCAD (short for complex adaptive dynamics Computer-Aided Design) is an open source modeling framework for research, validation, and Computer Aided Design of complex systems. cadCAD has a reference implementation in Python that integrates well with pre-existing data science toolkits. It supports varied multiscale system modeling approaches and can be easily integrated with common empirical data science workflows. Monte Carlo methods, which can help account for uncertainty in a system, A/B testing, and parameter sweeps, which allows for more fine tuning — are features are natively supported and optimized for within the tool.
Given a model of a complex system, cadCAD can simulate the impact that a set of actions might have on it. This helps individuals or organizations make informed, rigorously tested decisions on how best to modify or interact with a complex system in order to achieve their desired goals.
All Models Are Wrong...But Some Are Useful!
There will generally always be a mismatch between a model, which is an abstraction of reality, and its representation of real-world phenomena. To overcome this, a class of models is created, usually parameterized by one or more values, and instances of the class are exposed to the different simulation scenarios representing alternate ‘universes’, as described above. By examining how different instances are ranked according to their metrics, the relative success or failure of satisfying one or more overall system goals can be assessed.
In our example, a bridge model with an open conduit for wildlife to pass safely under the bridge can be parameterized by conduit diameter, or the location of that conduit along the span of the bridge: this is the class of models. Selecting a particular conduit diameter, or at what point along the span of the bridge the conduit is located, could be instances of the class. If the scenarios tested describe different levels of flooding, each instance can be assessed according to metrics such as the relative safety of wildlife transit through the conduit, and the relative stability of the bridge during flooding, as the conduit diameter and location changes.
System Goal Thresholds
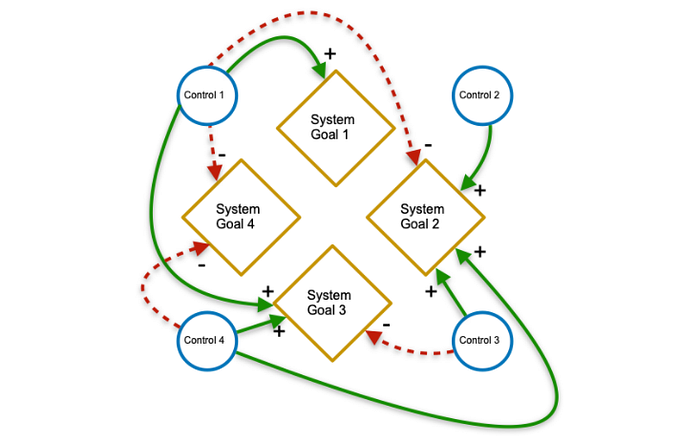
Of course, having multiple metrics does not necessarily mean that a single model instance will arise that scores the highest for every metric. In fact, in general it is not the case that a single instance is capable of satisfying every metric for 100% of the simulations. This is because system goals are usually specified by different stakeholder “views” on the design problem — in the bridge design example, a local business district may desire a system goal that is at odds with a local conservation association’s system goal. Although each stakeholder may wish for their system goal to “drive” the simulation assessment, in practice a systems engineering workflow will allow system goals to be ‘weighted’ according to their relative performance — and these weights can themselves change as simulation results are obtained.
It may be that there is a range of conduit diameters which are rock-solid for bridge stability, but constrain wildlife transit to levels that are ecologically unsustainable. By increasing the weight given to ecosystem sustainability slightly, simulations might then demonstrate that another range of conduit diameters sustain the ecosystem, while (say) increasing the possibility of bridge instability to a single event over the bridge’s expected lifetime. Depending upon the stakeholder’s (and regulator’s) risk tolerance, this may be an acceptable threshold of risk.
Risk Management and Balancing Trade-Offs
Interpreting system goals as metrics with thresholds provides a way for system simulations to be properly interpreted as statements about probabilities, rather than incorrectly interpreted as perfect “magic numbers”. In this way the approach dovetails nicely with traditional risk management practices (including those for selecting actual bridge designs!) by assessing the risk of a particular outcome. It allows for the specification of worst-case scenarios and is also explicit about the relative weightings between metrics, which ultimately reflects the stakeholders’ relative weightings of and between the system goals. Through this process of analyzing trade-offs, system engineers can more deeply consider the ramifications of various design choices.
In addition to engineering trade offs, another major challenge in complex system design is planning for unintended consequences. While systems design patterns for bridges are often replicable to a degree (e.g. suspension bridges, beam bridges), the class-instance relationship of these designs needs to be kept in mind for the proper parameterization of a class of bridge in a specific location. Fortunately, design and simulation tools are well-established within existing engineering disciplines, allowing for the ‘alternate universe’ analysis described above to explore unanticipated scenarios.
Without the use of computer-aided design tools like cadCAD, web3 systems designers are in a challenging position where they may fail to recognize the non-linear impacts of complex systems. With the richness of data from the multidimensional views offered by cadCAD, systems engineers can combine the best of human experience and intuition with the computational projections of data-driven simulation.
The Systems Engineering Looking Glass
Complex systems engineering is a vast landscape. Designing for multiple stakeholders, with varying agent behavior and uncertainties requires the careful selection of trade-offs. With tools like cadCAD, and by employing goal thresholds that offer a more granular view of design choices, engineers can better assess and optimize for system goals.
In the case of our bridge, we aim to identify the ‘alternate universe’ in our cadCAD simulations where wildlife can continue to flourish, drivers can cross safely, and bridge construction withstands environmental shocks (flooding, earthquakes, etc) for decades to come. While we don’t know with any certainty which ‘universe’ we will end up in (given that external shocks to the environment are often unpredictable), by simulating the outcomes of various scenarios with computational assistance, we can to the best of our ability select and build for the universe achieves these goals, by utilizing the power of data-driven decision making under uncertainty.
Article by Jamsheed Shorish and Danilo Lessa Bernardineli , with edits and clarifications from Michael Zargham , Jeff Emmett and Jessica Zartler .
Further Reading
cadCAD
To learn more about cadCAD, educational opportunities for this new tool, or to explore completed models and resources, check out this cadCAD Onboarding TL;DR
BlockScience
Keep up with our latest research on our Twitter and Medium, or explore our library of presentations, academic papers and recent media on our website.
BlockScience ® is an engineering, R&D, and analytics firm specializing in complex systems. Our focus is to design and build data-driven decision systems for new and legacy businesses leveraging engineering methodologies and academic-grade tools.
With deep expertise in Blockchain, Token Engineering, AI/Data Science, and Operations Research, we are able to provide quantitative consulting to technology enabled businesses. Our work includes pre-launch design and evaluation of economic business and ecosystem models based on simulation and analysis. We also provide post launch monitoring and maintenance via reporting, analytics, and decision support tools.