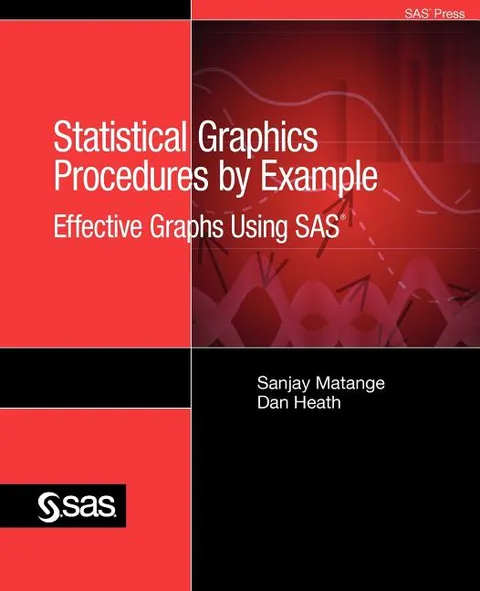
Statistical Graphics Procedures by Example
Effective Graphs Using SAS
Report an issue
Tell us what's wrong and we'll take a look.
Thanks – we got it. We'll review and follow up if needed.
Among the topics included are how to combine plot statements to create custom graphs; customizing graph axes, legends, and insets; advanced features, such as annotation and attribute maps; tips and tricks for creating the optimal graph for the intended usage; real-world examples from the health and life sciences domain; and ODS styles.
The procedures in Statistical Graphics Procedures by Example are specifically designed for the creation of analytical graphs. That makes this book a must-read for analysts and statisticians in the health care, clinical trials, financial, and insurance industries. However, you will find that the examples here apply to all fields.
Sanjay Matange
Sanjay Matange is an R & D Director in the Data Visualization Division at SAS, responsible for the development and support of ODS Graphics. This includes the Graph Template Language (GTL), Statistical Graphics (SG) procedures, ODS Graphics Designer, and other related graphics applications. Sanjay has extensive experience in building complex graphs for all domains including Health and Life Sciences. Sanjay has been with SAS for over 25 years and is coauthor of two patents and the author of three SAS Press books.
More by Sanjay Matange





Why Readwise Books?
Readwise Books is an ebook & audiobook platform that automatically logs how much you and your friends read, making it fun and easy to read more. Learn more →